3524
Investigating microscopic diffusion anisotropy in the human kidney using multidimensional diffusion encoding1Developmental Imaging and Biophysics Section, UCL Great Ormond Street Institute of Child Health, London, United Kingdom, 2Radiology, Brigham and Women’s Hospital, Boston, MA, United States, 3Harvard Medical School, Boston, MA, United States, 4Physical Chemistry, Lund University, Lund, Sweden, 5Random Walk Imaging AB, Lund, Sweden, 6Leonard Wolfson Experimental Neurology Centre, UCL Institute of Neurology, Queen Square, London, United Kingdom, 7Department of Brain Repair and Rehabilitation, UCL Institute of Neurology, Queen Square, London, United Kingdom
Synopsis
Diffusion tensor imaging (DTI) has been widely used to provide tissue microstructure measures such as fractional anisotropy (FA). Advances in diffusion acquisition methods (e.g. efficient spherical tensor encoding) have enabled more specific microstructural parameters to be derived, including microscopic fractional anisotropy (µFA). This work focused on extending our initial observation of µFA in the kidney through a detailed analysis of the linear and spherical diffusion encoding in healthy subjects, by comparing conventional FA to the µFA in human kidneys, and investigating the technical limitations of the current approach.
Introduction
FA from DTI has been widely used in the kidneys as a non-invasive probe of tubular integrity and the geometric arrangement of microscopic structure (e.g. in renal allografts1). However, FA is known to be confounded by microscopic anisotropy and orientation dispersion within voxels. Recent advances in the design of multidimensional diffusion MRI (MD-dMRI) acquisition schemes have enabled efficient spherical tensor encoding on clinical systems2,3 which allows the two phenomena to be disentangled and thus to measure microscopic diffusion anisotropy (µFA) independently of orientation dispersion4–7. This work extends a recent initial study of renal µFA8 through a detailed analysis of the linear and spherical tensor encoded (LTE/STE)9 signal in healthy subjects, a preliminary comparison to standard FA from LTE acquisitions, and an overview of current challenges in MD-dMRI of the kidneys.Methods
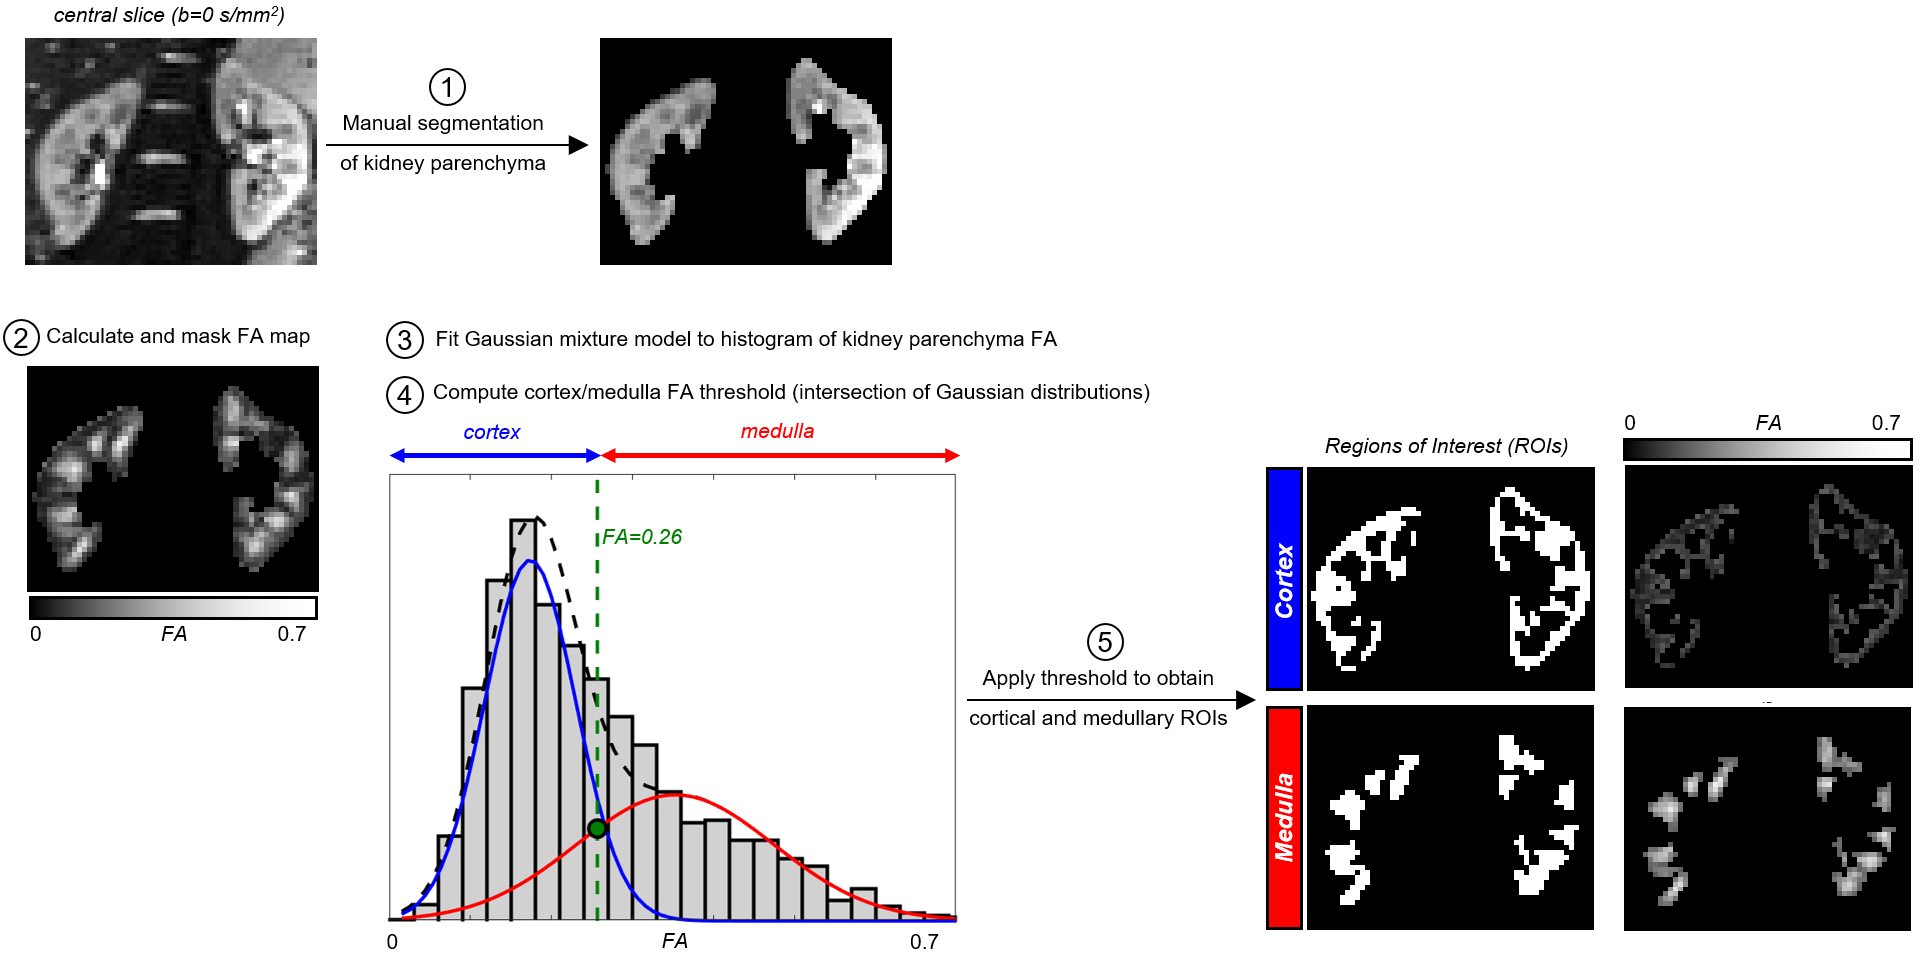
Ten healthy volunteers (age 31±6 years) were scanned on a 3T Siemens Prisma system using a prototype spin-echo sequence with EPI readout that facilitates diffusion encoding with variable b-tensor shapes. Data was acquired with LTE and STE2 using FOV=288x288mm2, voxel size=3x3x(4–4.6)mm3, 11 coronal oblique slices, TR=3000ms with the acquisition window limited to 1500ms to allow significant T1 recovery between volumes while simultaneously reducing motion artefacts; TE=87ms; 3/4 Partial Fourier and GRAPPA R=2 in-plane acceleration; b-values(s/mm2)/averages=[0,250,500,750,1000]/[4,2,2,2,2]; 12 directions. The nominal scan time was 5min30s for each of the encoding schemes and respiratory triggering (end-expiration) was used. Retrospective motion correction (image registration) of individual diffusion-weighted volumes before powder averaging was performed separately for each kidney using elastix10. Model fitting was performed with FSL11 and the MD-dMRI toolbox12 (gamma model7). The whole kidney parenchyma was manually segmented in the mean b=0 image. To reduce operator bias, subsequent cortical/medullary regions of interest (ROIs) were segmented using an automatic FA-based algorithm developed in-house (Figure 1).Results
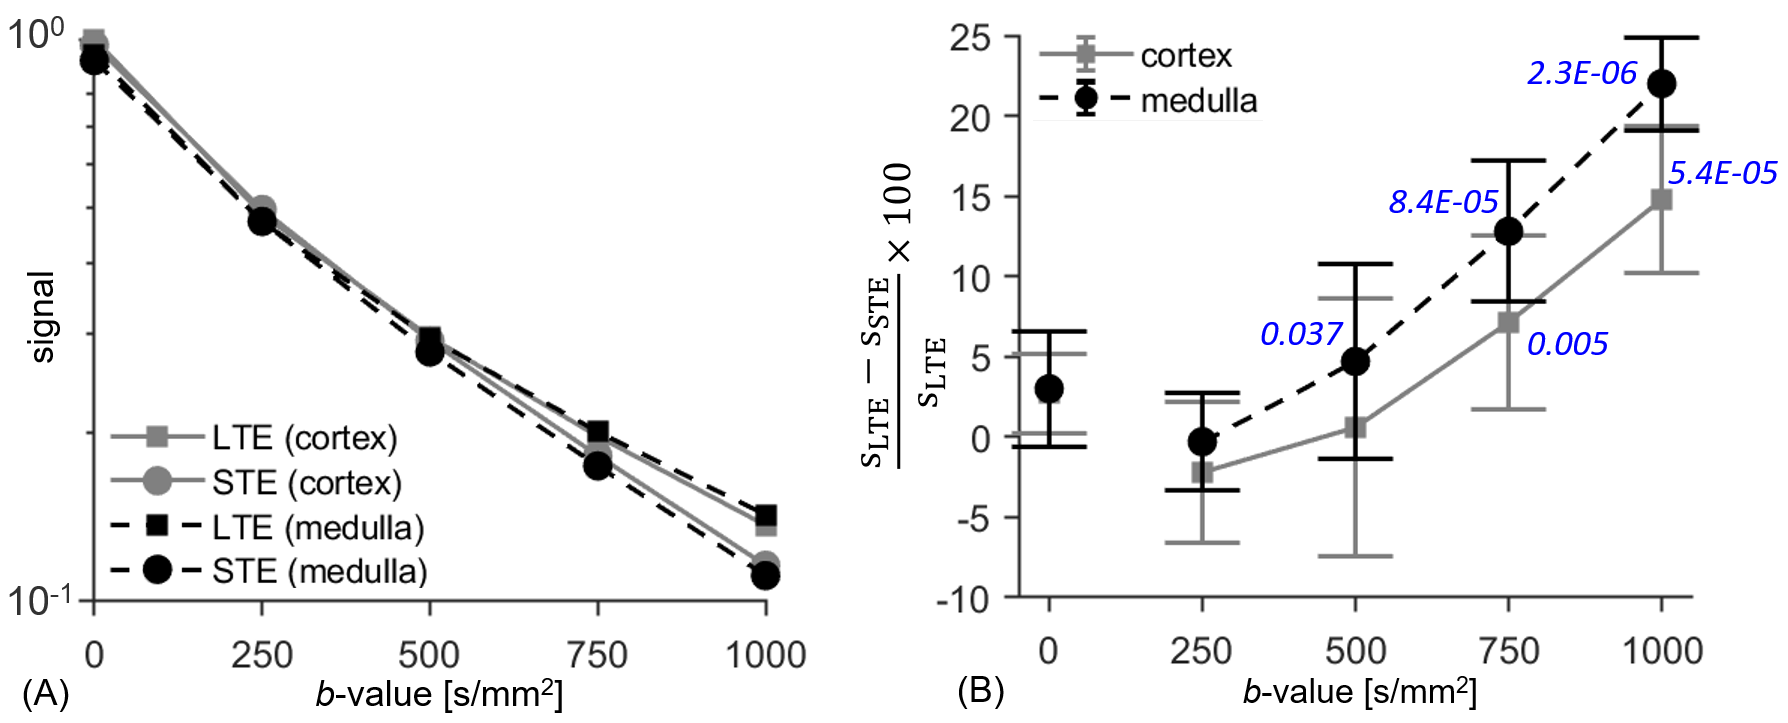
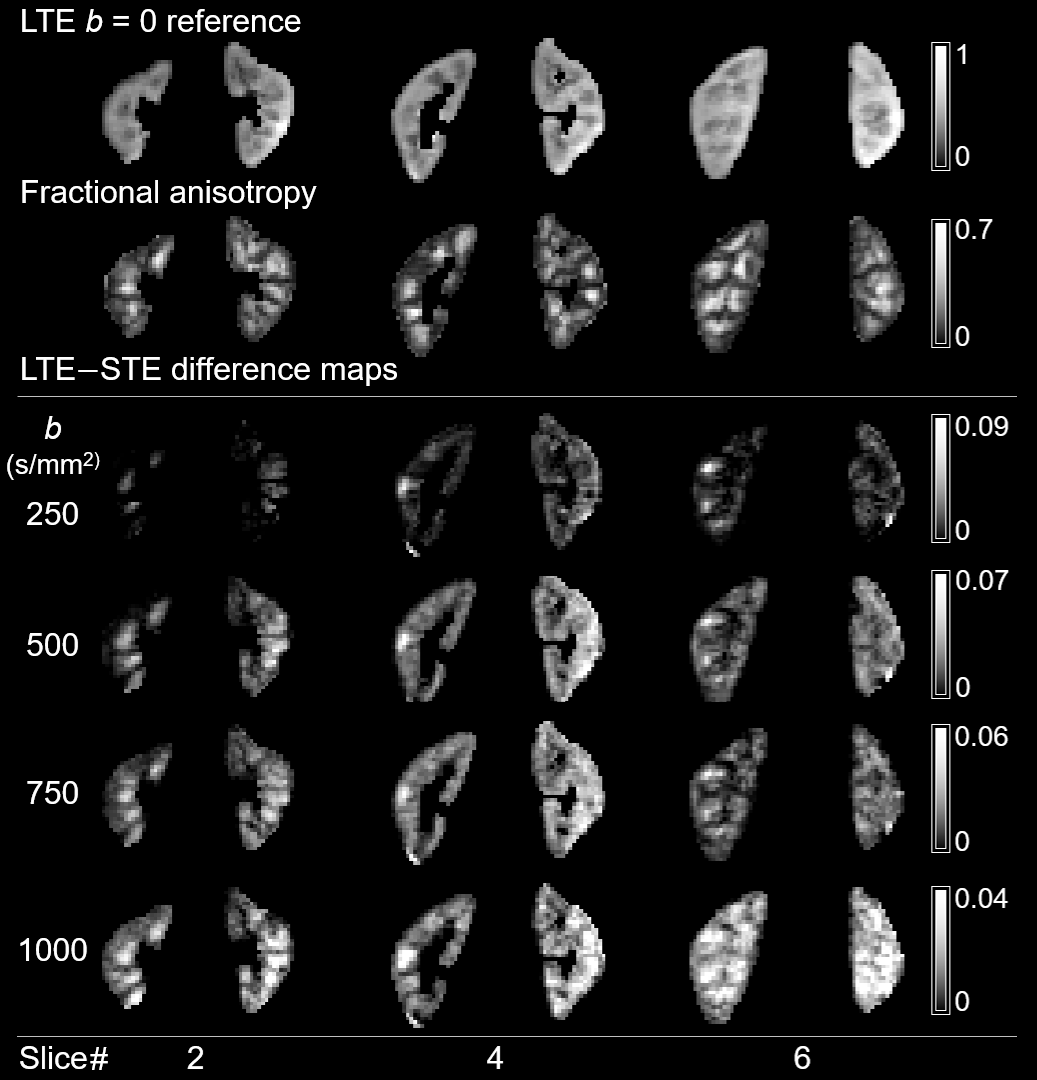
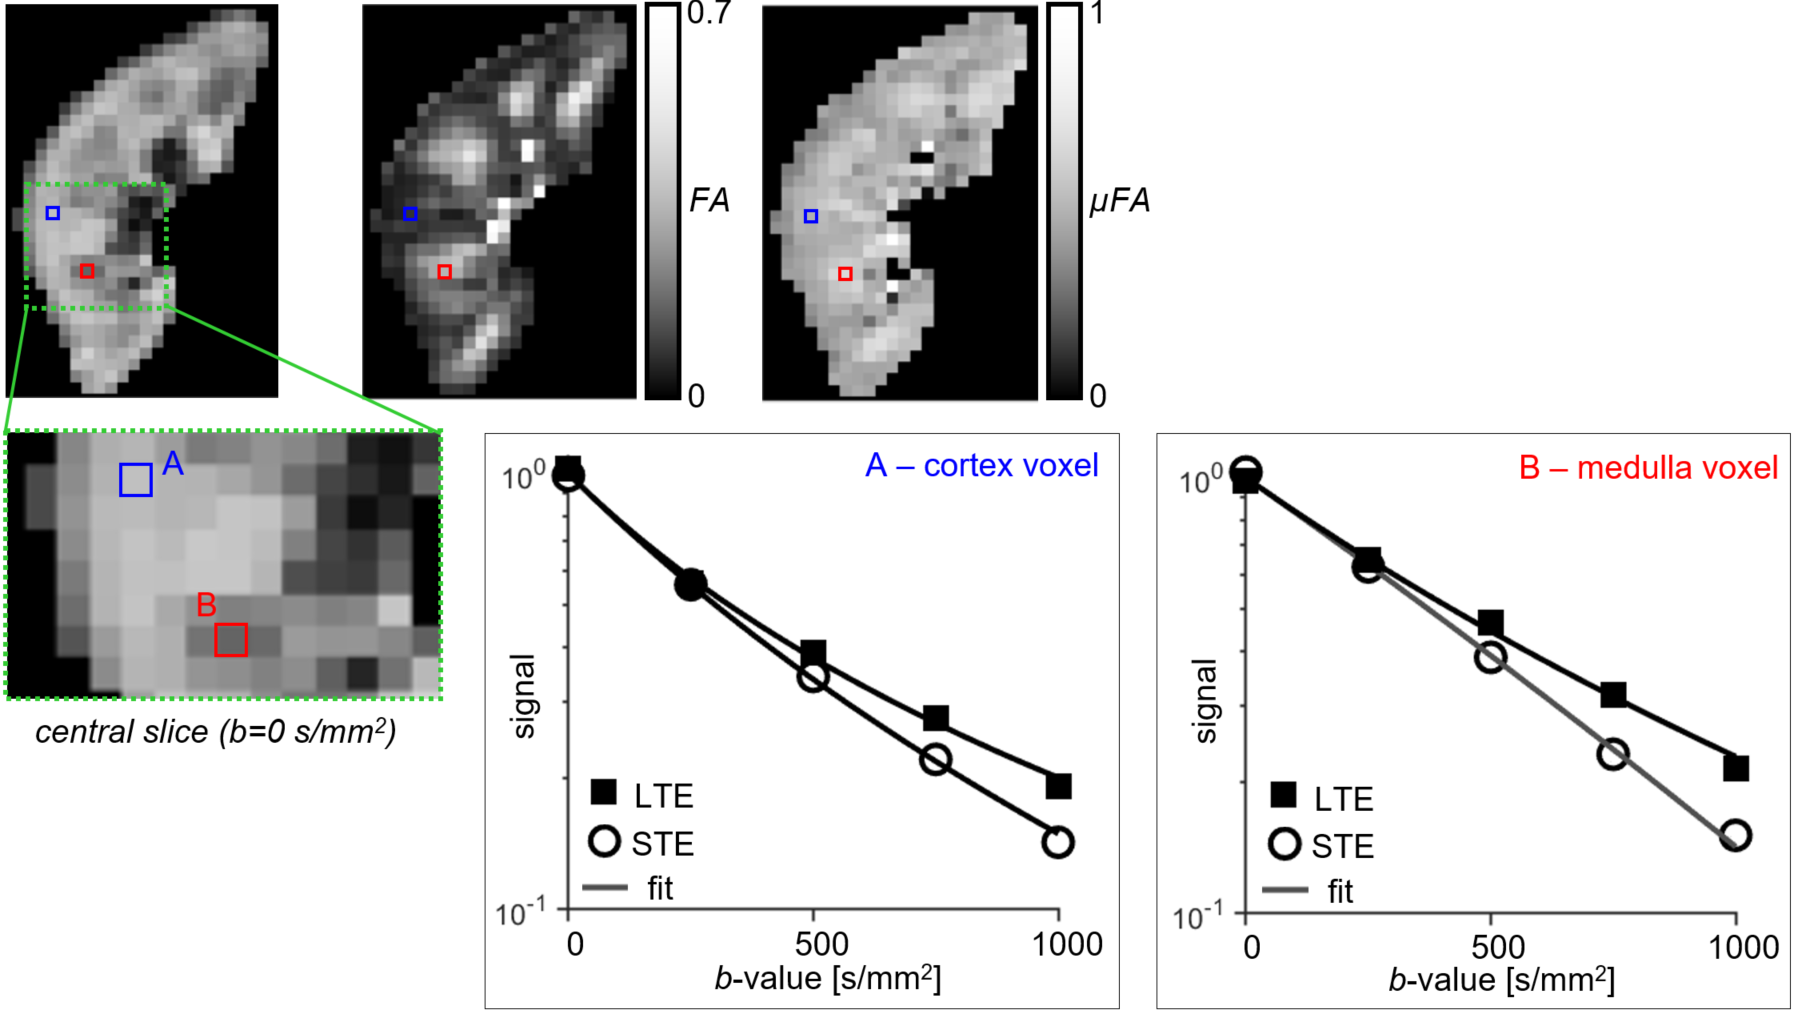
All LTE and STE data had sufficient quality for analysis. LTE and STE signal and the normalised signal difference vs. b-value for medulla/cortical ROIs averaged across the 10 subjects are shown in Figures 2A and 2B. The hallmark of microscopic anisotropy (µFA>0) is divergence of STE and LTE signal with increasing b-value. Figure 2B shows a clear trend of increasing relative difference between LTE and STE signal with increasing b-value in both kidney parenchyma regions (cortex/medulla). Statistically significant LTE-STE signal differences (t-test, p<0.05) were found from b=500s/mm2 in the medulla and b=750s/mm2 in cortical ROIs. The relative LTE-STE difference was greatest at b=1000s/mm2 for both medulla (22±3%; p<10‑5) and cortex (15±5%; p<10‑4). This suggests that relatively high b-values (compared to most renal DTI studies) are required to capture microscopic anisotropy information in the kidneys, particularly in the cortex. Figure 3 shows a comparison of conventional FA and LTE-STE difference maps with increasing b-value on a single subject. Figure 4 demonstrates that the differences observed across ROIs, averaging across subjects (Figure 2A), can also be detected on a voxelwise scale. The corresponding microscopic anisotropy information can be captured by the µFA parameter (see Figure 4, obtained following the methods described previously7). The lower cortico-medullary differentiation (CMD) in the µFA map compared to the standard FA in Figure 4 (mostly due to higher µFA vs. standard FA in the cortex) suggests that orientation dispersion in the cortex plays a role in the CMD seen in standard DTI FA measures.Discussion
This work provides further evidence MD-dMRI methods are capable of probing microscopic anisotropy in the kidneys and provides important information on the lower bounds of the range of b-values required to map it. However, mapping µFA in the kidneys remains technically challenging and several limitations must be addressed in future research. First, the waveforms used here are not compensated with respect to concomitant fields which may cause a hyper-attenuation of the STE signal as recently reported13, yielding overestimation of the LTE-STE difference. The influence of flow effects on anisotropy measures has not been investigated in this work which would be required to disentangle fast pseudo-diffusion effects due to microscopic capillary/tubular flow from passive diffusion effects from which tissue microstructure properties can be interrogated. Furthermore, for clinical applications where scan time is limited, optimisation of parsimonious protocols is warranted.Conclusion
This work demonstrates technical feasibility of tensor-valued encoding for renal imaging and provides pilot data to demonstrate the minimum b-values required to capture microscopic fractional anisotropy information. It highlights current limitations, motivating further investigations of the microstructural information offered by multidimensional diffusion MRI for renal applications. This approach may ultimately enable a more specific in vivo characterisation of human kidneys in healthy and diseased subjects, compared to methods based on conventional diffusion encoding.Acknowledgements
This study was funded by Great Ormond Street Hospital Children's Charity (V0318) and supported by the National Institute for Health Research Biomedical Research Centre at Great Ormond Street Hospital for Children NHS Foundation Trust and University College London. DLT is supported by the UCL Leonard Wolfson Experimental Neurology Centre (PR/ylr/18575).References
1. Fan, W. et al. Assessment of renal allograft function early after transplantation with isotropic resolution diffusion tensor imaging. Eur. Radiol. 26, 567–575 (2016).
2. Sjölund, J. et al. Constrained optimization of gradient waveforms for generalized diffusion encoding. J. Magn. Reson. 261, 157–168 (2015).
3. Szczepankiewicz, F. et al. Quantification of microscopic diffusion anisotropy disentangles effects of orientation dispersion from microstructure: Applications in healthy volunteers and in brain tumors. Neuroimage 104, 241–252 (2015).
4. Cory, D. G., Garroway, A. N. & Miller, J. B. Applications of spin transport as a probe of local geometry. in American Chemical Society, Polymer Preprints, Division of Polymer Chemistry 31, 149–150 (1990).
5. Shemesh, N., Özarslan, E., Komlosh, M. E., Basser, P. J. & Cohen, Y. From single-pulsed field gradient to double-pulsed field gradient MR: Gleaning new microstructural information and developing new forms of contrast in MRI. NMR in Biomedicine 23, 757–780 (2010).
6. Jespersen, S. N., Lundell, H., Sønderby, C. K. & Dyrby, T. B. Orientationally invariant metrics of apparent compartment eccentricity from double pulsed field gradient diffusion experiments. NMR Biomed. 26, 1647–1662 (2013).
7. Lasič, S., Szczepankiewicz, F., Eriksson, S., Nilsson, M. & Topgaard, D. Microanisotropy imaging: quantification of microscopic diffusion anisotropy and orientational order parameter by diffusion MRI with magic-angle spinning of the q-vector. Front. Phys. 2, 1–14 (2014).
8. Nery, F. et al. Microscopic diffusion anisotropy imaging in the kidneys. in Proceedings of the ISMRM 26th Annual Meeting & Exhibition, Paris, France, 5232 (2018).
9. Westin, C. F. et al. Q-space trajectory imaging for multidimensional diffusion MRI of the human brain. Neuroimage 135, 345–362 (2016).
10. Klein, S., Staring, M., Murphy, K., Viergever, M. A. & Pluim, J. P. W. elastix: A Toolbox for Intensity-Based Medical Image Registration. IEEE Trans. Med. Imaging 29, 196–205 (2010).
11. Smith, S. M. et al. Advances in functional and structural MR image analysis and implementation as FSL. in NeuroImage (2004). doi:10.1016/j.neuroimage.2004.07.051
12. Nilsson, M. et al. An open-source framework for analysis of multidimensional diffusion MRI data implemented in MATLAB. in Proceedings of the ISMRM 26th Annual Meeting & Exhibition, Paris, France, 5355 (2018).
13. Szczepankiewicz, F. & Nilsson, M. Maxwell-compensated waveform design for asymmetric diffusion encoding. in Proceedings of the ISMRM 26th Annual Meeting & Exhibition, Paris, France, 207 (2018).
Figures