3522
A novel Multishell Acquisition with Increased b-Shells and Sparse ORientations (MAISSOR)1Physics, University of Florida, Gainesville, FL, United States, 2Biochemistry and Molecular Biology, University of Florida, Gainesville, FL, United States
Synopsis
With improvements in MRI technology, more informative diffusion acquisitions can be obtained to improve tissue microstructure analysis. In this study, a Multi-shell Acquisition with Increased b-Shells and Sparse ORientations (MAISSOR) is proposed to optimize diffusion acquisition. The scheme improves diffusion signal decay fitting while simultaneously improving fiber orientation distribution1 (FOD) calculations as well as diffusivity metrics, such as those derived from diffusion tensor imaging2 (DTI).
Introduction
Complex directional, multi-shell diffusion acquisitions are feasible with advanced MRI technology. To fit scan time constraints, diffusion acquisitions must optimize the number of b-shells and directions per shell with the goal of keeping scan time the same, while optimizing the distribution of acquisitions across shells to improve accuracy in microstructure analysis, as well as improve signal decay fitting in the high-b regime. To optimize acquisition, a Multishell Acquisition with Increased b-Shells and Sparse ORientations (MAISSOR) was developed and tested against common acquisition schemes.Methods
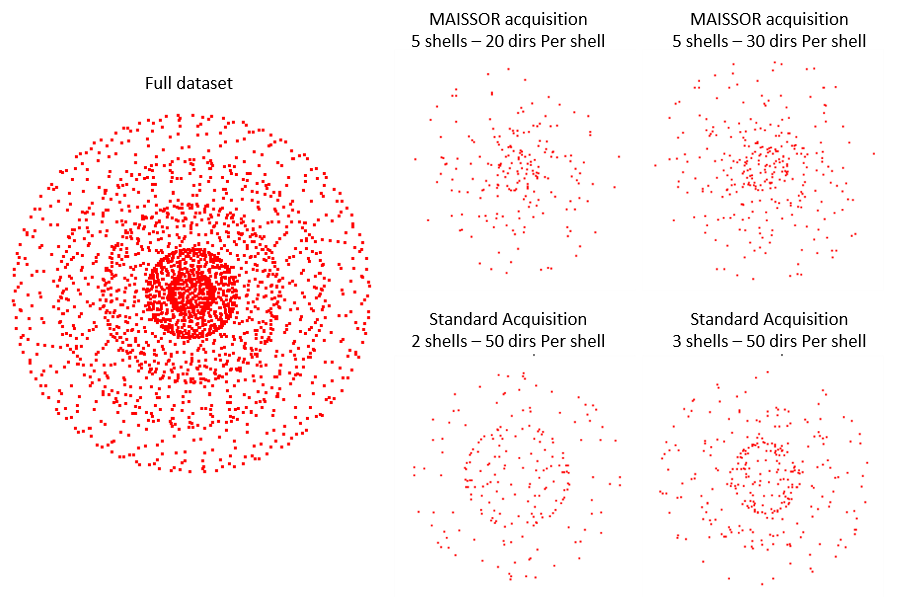
The MAISSOR scheme was applied to the MASSIVE dataset3. The MASSIVE dataset was acquired with a single healthy female scanned on a clinical 3T Philips Achieva using an eight-channel head coil. The diffusion weighted images (DWI) were acquired with an isotropic resolution of 2.5 mm3, and of 51.6/32.8ms, and a TE/TR time of 100/7000ms. Diffusion weighting in 5 b-shells with b-values of 500, 1000, 2000, 3000, and 4000, and consisted of 125, 250, 250, 250, and 300 gradient orientations per shell respectively. The data set was corrected for eddy-current induced distortions and subject movements4. The full data set was used to calculate the “ground truth” for all subsequent comparisons. For this study, 4 different MASSIVE data sub-sets were created; 1) 2 of the subsets represent common acquisition protocols using 2 and 3 b-shells with 50 directions per shell, 2) 2 of the subsets used a modified MAISSOR acquisition with 20 and 30 directions per shell and used all 5 of the MASSIVE b-shells. The number of directions in the MAISSOR scheme were chosen to fit the signal profile for each shell to a spherical harmonic expansion with maximum order 4 or 6. Number of directions for the standard acquisitions were chosen to mimic the total number of acquisitions as the MAISSOR approach. The gradient directions chosen provide a uniform coverage of gradient directions5, and all of the acquisitions are shown in Figure 1. Echo attenuations for the corresponding gradient strength and directions were extracted from the MASSIVE full dataset. DTI and constrained spherical deconvolution (CSD) were performed on the entire brain for each of the datasets. The FA values for each dataset was averaged over the entire white matter and compared to the ground truth. FODs were created using CSD and were compared using two methods. First, the FODs were decomposed into spherical harmonic coefficients, and compared to ground truth across acquisition protocols to determine inaccuracy in FOD estimates. The orientation accuracy of the FODs were also determined by comparing the orientation of the principle direction of the FODs to that of the ground truth. The signal decay curve must be fit accurately to determine the diffusion characteristics in a voxel. For both the MAISSOR and standard schemes, the signal profile for each b-shell was interpolated using spherical harmonic expansions up to order 4 or 6, which allows the signal decay to be determined in all directions for each b-shell. This interpolation was used to plot the signal decay curve in the principle direction of diffusion.Results and Discussion
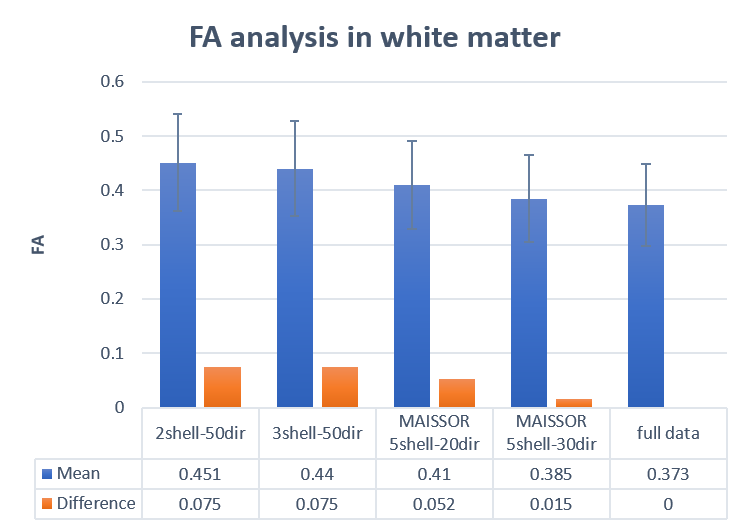
The DTI results are presented in
Figure 2 and show that FA calculations made using MAISSOR acquisitions were closer
to the ground truth than common acquisition schemes. The spherical harmonic coefficients of the
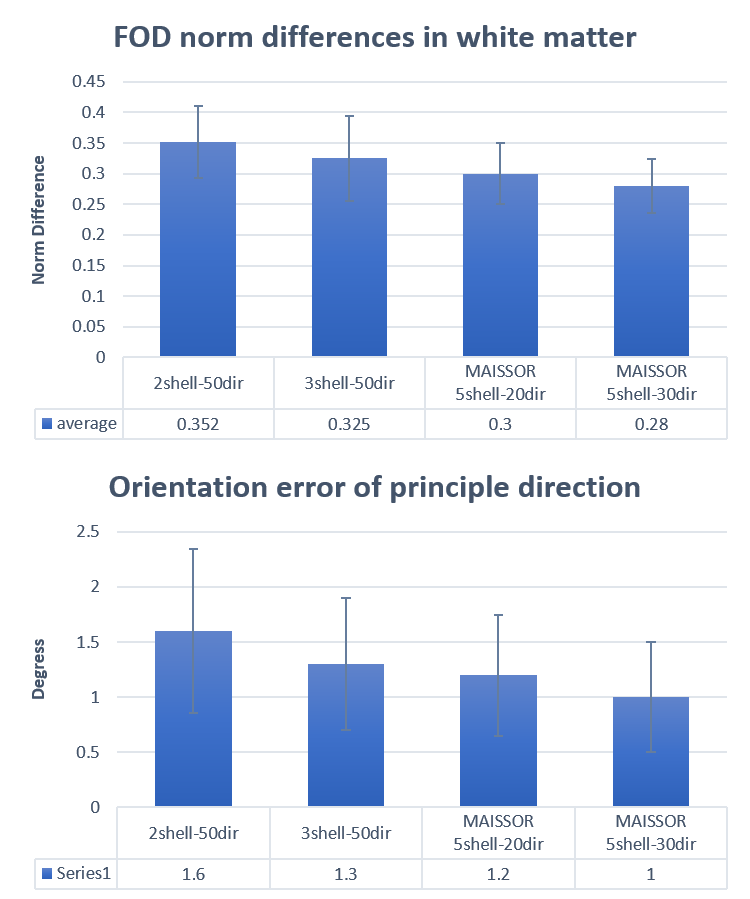
CSD FOD outputs were compared against the ground truth using the L2-norm across
the white matter, and these results are shown in Figure 3. The MAISSOR
acquisitions provided a more accurate FOD estimation, as well as greater
accuracy in the principle direction of diffusion, when compared to the standard
acquisitions.
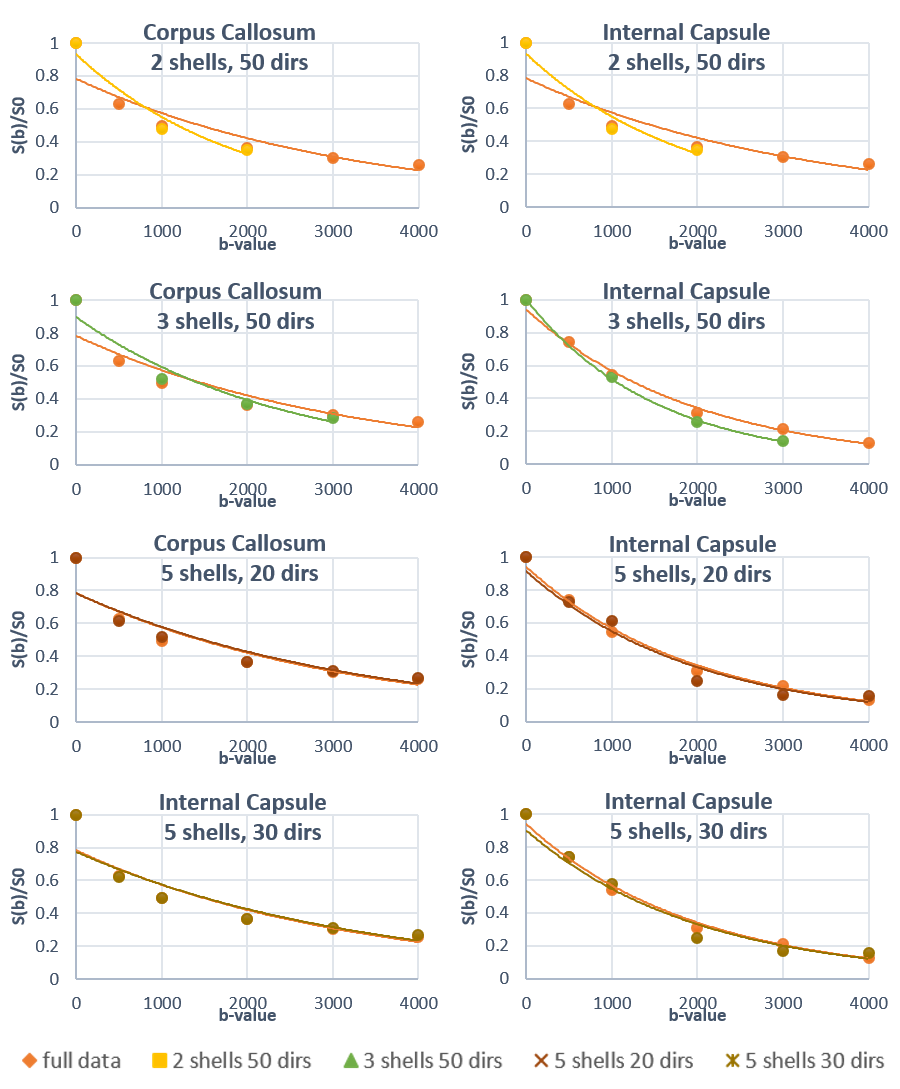
The signal decay vs. diffusion
weighting curves are shown in Figure 4. These results were plotted to show the
consistency between MAISSOR acquisitions to the ground truth when compared to
standard acquisitions. The data was fitted to a single mono-exponential decay
to show the advantages of increasing the number of b-shells. However, more
accurate models that fit the anomalous diffusion effects on signal decay would
provide much more insight into the voxel characteristics7.
The results indicate that that for a
given acquisition time, the MAISSOR acquisition performs better than common
HARDI acquisitions. However, the goal is not only to accurately model DTI and
CSD, but also to improve on the accuracy of other diffusion models that require
greater q-space coverage, such as radial diffusion spectrum imaging8. MAISSOR acquisition may be used to determine the proper
spacing of b-shells in the present of anomalous diffusion signal decay, as well
as number of gradient directions per shell to determine an optimized
acquisition for a given scan time.Acknowledgements
Supported by the National Institute of Nursing Research under Award Number R01NR013181, and by the National Institute of Neurological Disorders and Stroke of the National Institutes of Health under Award Number R01NS082386.References
1. Tournier, J.-D., Calamante, F., Gadian, D. G. & Connelly, A. Direct estimation of the fiber orientation density function from diffusion-weighted MRI data using spherical deconvolution. Neuroimage 23, 1176–1185 (2004).
2. Le Bihan, D. et al. Diffusion tensor imaging: concepts and applications. J. Magn. Reson. Imaging 13, 534–46 (2001).
3. Froeling, M., Tax, C. M. W., Vos, S. B., Luijten, P. R. & Leemans, A. “MASSIVE” brain dataset: Multiple acquisitions for standardization of structural imaging validation and evaluation. Magn. Reson. Med. 77, 1797–1809 (2017).
4. Andersson, J. L. R. & Sotiropoulos, S. N. An integrated approach to correction for off-resonance effects and subject movement in diffusion MR imaging. Neuroimage 125, 1063–1078 (2016).
5. Caruyer, E., Lenglet, C., Sapiro, G. & Deriche, R. Design of multishell sampling schemes with uniform coverage in diffusion MRI. Magn. Reson. Med. 69, 1534–1540 (2013).
6. Tuch, D. S. Q-ball imaging. Magn. Reson. Med. 52, 1358–1372 (2004).
7. Magin, R. L., Karaman, M. M., Hall, M. G., Zhu, W. & Zhou, X. J. Capturing complexity of the diffusion-weighted MR signal decay. Magn. Reson. Imaging (2018). doi:10.1016/J.MRI.2018.09.034
8. Baete, S. H., Yutzy, S. & Boada, F. E. Radial q-space sampling for DSI. Magn. Reson. Med. 76, 769–780 (2016).
Figures