3518
Feasibility of 129Xe MRI Morphometry Measurements with Acceleration Factors of 7 and 101Robarts Research Institute, London, ON, Canada, 2Department of Medical Biophysics, Western University, London, ON, Canada, 3Division of Respirology, Department of Medicine, Western University, London, ON, Canada
Synopsis
Hyperpolarized gas pulmonary MRI provides physiologically relevant biomarkers of obstructive lung disease including emphysema, bronchopulmonary dysplasia, congenital lobar emphysema and alpha-1 antitrypsin deficiency. Recently, a stretched-exponential-model combined with under-sampling in the imaging and diffusion direction was used for the generation of 3He static-ventilation, T2* and multiple b-value diffusion-weighted MRI-based ADC/morphometry maps. We hypothesize that the 3He method can be modified to provide whole lung 129Xe MRI-based emphysema biomarkers including static-ventilation, T2*/ADC/morphometry maps with high-spatial-image-resolution in a single breath-hold. Therefore, in this proof-of-concept evaluation, our objective was to demonstrate a feasibility of this approach in a small group of patients.
Purpose:
Hyperpolarized gas pulmonary MRI1,2 provides physiologically relevant biomarkers of obstructive lung disease including emphysema, bronchopulmonary dysplasia, congenital lobar emphysema and alpha-1 antitrypsin deficiency (AATD).3-5 Recently, a stretched-exponential-model6 combined with under-sampling in the imaging and diffusion direction7 was used for the generation of 3He static-ventilation, T2* and multiple b-value diffusion-weighted MRI-based ADC and morphometry maps.8 The major advantage of this method is the possibility of significantly speeding up data acquisition using acceleration factors (AF) between 78 and 10.7 Due to the increasing scarcity and cost of 3He, it is necessary to decrease the number of 3He doses or move towards the use of 129Xe.1,3,4 However, the low gamma of 129Xe and the typical gradient strengths (5G/cm) dictate that rapid acquisition strategies be developed to facilitate clinical uptake of 129Xe diffusion-weighted imaging. We hypothesize that the 3He method7,8 can be modified to provide whole lung 129Xe MRI-based emphysema biomarkers including static-ventilation, T2*,9,10 ADC and morphometry maps with high-spatial-image-resolution. Therefore, in this proof-of-concept evaluation, our objective was to demonstrate a feasibility of this approach in a small group of patients.Methods:
Two healthy volunteers (HV, 24/26yr) and two AATD
(60/65yr) patients
provided written informed consent to an ethics-board approved study protocol
and underwent spirometry, plethysmography, and 129Xe
MRI morphometry with and without acceleration. Imaging was performed at 3.0T (MR750, GEHC, WI) using
whole-body gradients (5G/cm maximum) and a commercial, xenon quadrature flex human
RF coil11 (MR Solutions, USA). For xenon measurements
the diffusion-sensitization gradient pulse ramp
up/down time=500μs, constant time=2ms, ΔXe=5.2ms, providing five
b-values 0, 12.0, 20.0, 30.0, and 45.5s/cm2. For fully-sampled
acquisition (single breath-hold), multi-slice interleaved (six interleaves)
centric 2D FGRE diffusion-weighted sequence (Figure 1A) was acquired for two 30mm
coronal slices (TE=10msec,
TR=13msec, reconstructed matrix size=128x128, and FOV=40x40cm2,
constant-flip-angle=4o, 14sec single breath-hold). For an accelerated acquisition (AF=7 and AF=10) multi-slice interleaved (six
interleaves) centric 2D FGRE diffusion-weighted sequence (Figure 1A) was
acquired, under-sampled in the imaging and diffusion direction as shown in
Figure 1C for seven 30mm coronal slices (sequence parameters were similar to fully-sampled). An extra interleave
with no diffusion-weighting (b=0) and significantly reduced TE (2ms) was utilized
to generate a short-TE static-ventilation-image (Figure 1B) and T2* map (by using
a long-TE (10ms) static-ventilation-image (b=0)) for both accelerated and fully-sampled cases. A 7.4o constant-flip-angle
(120 [20 per b-value] RF pulses-per-slice) was used for the AF=7 (all
participants, 12sec single breath-hold).
A 10.3o constant-flip-angle (60 [10 per b-value] RF pulses-per-slice)
was used for the AF=10 (HV-1 only, 7sec single breath-hold).
The ADC (b=0/b=12s/cm2)
and morphometry maps (specific to acinar duct mean-diffusion-length ((LmD)6,12), mean-linear-intercept (Lm)8,13,14) were generated as previously described.3,6,8,13-16Results:
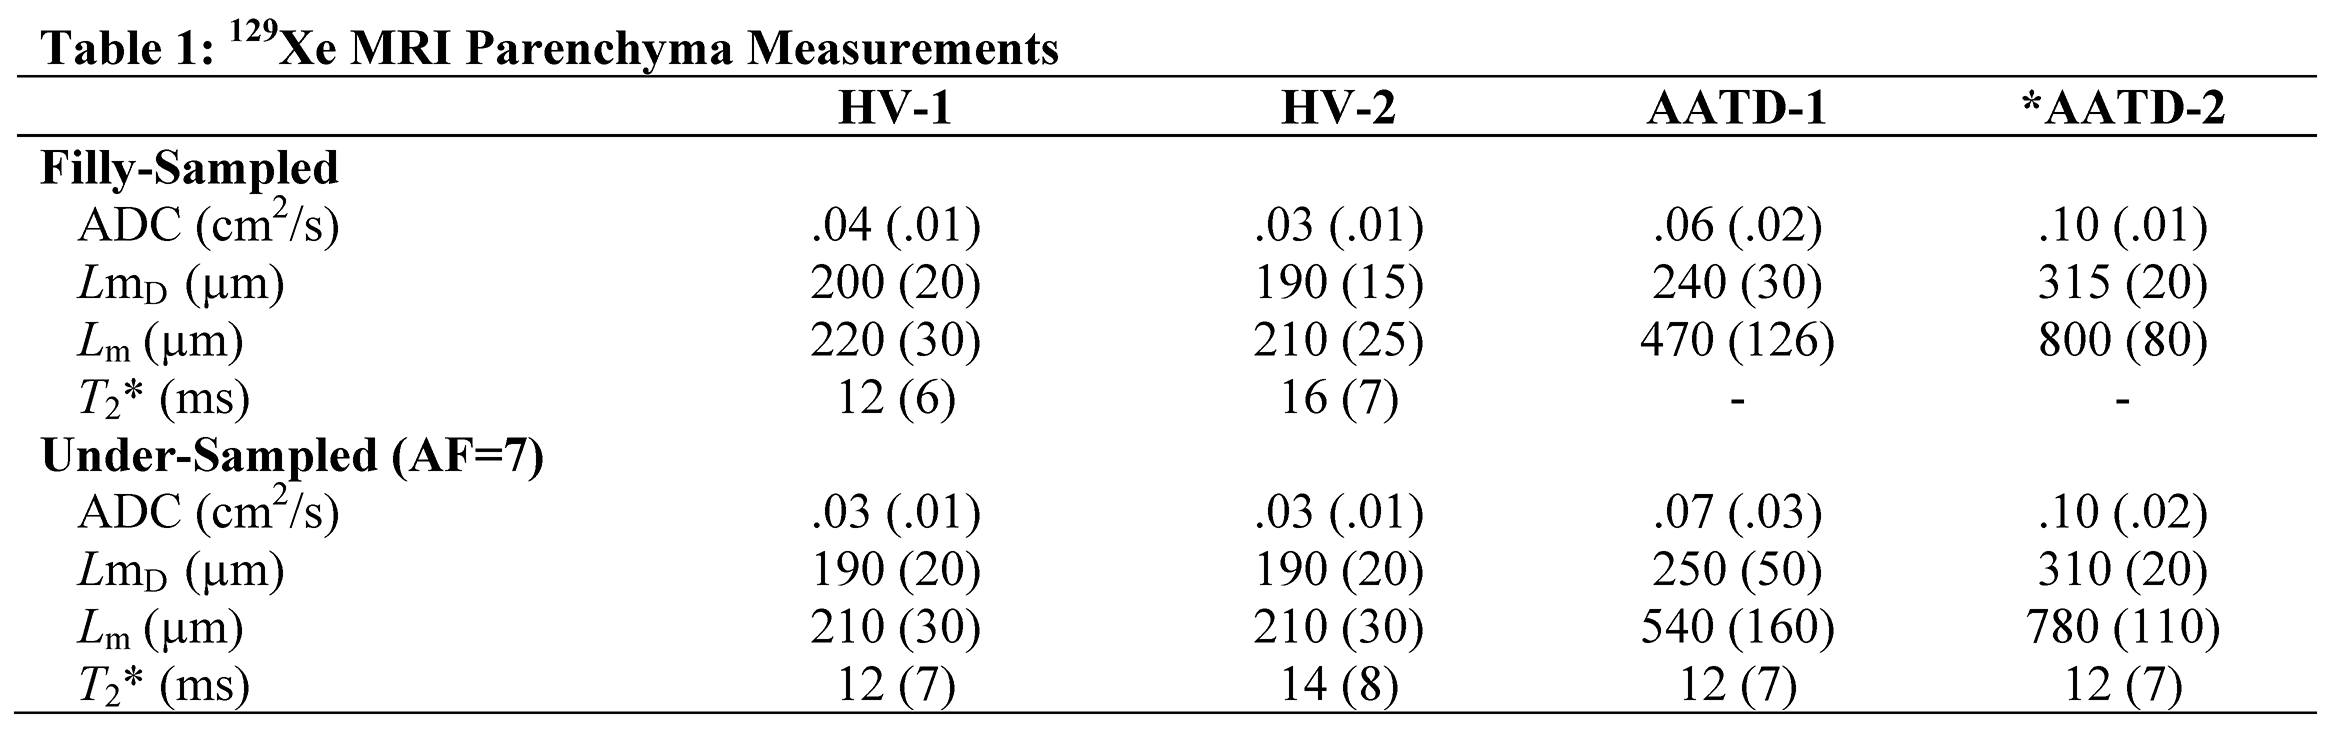
Figure 2 and 3 show representative centre slice ADC/ADCA, LmD/LmDA, Lm/LmA and T2*/AT2* (where Aindicates under-sampled) maps for all subjects while Table 1 shows mean estimates. For the HV subgroup, mean differences of 7.0%, 1.0%, 2.5% and 4.0% were observed between fully-sampled and under-sampled (AF=1/AF=7) k-space for the ADC, LmD, Lm and T2* values, respectively. For the AATD subgroup, mean differences of 3.8%, 2.0% and 3.8% were observed between fully-sampled and under-sampled (AF=1/AF=7) k-space for the ADC, LmD and Lm values, respectively. Mean ADCA/LmDA/LmA estimates were not significantly different from corresponding mean ADC/LmD/Lm estimates (p>.96; for all). Figure 4 shows representative centre slice ADC, LmD, Lm and T2* maps for the HV-1 reconstructed from the under-sampled with AF=7 and AF=10 k-space. For this subject, mean differences of 12.0%, 4.7%, 2.5% and 12.0% were observed between AF=7 and AF=10 for the ADC, LmD, Lm and T2* values, respectively.Discussion and Conclusion:
In this proof-of-concept study we showed that differences in 129Xe MRI-based ADC, LmD and Lm estimates from fully-sampled and under-sampled (AF=7) k-space were similar to those observed with accelerated 129Xe multi-b diffusion-weighted MRI.12 Thus, ADC and morphometry estimates obtained at AF=7 can be considered for use in patients. 129Xe MRI T2* values have previously been measured in young-healthy volunteers on 3T Philips (18±6ms) MRI systems.10 Our mean T2* values were in the same range (12-16ms), and therefore, the free induction decay estimates we generated were likely physiological. To the best of our knowledge this is the first demonstration of 129Xe MRI morphometry measurements with AF=10. Figure 4 suggests that ADC, T2* and morphometry estimates were similar for AF=1/AF=7/AF=10 acquisitions. By utilizing AF=10, within a single 16sec breath-hold whole lung 129Xe MRI-based morphometry method can generate static-ventilation, T2*,9,10 ADC, LmD and Lm maps with the typical for 3He MRI spatial image resolution.8Acknowledgements
A. Ouriadov was funded in part by a fellowship from the Alpha-1 Foundation (USA).
Authors thank Abascal, et all for providing Matlab code for the image reconstraction.
References
1 Mugler, J. P., 3rd & Altes, T. A. Hyperpolarized 129Xe MRI of the human lung. J Magn Reson Imaging 37, 313-331, doi:10.1002/jmri.23844 (2013).
2 Driehuys, B. et al. Chronic obstructive pulmonary disease: safety and tolerability of hyperpolarized 129Xe MR imaging in healthy volunteers and patients. Radiology 262, 279-289, doi:10.1148/radiol.11102172 (2012).
3 Kirby, M. et al. Hyperpolarized 3He and 129Xe MR imaging in healthy volunteers and patients with chronic obstructive pulmonary disease. Radiology 265, 600-610, doi:10.1148/radiol.12120485 (2012). 4 Kaushik, S. S. et al. Diffusion-weighted hyperpolarized 129Xe MRI in healthy volunteers and subjects with chronic obstructive pulmonary disease. Magn Reson Med 65, 1154-1165, doi:10.1002/mrm.22697 (2011).
5 Kirby, M. et al. Hyperpolarized 3He and 129Xe magnetic resonance imaging apparent diffusion coefficients: physiological relevance in older never- and ex-smokers. Physiol Rep 2, doi:10.14814/phy2.12068 (2014).
6 Chan, H. F., Stewart, N. J., Parra-Robles, J., Collier, G. J. & Wild, J. M. Whole lung morphometry with 3D multiple b-value hyperpolarized gas MRI and compressed sensing. Magn Reson Med 77, 1916-1925, doi:10.1002/mrm.26279 (2017).
7 Abascal, J. F. P. J., Desco, M. & Parra-Robles, J. Incorporation of prior knowledge of the signal behavior into the reconstruction to accelerate the acquisition of MR diffusion data. ArXiv e-prints 1702 (2017). <http://adsabs.harvard.edu/abs/2017arXiv170202743A>.
8 Westcott, A., Guo, F., Parraga, G. & Ouriadov, A. Rapid Single-breath Hyperpolarized Noble Gas MRI Based Biomarkers of Airspace Enlargement. J Magn Reson Imaging, doi:10.1002/jmri.26574 (2018).
9 Parra-Robles, J., Dominguez Viqueira, W., Xu, X., Ouriadov, A. & Santyr, G. E. Theoretical prediction and experimental measurement of the field dependence of the apparent transverse relaxation of hyperpolarized noble gases in lungs. J Magn Reson 192, 85-91, doi:10.1016/j.jmr.2008.02.009 (2008).
10 Xu, X. et al. Hyperpolarized 129Xe gas lung MRI-SNR and T2* comparisons at 1.5 T and 3 T. Magn Reson Med 68, 1900-1904, doi:10.1002/mrm.24190 (2012).
11 Kaushik, S. S. et al. Single-breath clinical imaging of hyperpolarized (129)Xe in the airspaces, barrier, and red blood cells using an interleaved 3D radial 1-point Dixon acquisition. Magn Reson Med 75, 1434-1443, doi:10.1002/mrm.25675 (2016).
12 Chan, H. F., Stewart, N. J., Norquay, G., Collier, G. J. & Wild, J. M. 3D diffusion-weighted (129) Xe MRI for whole lung morphometry. Magn Reson Med 79, 2986-2995, doi:10.1002/mrm.26960 (2018). 13 Ouriadov, A., Lessard, E., Sheikh, K., Parraga, G. & Canadian Respiratory Research, N. Pulmonary MRI morphometry modeling of airspace enlargement in chronic obstructive pulmonary disease and alpha-1 antitrypsin deficiency. Magn Reson Med 79, 439-448, doi:10.1002/mrm.26642 (2018).
14 Yablonskiy, D. A. et al. Quantification of lung microstructure with hyperpolarized 3He diffusion MRI. J Appl Physiol (1985) 107, 1258-1265, doi:10.1152/japplphysiol.00386.2009 (2009).
15 Sukstanskii, A. L. & Yablonskiy, D. A. Lung morphometry with hyperpolarized 129Xe: theoretical background. Magn Reson Med 67, 856-866, doi:10.1002/mrm.23056 (2012).
16 Ouriadov, A. et al. Pulmonary hyperpolarized (129) Xe morphometry for mapping xenon gas concentrations and alveolar oxygen partial pressure: Proof-of-concept demonstration in healthy and COPD subjects. Magn Reson Med 74, 1726-1732, doi:10.1002/mrm.25550 (2015).
Figures
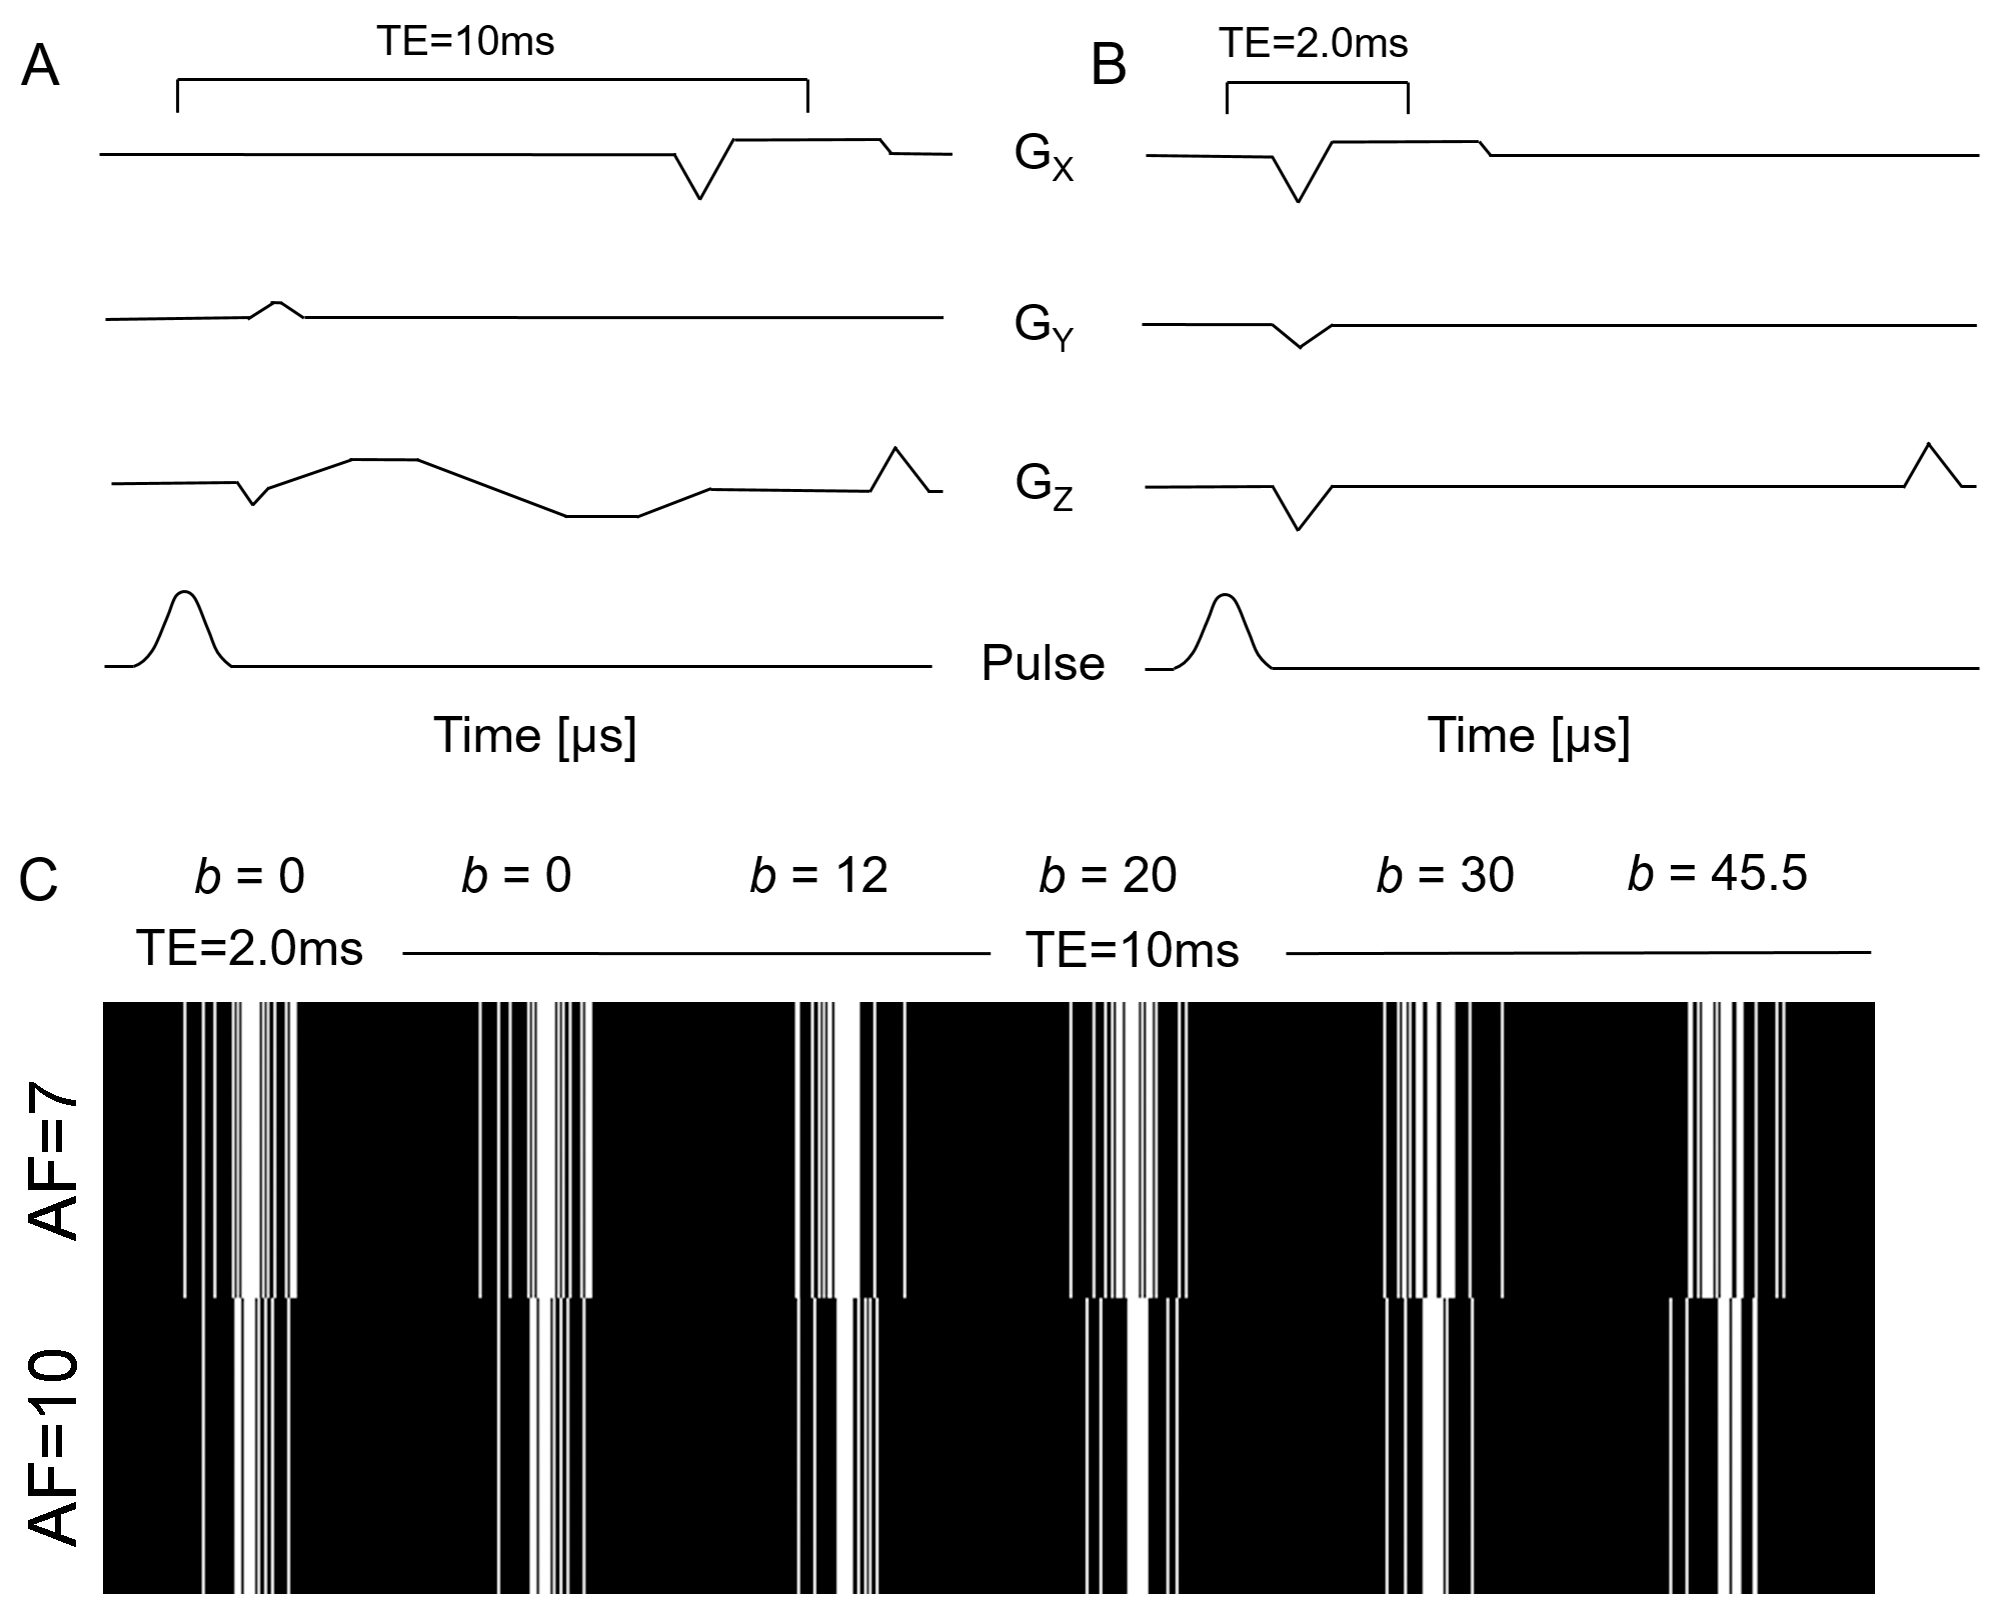
Figure 1. 129Xe MRI Pulse Sequence Schematic, Sparsity Pattern for AF=7 and 10
A) Diffusion-Weighted, Multi-Slice 2D Fast-Gradient-Recall-Echo (FGRE) pulse sequence with diffusion-sensitizing along z-direction. Δ=5.2ms, TE=10ms. Five interleaves, starting at the maximum b-value (45.5s/cm2) ensures multiple b-value approach; B) An extra interleave with no diffusion-weighting (b=0) and significantly reduced TE (2ms) utilized to generate a short TE static-ventilation-image and T2* map by using a long TE static ventilation image (b=0) from A); C) k-space under-sampling scheme, ensuring a variety of sparsity patterns for each b-value (AF=7 top panel and AF=10 bottom panel) employed in diffusion direction.
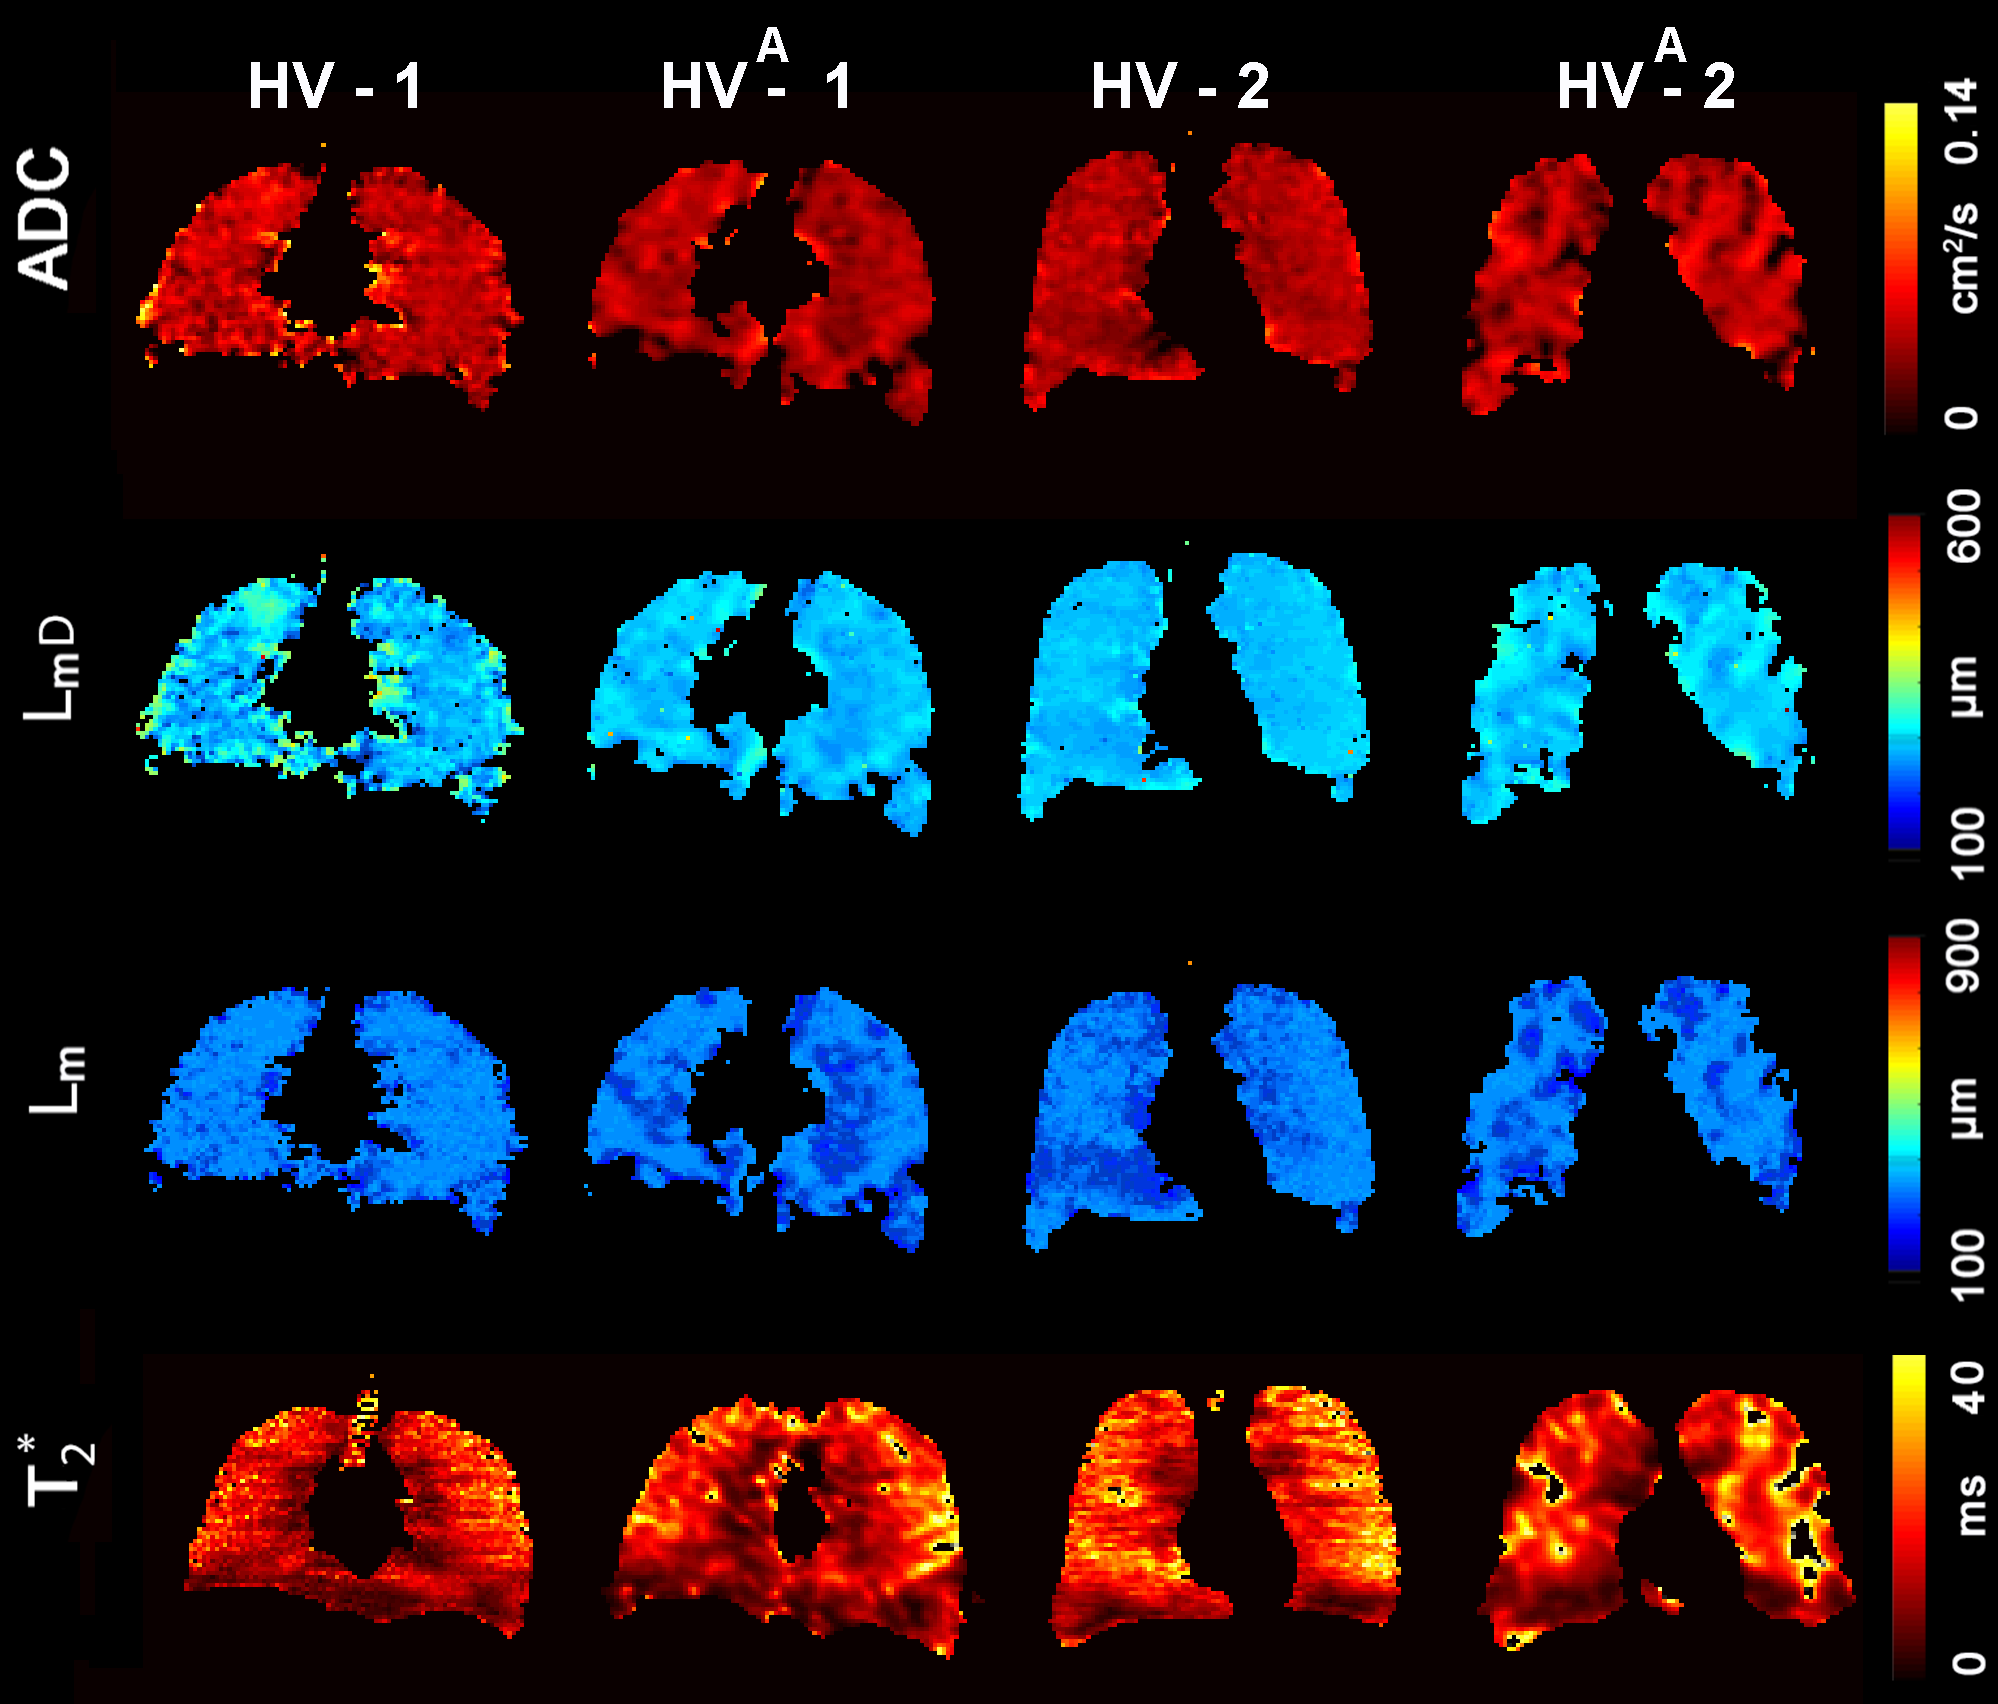
Figure 2. Representative 129Xe MRI maps obtained for the healthy volunteers with and without acceleration. T2*= free induction decay time constant; ADC = apparent diffusion coefficient; LmD = specific to acinar duct mean diffusion length; Lm = mean linear intercept estimate; HV = young healthy volunteer; Aindicates under-sampling with the acceleration factor of 7.
HV-1: ADC/ADCA = .04cm2s-1/.03cm2s-1, LmD/LmDA=200µm/190µm, Lm/LmA=220µm/210µm, T2*/AT2*=12ms/12ms.
HV-2: ADC/ADCA = .03cm2s-1/.03cm2s-1, LmD/LmDA=190µm/190µm, Lm/LmA=210µm/210µm, T2*/AT2*=16ms/14ms.
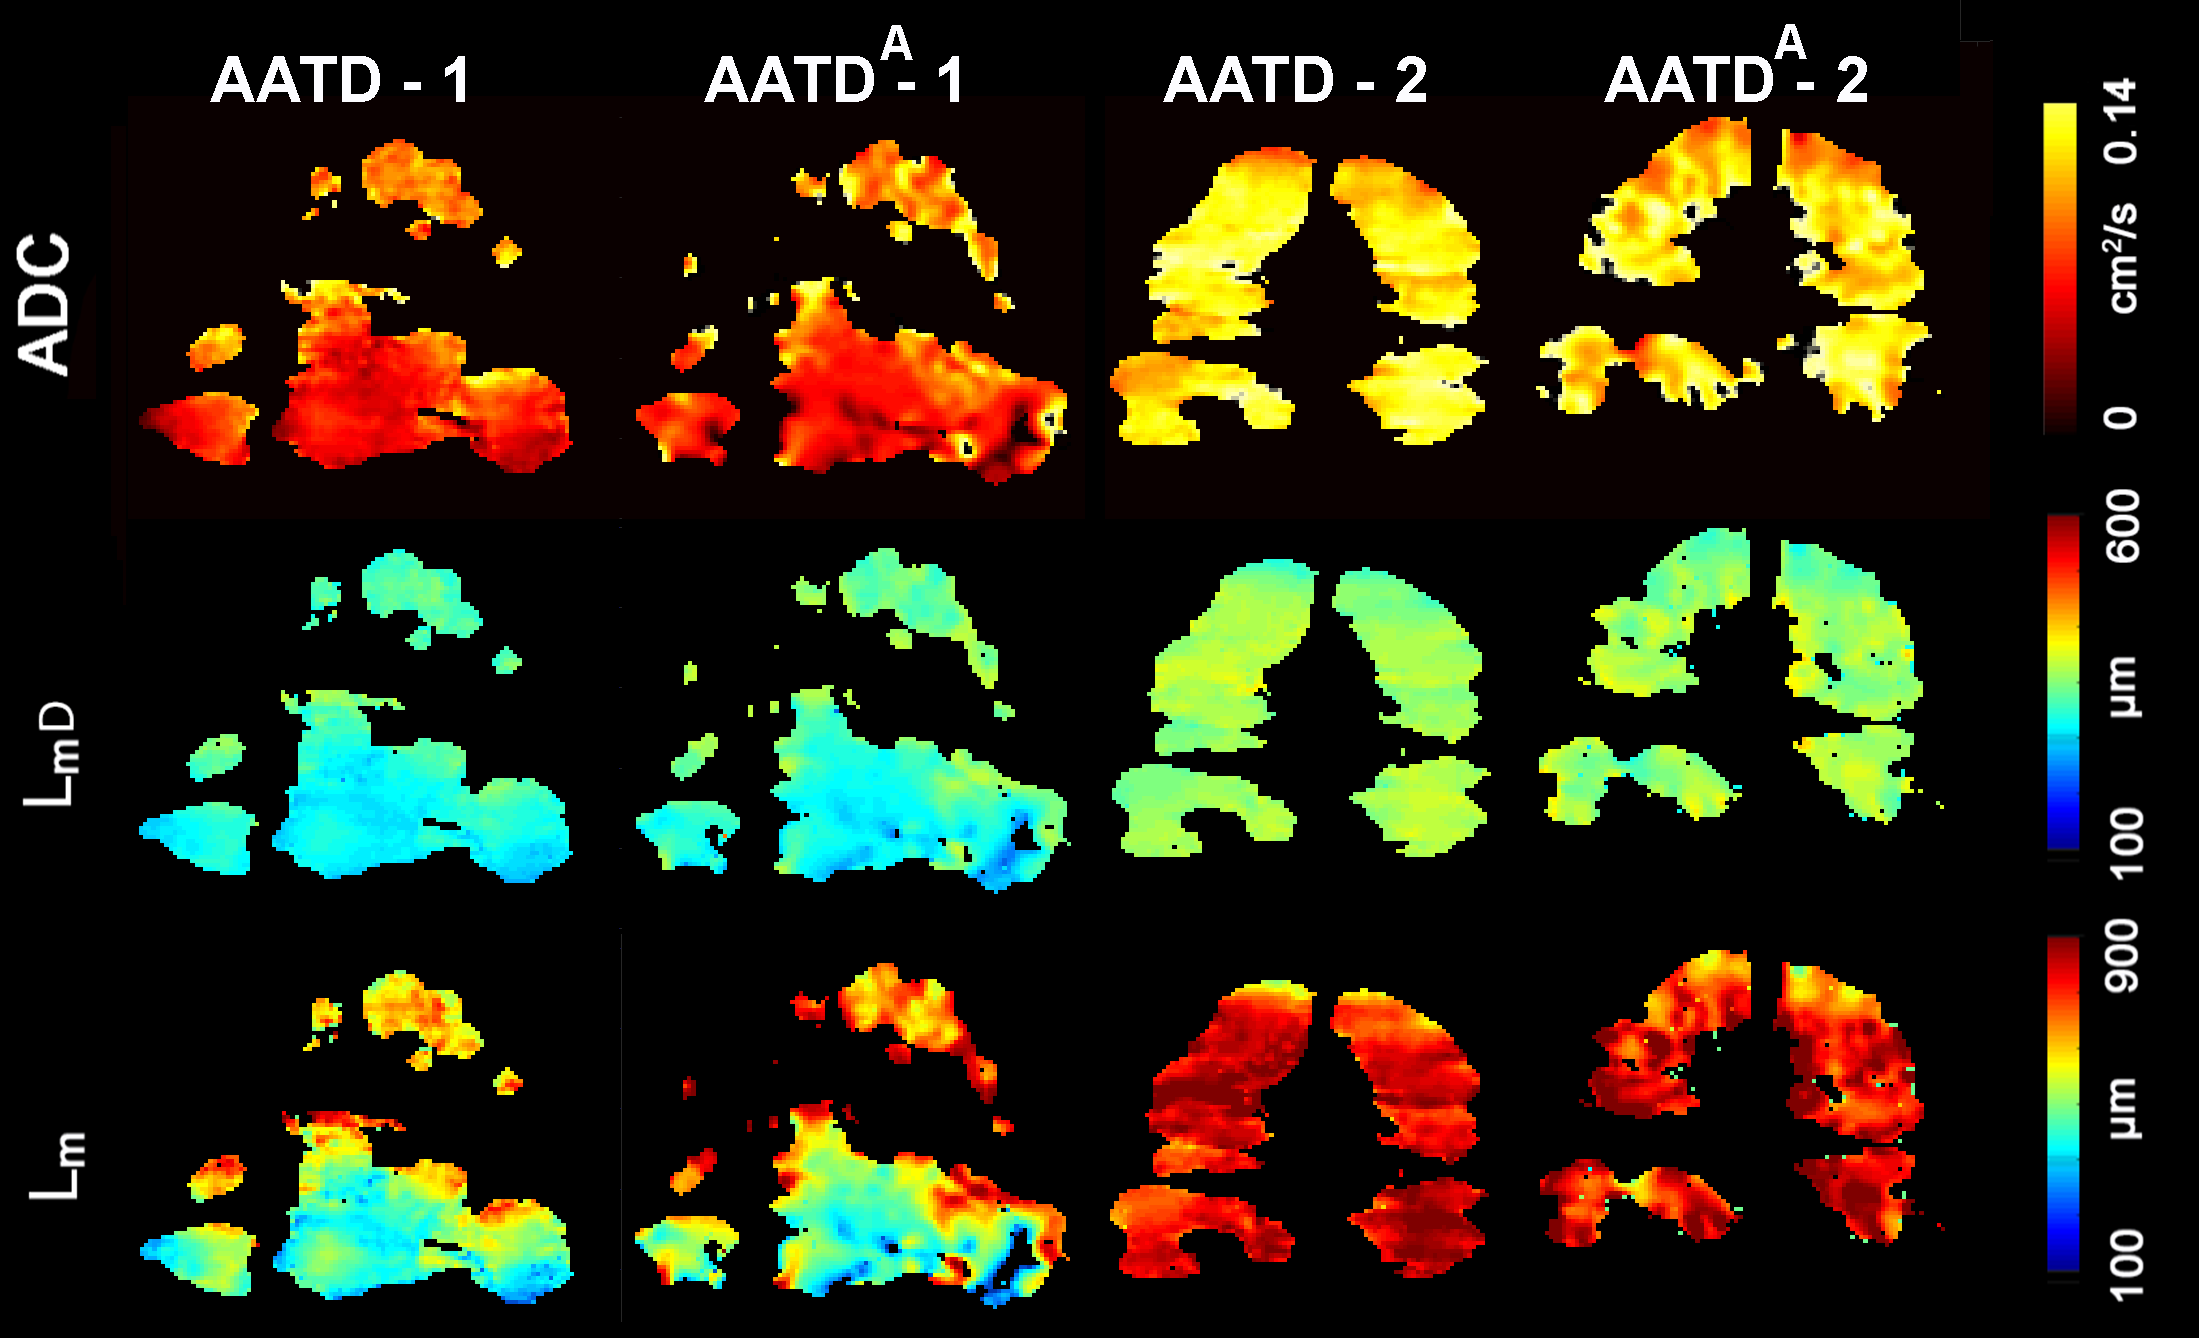
Figure 3. Representative 129Xe MRI maps obtained for the AATD with and without acceleration. ADC = apparent diffusion coefficient; LmD = specific to acinar duct mean diffusion length; Lm = mean linear intercept estimate; AATD=Alpha-one antitrypsin deficiency; AATD-2 = Ex-smoker AATD; Aindicates under-sampling with the acceleration factor of 7.
AATD -1: FEV1=24.4%pred, DLCO=50%pred, ADC/ADCA=.06cm2s-1/.07cm2s-1, LmD/LmDA=240µm/250µm, Lm/LmA=470µm/540µm.
AATD -2: FEV1=55%pred, DLCO=18%pred, ADC/ADCA = .10cm2s-1/.10cm2s-1, LmD/LmDA=315µm/310µm, Lm/LmA=800µm/780µm.
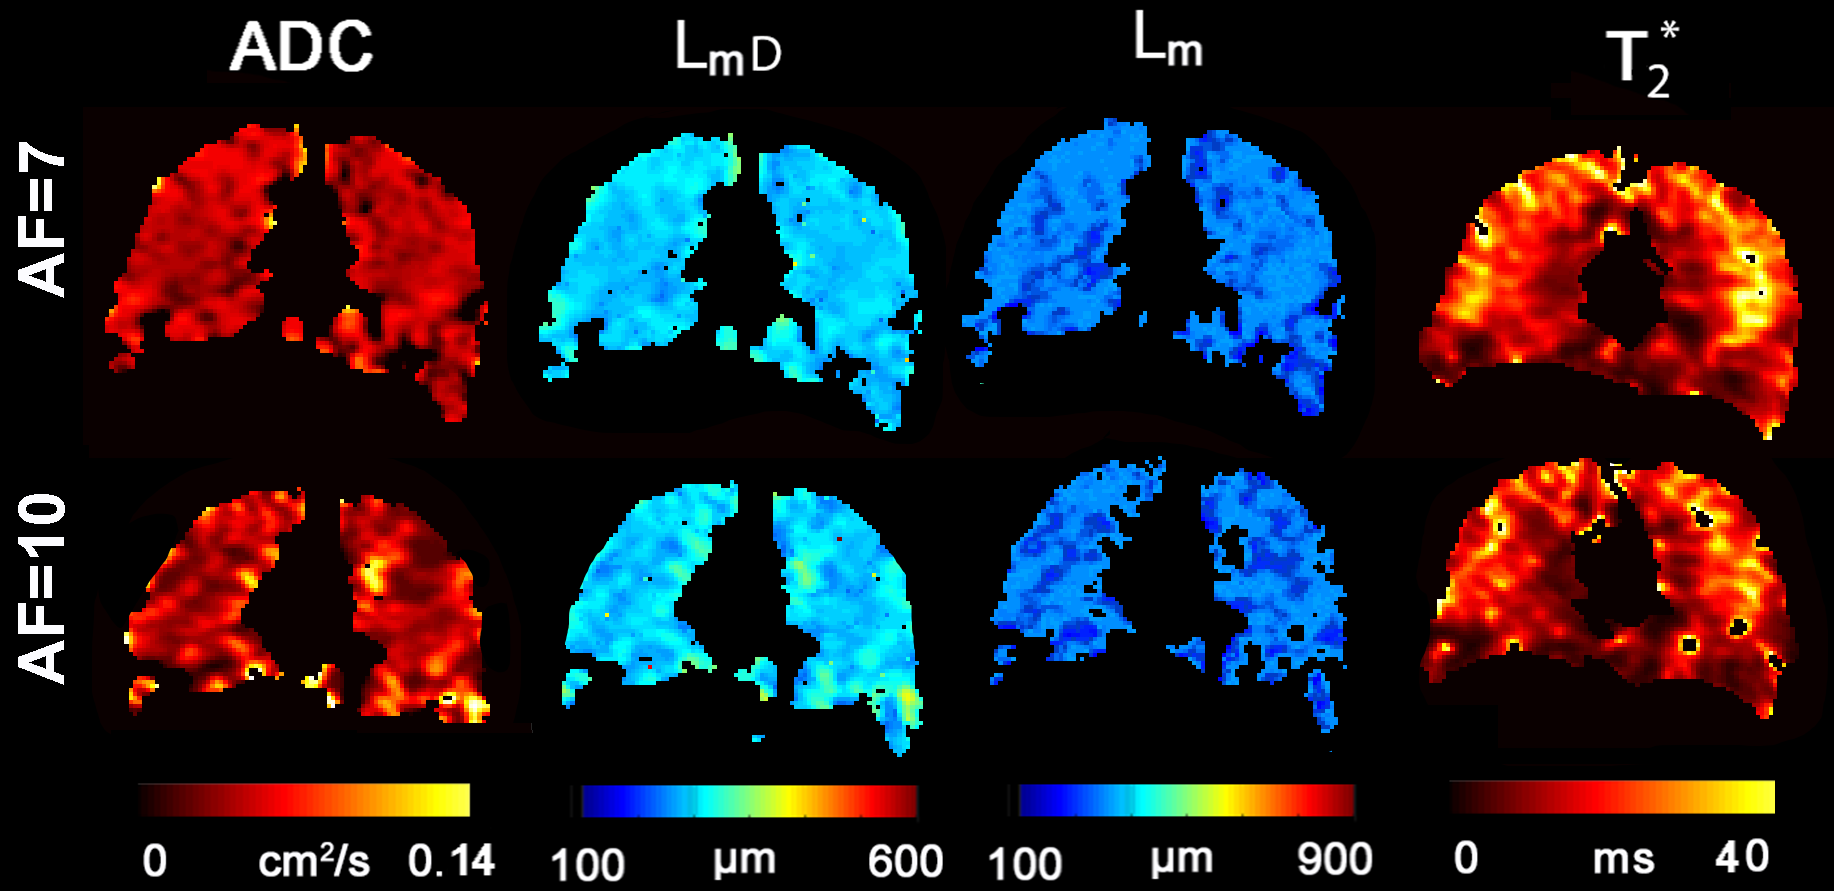
Figure 4. Representative 129Xe MRI maps obtained for a healthy volunteer with acceleration of 7 and 10. T2*= free induction decay time constant; ADC = apparent diffusion coefficient; LmD = specific to acinar duct mean-diffusion-length; Lm = mean-linear-intercept estimate; HV = young healthy volunteer; AF = Acceleration Factor.
#AF=1: ADC = .04cm2s-1, LmD = 200µm, Lm = 220µm, T2* = 12ms.
AF=7: ADC = .04cm2s-1, LmD = 190µm, Lm = 210µm, T2* = 14ms.
AF=10: ADC = .04cm2s-1, LmD = 200µm, Lm = 210µm, T2* = 14ms.
#indicates acceleration factor of 1 data (Figure 2) shown for a completeness only.