3507
Effects of Diffusion Gradient Waveforms on Time-dependent Kurtosis and Microstructural Properties1Biomedical Engineering, Zhejiang University, Hangzhou, China, 2Radiology, Johns Hopkins University School of Medicine, BALTIMORE, MD, United States, 3Radiology, New York University School of Medicine, New York, NY, United States
Synopsis
Diffusion-time (td) dependent diffusion MRI is a promising tool to probe tissue microstructure. Although different diffusion gradient waveforms (DGW) have been introduced to achieve short and long td’s, whether they have comparable sensitivity to microstructural changes remains to be investigated. Here, we examined the td-dependency of kurtosis measured using pulsed, bipolar, and oscillating gradients with different microstructural substrates. Simulations and in vivo experiments showed that the choice of DGW affects the characteristics of time-dependent kurtosis, and this effect varied with microstructural size and permeability. This knowledge is important for design of td-dependent diffusion MRI experiments.
Introduction
Recent progress on diffusion-time (td) dependent diffusion MRI [1-2] opened new avenues to probe specific microstructural properties, such as cell size, permeability, and axonal diameter [3-6]. In addition to td-dependency of diffusivity, kurtosis also shows td-dependent behaviors [7-11]. In order to examine the dependency over a large range of td’s (100-103 ms), several diffusion gradient waveforms (DGW) have been introduced, including oscillating gradients, pulsed gradients, STEAM, and their variants. Previously, Portnoy et al. [8] showed that, even at comparable td’s, considerable discrepancies remain between diffusivity and kurtosis measurements acquired using different DGWs. Here, we investigate the td-dependency of kurtosis using several common DGWs and its relationship with microstructural sizes and permeability, using simulation and in vivo experiments. We hypothesized that 1) the characteristics of td-dependent kurtosis change is influenced by DGW, and 2) the DGW-dependence is sensitive to changes in microstructures.Methods
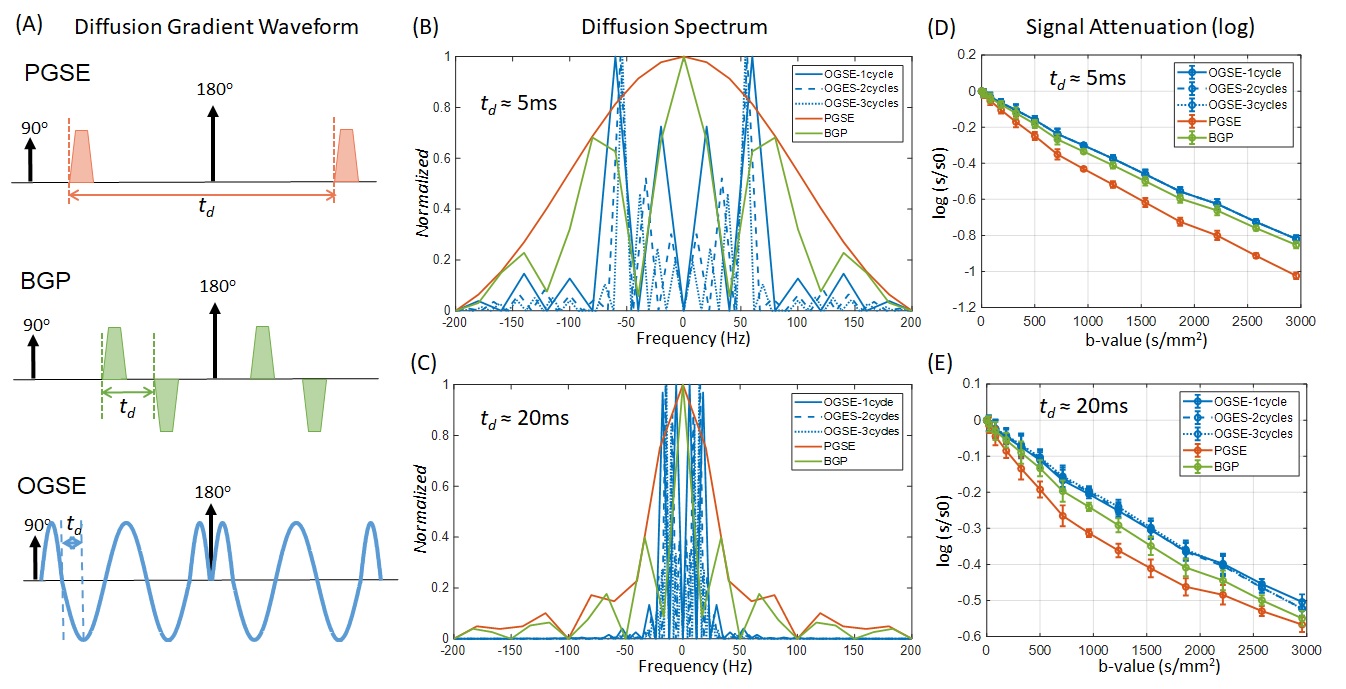
Monte Carlo simulations were performed using Camino (http://camino.cs.ucl.ac.uk) with regular grid cylinder substrates with radius of 1µm, 2.5µm, and 5µm, varying permeabilities (p=0.0025-0.01), and constant intra- and extra-cylinder space ratios (0.78). Pulsed gradient spin-echo (PGSE), bipolar pulsed (BGP) gradient [12], and oscillating gradient spin-echo (OGSE) [13] with different number of cycles were composed with td ranging from 4 to 50ms (Figure 1A). As the exact td of OGSE is hard to estimate, we used td=$$$\frac{1}{4f}$$$ according to [13], where f is the oscillating frequency. Gradients were applied perpendicular to the long-axis of the cylinders with 14 b-values between 0-3000s/mm2. Mean kurtosis were fitted from simulated signals, according to $$$\frac{S}{S_0}=a^{-bD+b^2D^2K/6}$$$.
In vivo experiments: These DGWs were implemented on an 11.7T Bruker scanner, and calibrated with a mineral oil phantom. Neonatal C57BL/6J mice were scanned at 48hrs after unilateral hypoxic-ischemic (HI) injury (n=5) or sham injury (n=6). Data were acquired with OGSE with f=50Hz (td≈5ms), BGP with td of 5, 7, 10ms, and PGSE with td of 7, 10ms, b-value of 1000, 1500, 2000s/mm2 and 30 directions, TE/TR=52/3000ms, in-plane resolution=0.2x0.2mm, and 10 slices with slice thickness of 0.8mm. In vivo data were fitted using the DKE toolbox ().
Results
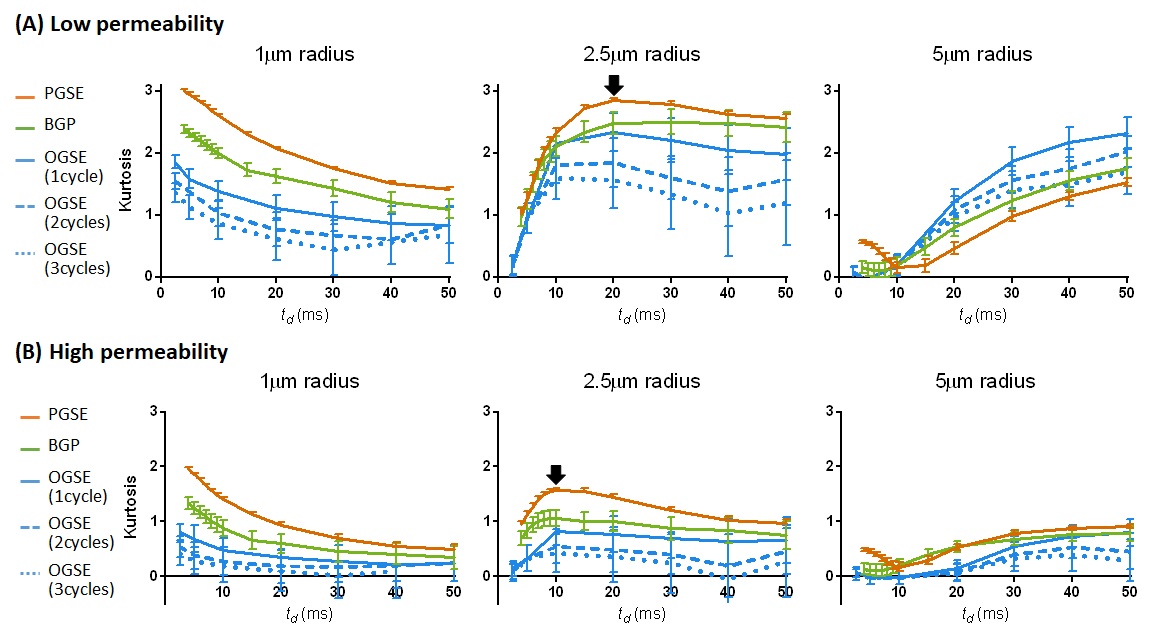
Figure 2 show the td–dependent kurtosis curves simulated with BGP, PGSE, and OGSE (1-3 cycles) for cylinders at radius of 1µm, 2.5µm, and 5µm and permeabilities of 0.0025 (low) and 0.01 (high).
1) td–dependence and microstructure: With td in the range of 4-50ms, kurtosis measured from 1µm cylinders monotonically decreased; kurtosis from 2.5µm cylinders showed a peak around 5-20ms; and kurtosis from 5µm cylinders monotonically increased, except for the PGSE data at td<10ms. Within the same range of td, kurtosis decreased as permeability increased in all cases, agreed with previous reports [7]. Noticeably, increasing permeability shifted the kurtosis peak from the 2.5 cylinders towards the direction of shorter td (black arrows).
2) DGW and td dependency: Choice of DGW does not alter the overall patterns of time-dependent kurtosis curves described above. Visually, the td-dependency of kurtosis was the strongest with PGSE encoding (most sensitive to change of td), compared to OGSE and BGP; and the sensitivity decreased as the number of cycles increased in OGSE, as suggested by a previous report [8].
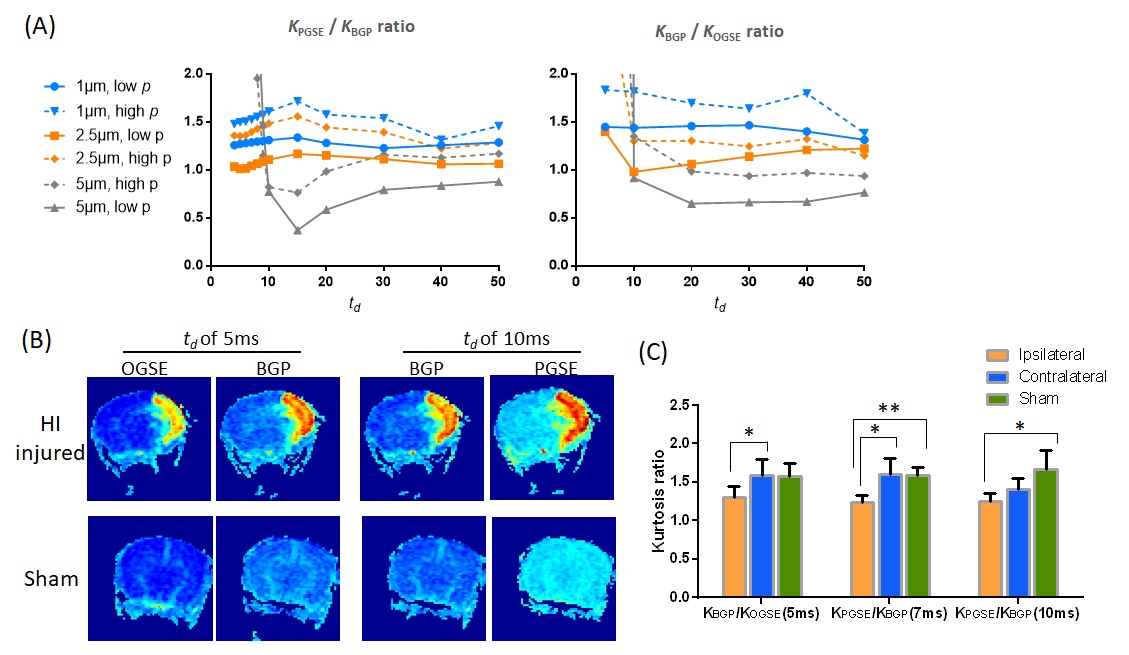
3) DGW and microstructure: We examined the DGW-dependency by comparing the kurtosis measured by PGSE and BGP (KPGSE / KBGP ratio) and BGP and OGSE (KBGP / KOGSE ratio). Figure 3A shows that a) the ratios decreased as cylinder radius increased from 1µm to 2.5µm, and b) the ratios increased as permeability increased in all cases.
In vivo data from the mouse brains agreed with the simulation results, e.g., at equivalent td’s, KPGSE >KBGP >KOGSE (Figure 3B). In the HI-injured mice, the ipsilateral cortex with severe edema showed lower KPGSE / KBGP and KBGP / KOGSE ratios, compared to the contralateral side or the shams (Figure 3C). The reduced ratios indicated increased microstructural size according to the simulation (Figure 3A), and agreed with swelling of cellular structures in edema.
Discussion
The differences between DGWs may relate to their spectra (Figure 1B-C), e.g., spectrum of PGSE mainly resides in the low frequencies, whereas BGP has both low and high frequency components, and OGSE lacks near zero frequency component, which is further accentuated with increasing oscillating cycles. As the td/frequency dependency of kurtosis shifts with structural size and permeability, we speculate that the pattern of td-dependent kurtosis curve reflects the underlying microstructural properties, and its sensitivity varied with different DGWs.Conclusion
In summary, we demonstrated significant differences in kurtosis measured with different DGWs, and that DGW affects the measurement of td-dependent diffusion. More importantly, effect of DGW is not fixed but associated with inherent microstructural properties, such as cell size and permeability, which may be utilized to explore tissue microstructural changes, as shown in HI-injury.Acknowledgements
This work is made possible by the following grant supports: NIH R01NS107417, R21NS098018, R01HD07459307, and NSFC 61801424.References
1. Stepisnik J. Time-Dependent Self-Diffusion by Nmr Spin-Echo. Physica B 1993;183(4):343-350.
2. Gore JC, Xu J, Colvin DC, Yankeelov TE, Parsons EC, Does MD. Characterization of tissue structure at varying length scales using temporal diffusion spectroscopy. NMR in biomedicine 2010;23(7):745-756.
3. Novikov DS, Jensen JH, Helpern JA, Fieremans E. Revealing mesoscopic structural universality with diffusion. Proceedings of the National Academy of Sciences of the United States of America 2014;111(14):5088-5093.
4. Reynaud O, Winters KV, Hoang DM, Wadghiri YZ, Novikov DS, Kim SG. Pulsed and oscillating gradient MRI for assessment of cell size and extracellular space (POMACE) in mouse gliomas. NMR in biomedicine 2016.
5. Xu J, Does MD, Gore JC. Dependence of temporal diffusion spectra on microstructural properties of biological tissues. Magnetic resonance imaging 2011;29(3):380-390.
6. Siow B, Drobnjak I, Chatterjee A, Lythgoe MF, Alexander DC. Estimation of pore size in a microstructure phantom using the optimised gradient waveform diffusion weighted NMR sequence. Journal of Magnetic Resonance 2012;214:51-60.
7. Fieremans E, Novikov DS, Jensen JH, Helpern JA. Monte Carlo study of a two-compartment exchange model of diffusion. NMR Biomed 2010;23(7):711-724.
8. Portnoy S, Flint JJ, Blackband SJ, Stanisz GJ. Oscillating and pulsed gradient diffusion magnetic resonance microscopy over an extended b-value range: implications for the characterization of tissue microstructure. Magnetic resonance in medicine 2013;69(4):1131-1145.
9. Pyatigorskaya N, Le Bihan D, Reynaud O, Ciobanu L. Relationship between the Diffusion Time and the Diffusion MRI Signal Observed at 17.2 Tesla in the Healthy Rat Brain Cortex. Magnetic resonance in medicine 2014;72(2):492-500.
10. Jespersen SN, Olesen JL, Hansen B, Shemesh N. Diffusion time dependence of microstructural parameters in fixed spinal cord. Medical Physics 2017;arXiv:1705.03630.
11. Wu D, Li Q, Northington FJ, Zhang JY. Oscillating gradient diffusion kurtosis imaging of normal and injured mouse brains. NMR Biomed 2018;31(6).
12. Alexander AL, Tsuruda JS, Parker DL. Elimination of eddy current artifacts in diffusion‐weighted echo‐planar images: The use of bipolar gradients. Magnetic resonance in medicine. 2006; 38: 1016-1021.
13. Parsons EC, Does MD, Gore JC. Temporal diffusion spectroscopy: Theory and implementation in restricted systems using oscillating gradients. Magnetic resonance in medicine 2006;55(1):75-84.
Figures