3505
3D distortion-free multi-slab diffusion-prepared magnitude-stabilized bSSFP imaging1Department of Radiological Sciences, University of California, Los Angeles, Los Angeles, CA, United States, 2Physics and Biology in Medicine IDP, University of California, Los Angeles, Los Angeles, CA, United States, 3Biomedical Engineering, Tsinghua University, Beijing, China, 4Department of Radiation Oncology, University of California, Los Angeles, Los Angeles, CA, United States
Synopsis
A 3D diffusion-prepared magnitude-stabilized bSSFP (DP-MS-bSSFP) sequence was proposed and validated to achieve
Introduction
Diffusion imaging has broad applications in neurology and oncology for stroke diagnosis and tumor detection. Multi-shot diffusion techniques have been extensively investigated in research to address the distortion and limited resolution problems associated with the conventional diffusion-weighted single-shot echo-planar imaging (DW-ssEPI)1-4. However, most of those techniques are 2D, hence suffers from low spatial resolution in the slice direction. 3D diffusion imaging has the potential of achieving higher SNR and higher resolution, which is beneficial to overcome partial volume effect, and provide more accurate tumor detection, delineation and fiber tracking information. bSSFP readout, in particular, is a promising 3D readout candidate due to its minimal distortion compared to EPI readout and less SAR concern compared with TSE readout. In this work, we extend a diffusion-prepared magnitude-stabilized bSSFP (DP-MS-bSSFP) sequence to 3D to achieve high resolution distortion-free diffusion imaging.Methods
Sequence: Sequence diagram of the proposed DP-MS-bSSFP sequence is shown in Figure 1. Stabilizer gradients were added before the 90˚ tip-up pulse and before and after the echo in each readout to convert the shot-to-shot k-space magnitude inconsistency to phase inconsistency. A 2D navigator, which is only phase-encoded to cover the central ky lines, was acquired during the 10 linear catalyzation pulses to correct the phase inconsistency between shots. Each kz plane is covered in 4 imaging shots.
Reconstruction: The 3D diffusion data was phase corrected per kz plane using the plane-by-plane MUSE technique5. For each kz plane, the 4 shots imaging data and associated navigator data were fed into the 2D MUSE reconstruction workflow. 1D Fourier transform along the z direction was applied after all kz planes were corrected.
In-vivo study: Four volunteers were recruited under the Institutional Review Board approval. Written consent form was obtained prior to each study. Imaging were performed at a 3T scanner (MAGNETOM Prisma, Siemens Healthineers, Erlangen, Germany). Single-slab trace and DTI scan was performed on three volunteers, and a 3-slab trace scan was performed on one volunteer. Below is the scanning protocol: TR/TE=2000/89ms, 8 slices in each slab with 2 slices of over-sampling, FOV=230x230mm2, resolution=1.4x1.4x2mm3, bandwidth=789Hz/px, b-value=0,500,800 in three orthogonal directions in the trace scan, and b-value=0,800 in 12 directions in the DTI scan. DW-ssEPI was acquired to serve as the ADC reference, and TSE was acquired as the geometric reference. Four regions of interests (ROIs) in the white matter region were drawn on each slice of the ADC map. Bland-Altman plot was used to evaluate the ADC agreement between DW-ssEPI and DP-MS-bSSFP. To quantify the geometric distortion, six to ten landmarks were selected for each volunteer on each slice, and the target registration error (TRE) of DW-ssEPI and DP-MS-bSSFP compared with the geometric reference was calculated.
Results and Discussion
The 3D data in x-y-kz and x-y-z plane before and after the phase correction were shown in Figure 2. Due to shot-to-shot k-space phase variations, strong ghosting artifacts were observed before the correction. Plane-by-plane MUSE correction effectively removed the artifacts and provided high-quality images with sharp details for all eight slices.
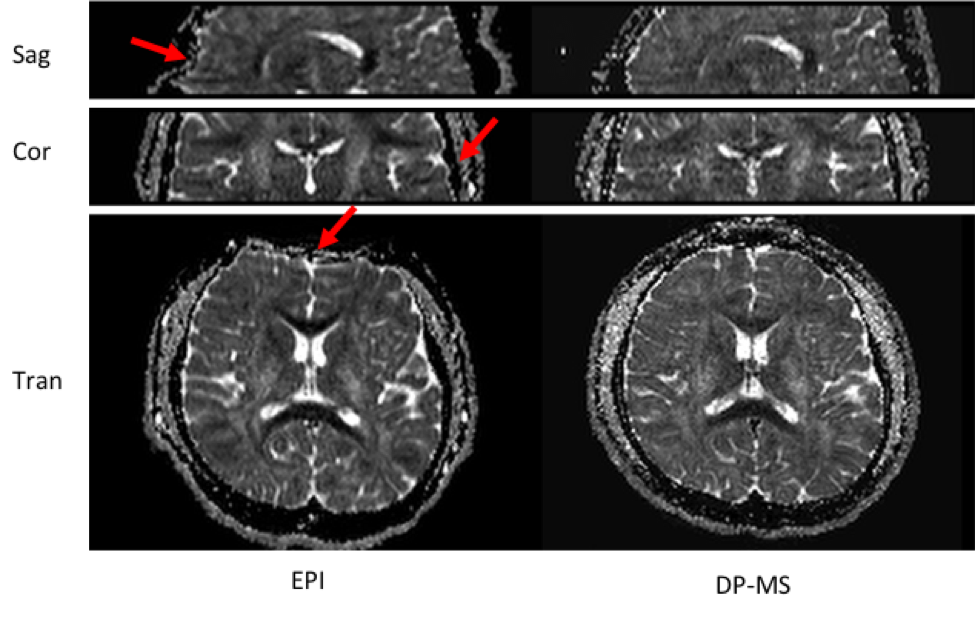
Figure 3 shows the comparison of diffusion images, ADC map, and cFA map between DW-ssEPI and DP-MS-bSSFP. As pointed by the red arrows, strong distortion and signal pile-up artifacts around the tissue air boundary were observed on the DW-ssEPI images. In comparison, the proposed DP-MS-bSSFP provided high-quality distortion-free diffusion images, ADC map and cFA map.
The 3-slab ADC maps from one volunteer were shown in Figure 4. As indicated by the red arrows, ADC map from DW-ssEPI suffers from distortion artifacts, whereas the distortion was minimal for DP-MS-bSSFP.
Figure 5(a) shows the Bland-Altman plot of mean diffusivity for selected ROIs on the white matter. Good agreement of ADC between DW-ssEPI and DP-MS-bSSFP was observed. P-value from the paired t-test was 0.51, indicating no significant difference between ADC from the two diffusion sequences. TRE measurements for the four volunteers were shown in Figure 5(b). It is obvious that the proposed DP-MS-bSSFP provided substantially improved geometric fidelity. The mean and maximum TRE was 2.09 ± 2.42 mm and 10.63 mm for DW-ssEPI, and 0.51 ± 0.48 mm and 1.98mm for DP-MS-bSSFP.
Conclusion
A 3D diffusion-prepared magnitude-stabilized bSSFP sequence was developed. The proposed sequence provided high-quality 3D diffusion images with minimal distortion and high ADC accuracy.Acknowledgements
No acknowledgement found.References
1. Butts K, Riederer SJ, Ehman RL, Thompson RM, Jack CR. Interleaved echo planar imaging on a standard MRI system. Magn Reson Med. 1994;31(1):67-72. doi:10.1002/mrm.1910310111 2
2. Pipe JG, Farthing VG, Forbes KP. Multishot diffusion-weighted FSE using PROPELLER MRI. Magn Reson Med. 2002;47(1):42-52.
3. Holdsworth SJ, Skare S, Newbould RD, Guzmann R, Blevins NH, Bammer R. Readout-segmented EPI for rapid high resolution diffusion imaging at 3T. Eur J Radiol. 2008;65(1):36-46. doi:10.1016/j.ejrad.2007.09.016
4. Porter DA, Heidemann RM. High resolution diffusion-weighted imaging using readout-segmented echo-planar imaging, parallel imaging and a two-dimensional navigator-based reacquisition. Magn Reson Med. 2009;62(2):468-475. doi:10.1002/mrm.22024
5. Chang H-C, Sundman M, Petit L, et al. Human brain diffusion tensor imaging at submillimeter isotropic resolution on a 3Tesla clinical MRI scanner. NeuroImage. 2015;118:667-675. doi:10.1016/j.neuroimage.2015.06.016
Figures