3497
In-vivo cardiac DTI: Comparison between Motion Compensated Optimized Diffusion Encoding (MODE) and Convex Optimized Diffusion Encoding (CODE) Techniques1Radiology, Ohio State University Wexner Medical Center, Columbus, OH, United States, 2Center for Biostatistics, Ohio State University Wexner Medical Center, Columbus, OH, United States
Synopsis
Diffusion-weighted imaging(DWI) is used to determine defective areas such as fibrosis in the myocardium without the need of contrast agent by calculating apparent diffusion coefficient(ADC) and fractional anisotropy(FA). However, DWI of heart is very challenging due to bulk motion to which diffusion encoding gradients are sensitive. Previous studies proposed CODE (convex optimized diffusion encoding) and MODE (Motion-compensated Optimized Diffusion Encoding). Aim of this study is to compare ADC and FA using MODE and CODE technique in healthy subjects. No significant difference was found between two techniques. However, for a given TE, MODE generated slightly higher b-value compared to CODE.
Background
Diffusion-weighted imaging (DWI) is an effective method to determine defective areas in the myocardium without the need of any contrast agent such as fibrosis, infarction, edema etc by calculating apparent diffusion constant (ADC) and fractional anisotropy (FA) maps [1,2,3]. Despite its clinical utility, DWI of the heart remains very challenging due to bulk motion of the heart, which the diffusion encoding gradients (DEGs) are very sensitive. Researchers proposed two different DWI imaging techniques (MRI pulse sequences) to obtain more accurate diffusion parameters: CODE (Convex Optimized Diffusion Encoding) method to optimize DEG waveforms, and Motion Compensated Optimized Diffusion Encoding (MODE) to achieve a higher b-value for a given DEG duration [4, 5] with minimum TE. The aim of this study is to compare the diffusion parameters such as ADC and FA using MODE (with a higher b-value) and CODE sequences in healthy subjects.Methods
All imaging was performed using a 3T MRI scanner (Prisma, Siemens Healthcare, Erlangen, Germany). Written informed consent was obtained from all volunteers (n=15; age range: 21-65 years). Mid left ventricular short-axis slice was captured using in-vivo MODE and Code sequences. A trigger delay (180-200 ms) was adjusted to capture the systolic phase. Imaging parameters are represented in Table I comparing MODE and CODE parameters. All diffusion directions i.e. b0 through b12 and all the averages were registered using MOCO (motion correction) from Siemens. Perona-malik [6] filter was applied to the registered data to reduce the noise. Eigen values were computed using single value decomposition in MATLAB. For statistical analysis, ANOVA was used to analyze the variation of ADC and FA resulting from two different sequences MODE and CODE.Results
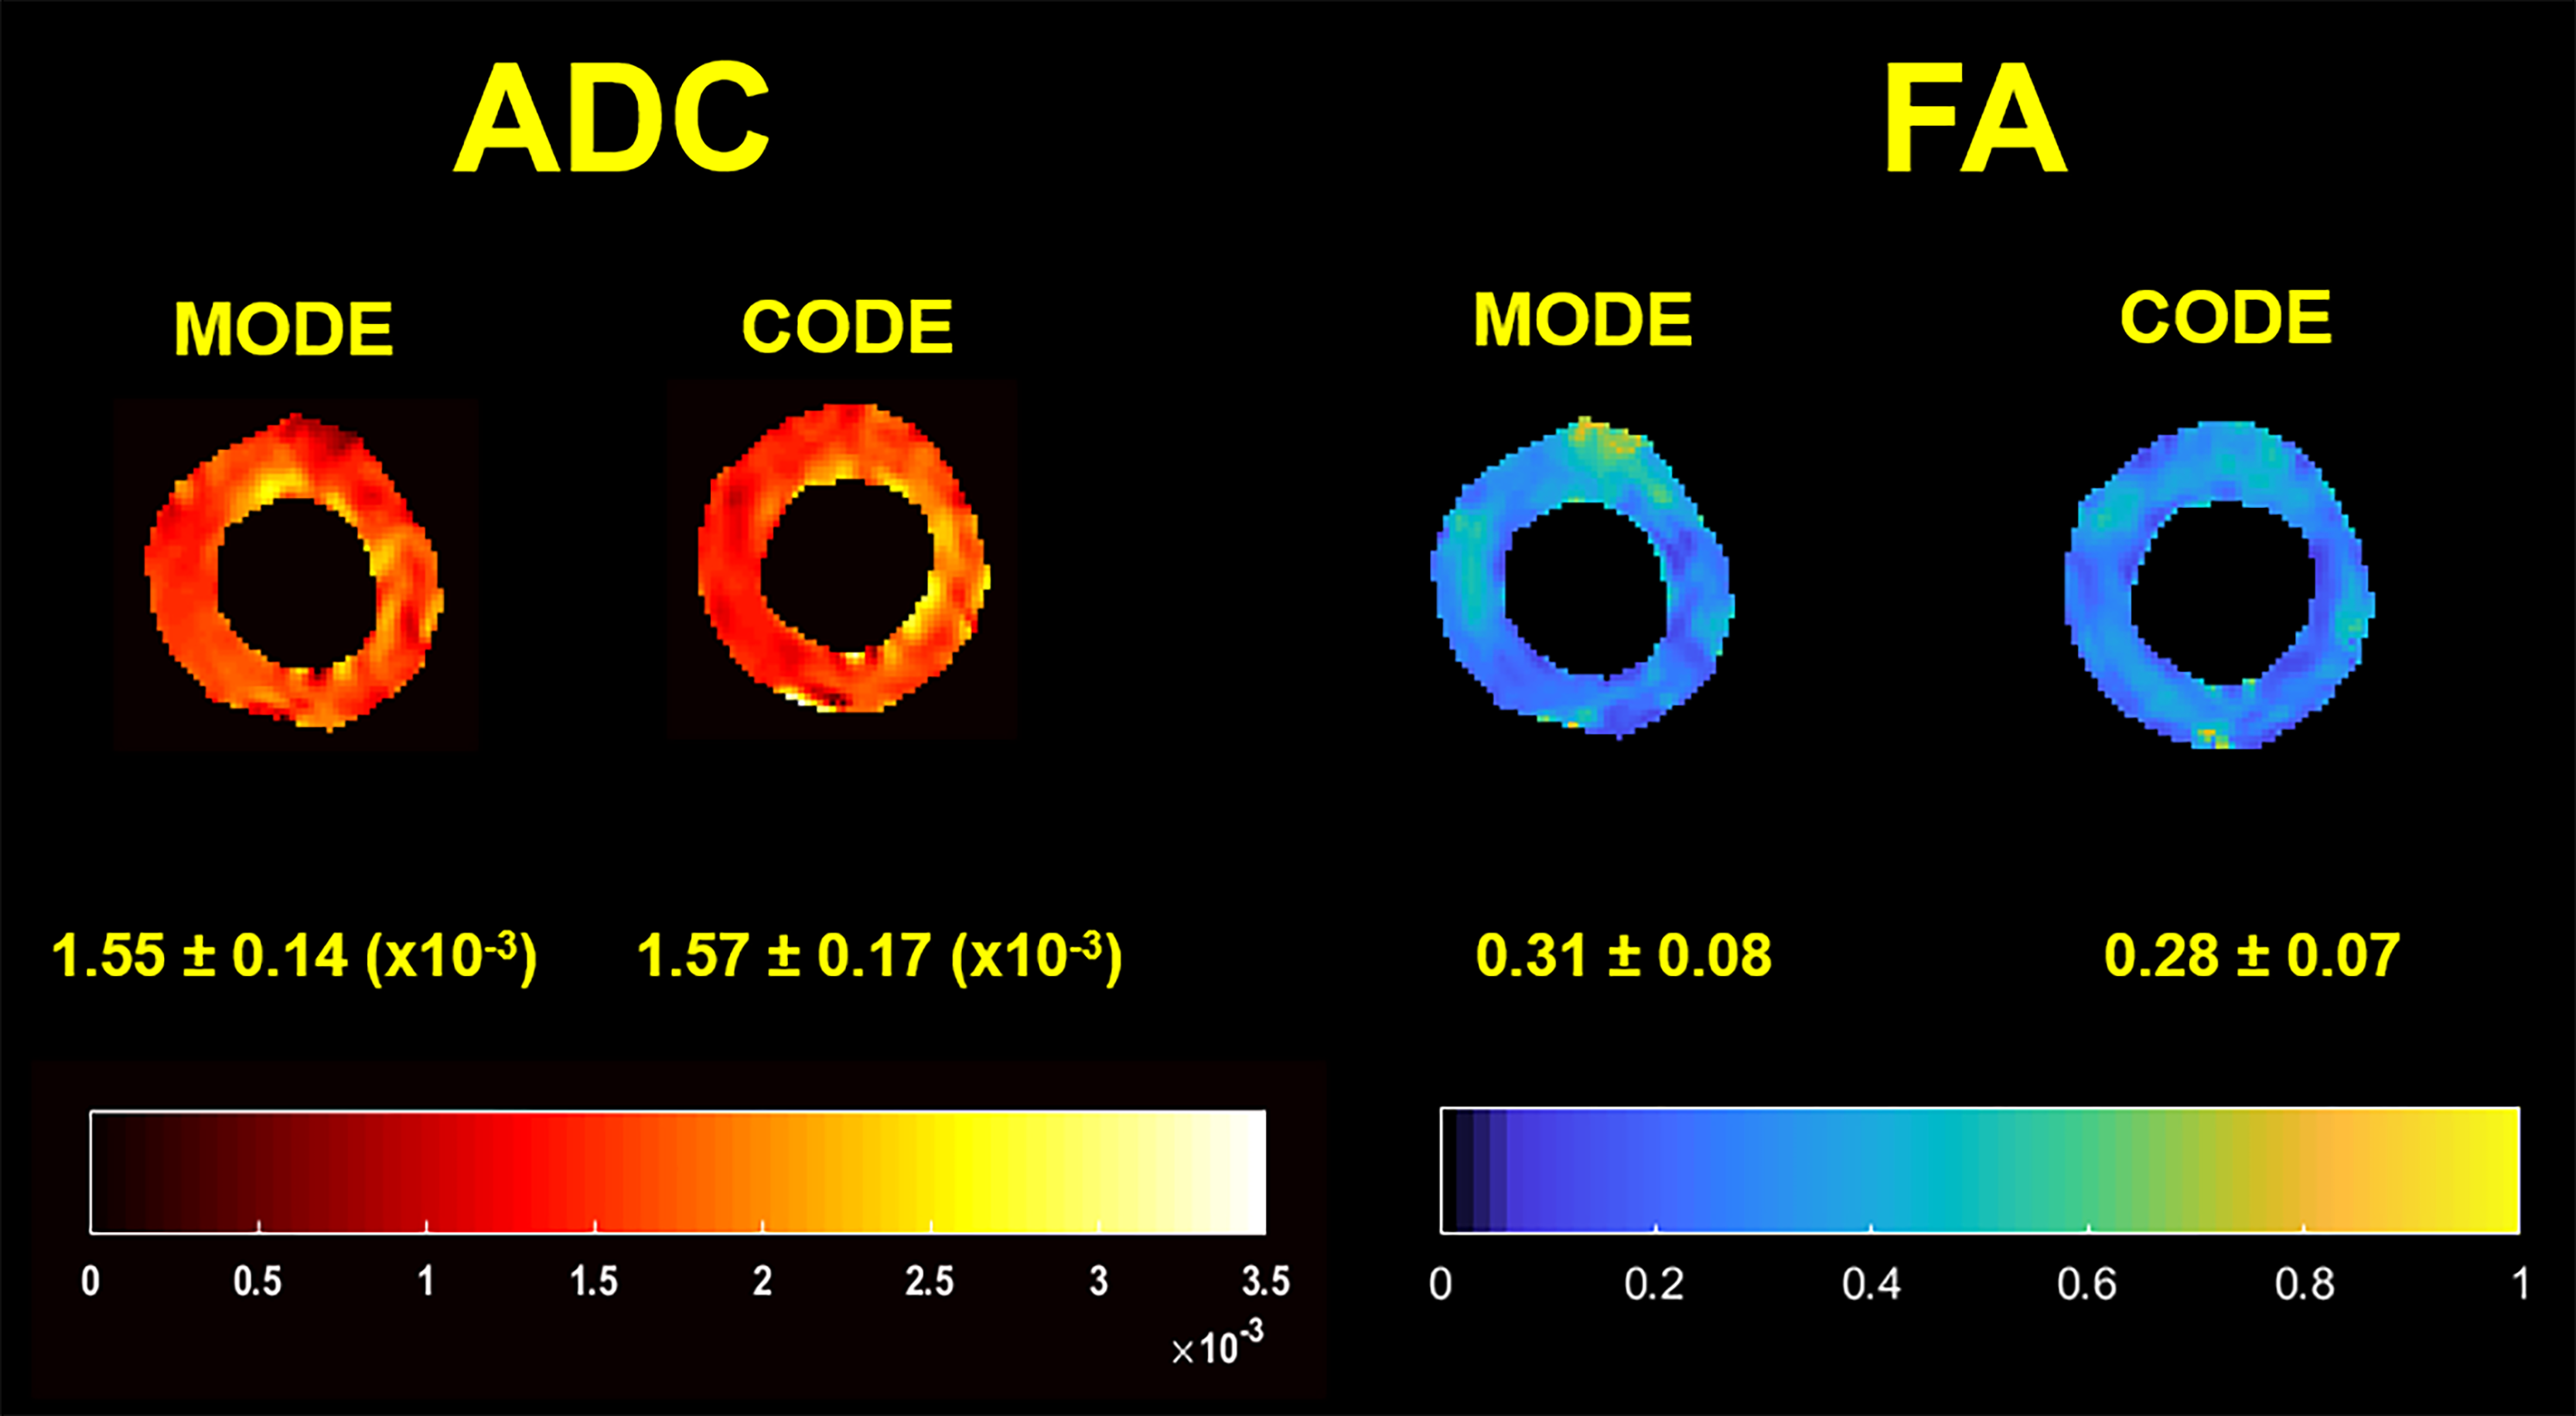
Figure 1 illustrates ADC and FA maps in a healthy volunteer using MODE and CODE sequence in mid ventricular short-axis slice. Mean ADC across all healthy subjects was found to be 1.50 ± 0.16 (x10-3) mm2/s and 1.47 ± 0.16 (x10-3) mm2/s using MODE and CODE sequences, respectively. Similarly, mean FA across all healthy subjects was found to be 0.31 ± 0.04 and 0.30 ± 0.05 using MODE and CODE sequences, respectively.
Figure 2 shows ANOVA (Analysis of variance) plot for ADC and FA comparing two different methods MODE and CODE. There is no significant difference found between CODE and MODE with 0.031 for ADC (p-value 0.591) and 0.003 for FA (p-value of 0.844).
Conclusion
Preliminary study demonstrated no significant difference in ADC and FA values obtained using MODE and CODE sequences. Moreover, MODE generated slightly higher b-value compared to CODE for a given TE. In addition, for a larger b-value, the difference in TE becomes greater between CODE and MODE.Acknowledgements
This study is supported by National Institute of Health grant NIH-R01HL123096.References
[1] Sosnovik DE, Wang R, Dai G, Reese TG, Wedeen VJ. Diffusion MR tractography of the heart. Journal of Cardiovascular Magnetic Resonance. 2009 Dec;11(1):47.
[2] Mori S. Introduction to diffusion tensor imaging. Elsevier; 2007 May 17.
[3] Pop M, Ghugre NR, Ramanan V, Morikawa L, Stanisz G, Dick AJ, Wright GA. Quantification of fibrosis in infarcted swine hearts by ex vivo late gadolinium-enhancement and diffusion-weighted MRI methods. Physics in Medicine & Biology. 2013 Jul 8;58(15):5009.
[4] Aliotta E, Wu HH, Ennis DB. Convex optimized diffusion encoding (CODE) gradient waveforms for minimum echo time and bulk motion–compensated diffusion‐weighted MRI. Magnetic resonance in medicine. 2017 Feb;77(2):717-29.
[5] Waqas M , Kalra P, and Kolipaka A. Motion Compensated, Optimized Diffusion Encoding (MODE) Gradient Waveforms. 25th Sci Meet Int Soc Magn Reson Med; 2017.
[6] Perona P, Malik J. Scale-space and edge detection using anisotropic diffusion. IEEE Transactions on pattern analysis and machine intelligence. 1990 Jul;12(7):629-39.
Figures