3494
Impact of different b-value combinations on Radiomics Features of Apparent Diffusion Coefficient in Cervical Cancer1Department of Radiology, Hubei Cancer Hospital, Wuhan, China, 2Medical engineering and technology center, Taishan Medical University, Taian, China, 3Department of Radiation Oncology, University of California Davis Medical Center, Sacramento, CA, United States
Synopsis
There is potential influence of different b-value combinations on evaluation of ADC-based radiomics features. The aim of this study is to investigate the difference between ADC-based radiomics feature extracted from ADC maps with different b-value combinations in cervical cancer. It was found that variable b-value combinations can play substantially impact on radiomics features extracted from corresponding ADC maps in cervical cancer. Therefore, we should pay more attention to the choice of b-value combinations in retrospective and multi-center studies.
Introduction
Apparent diffusion coefficient (ADC) estimates require diffusion-weighted imaging (DWI) images with different diffusion weightings, named as b-values. And the model of water diffusion needs different b-value combinations, however, previous studies have been discovered that variable b-value combinations play an important impact on the ADC values based on 3 T 1-3 and 1.5 T 4 in oncology. In addition, the number of b-values should be also taken into account because it directly affected the total acquisition time of MRI examination 3. We hypothesis that variability in b-value combinations utilized in ADC maps may affect quantitative radiomics features extracted from images. Therefore, the purpose of this study is to investigate if there is a difference between radiomics features extracted from ADC maps with different b-value combination in cervical cancer.Methods
Conventional protocols and DWI (b-values: 0, 600, 800, and 1000 s/mm2) were acquired on a 1.5 T MR scanner. 20 patients with histologically confirmed cervical cancer were included in this retrospective study. Regions of interest (ROIs) were manually drawn along the margin of the largest transversal cross section of tumor with reference to the corresponding high-resolution T2WI images by a senior radiologist with 10 years of experience. Seven combinations of b-value combinations were used: (1) b = 0, 600 s/mm2; (2) b = 0, 800 s/mm2; (3) b = 0, 600, 800 s/mm2; (4) b = 0, 600, 1000 s/mm2; (5) b = 0, 600, 800, 1000 s/mm2; (6) b = 0, 800, 1000 s/mm2; (7) b = 0, 1000 s/mm2. For each b-value combination, 92 radiomics features from the categories of grey level co-occurrence matrix (n = 23), gray level size matrix. matrix (n = 14), neighborhood gray-tone difference matrix (n = 16), gray level dependence matrix (n = 5), grey level run length matrix (n = 16) and first order (n = 18) were derived from corresponding ADC maps. Coefficient of variance (CV) was used to evaluate the stability of radiomics features over different b-value combinations. To gauge the magnitude of the b-value combinations effects, the features (CV > 5%) were normalized by CV of the corresponding ADC-based features.Results
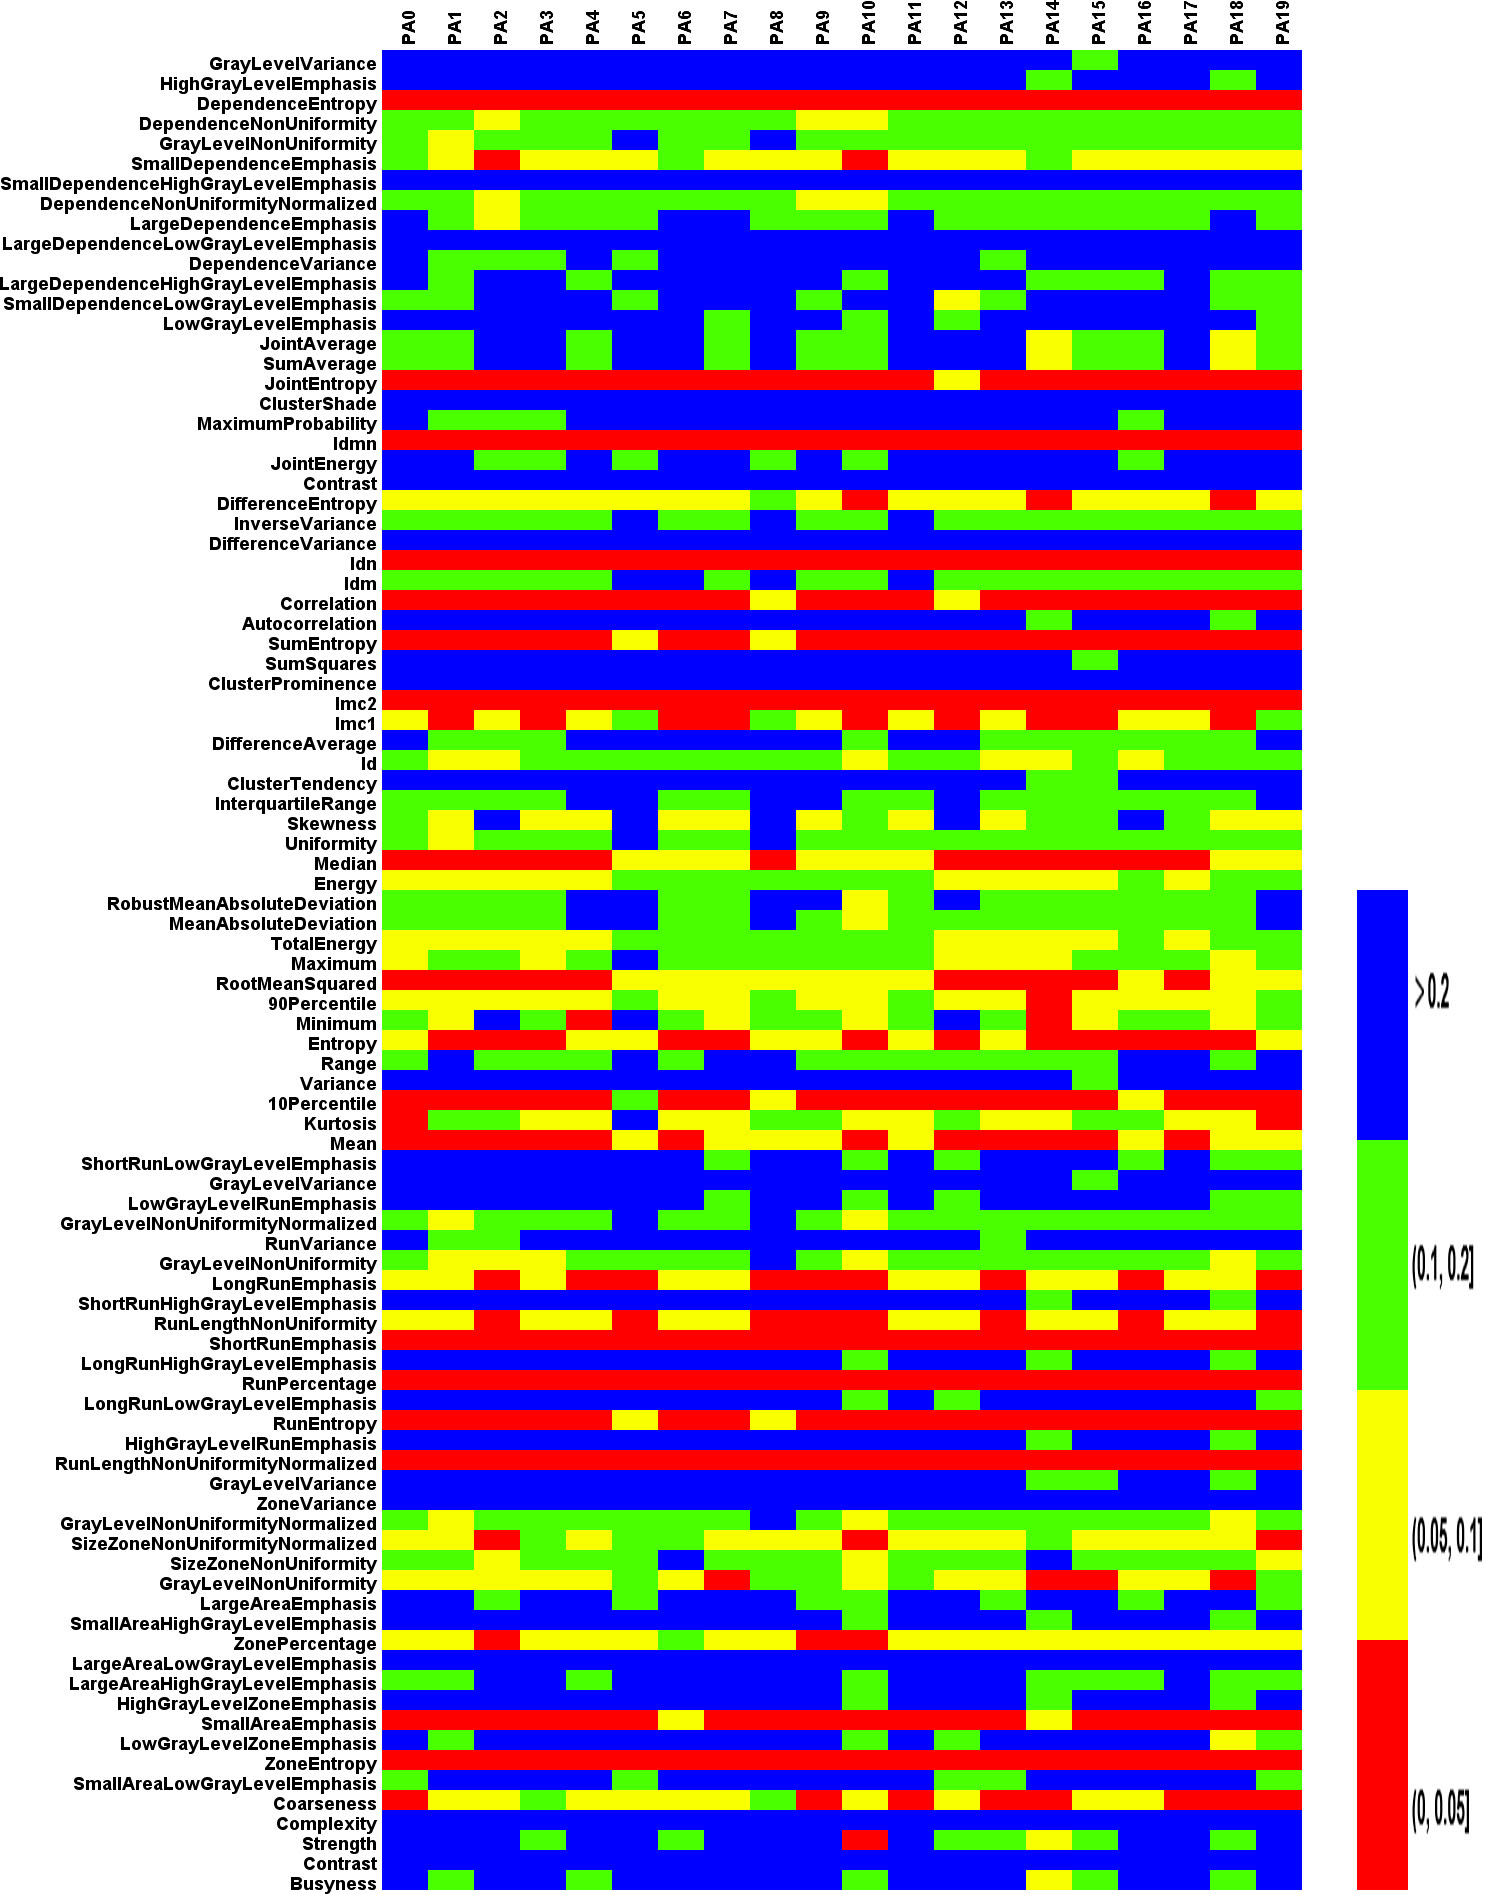
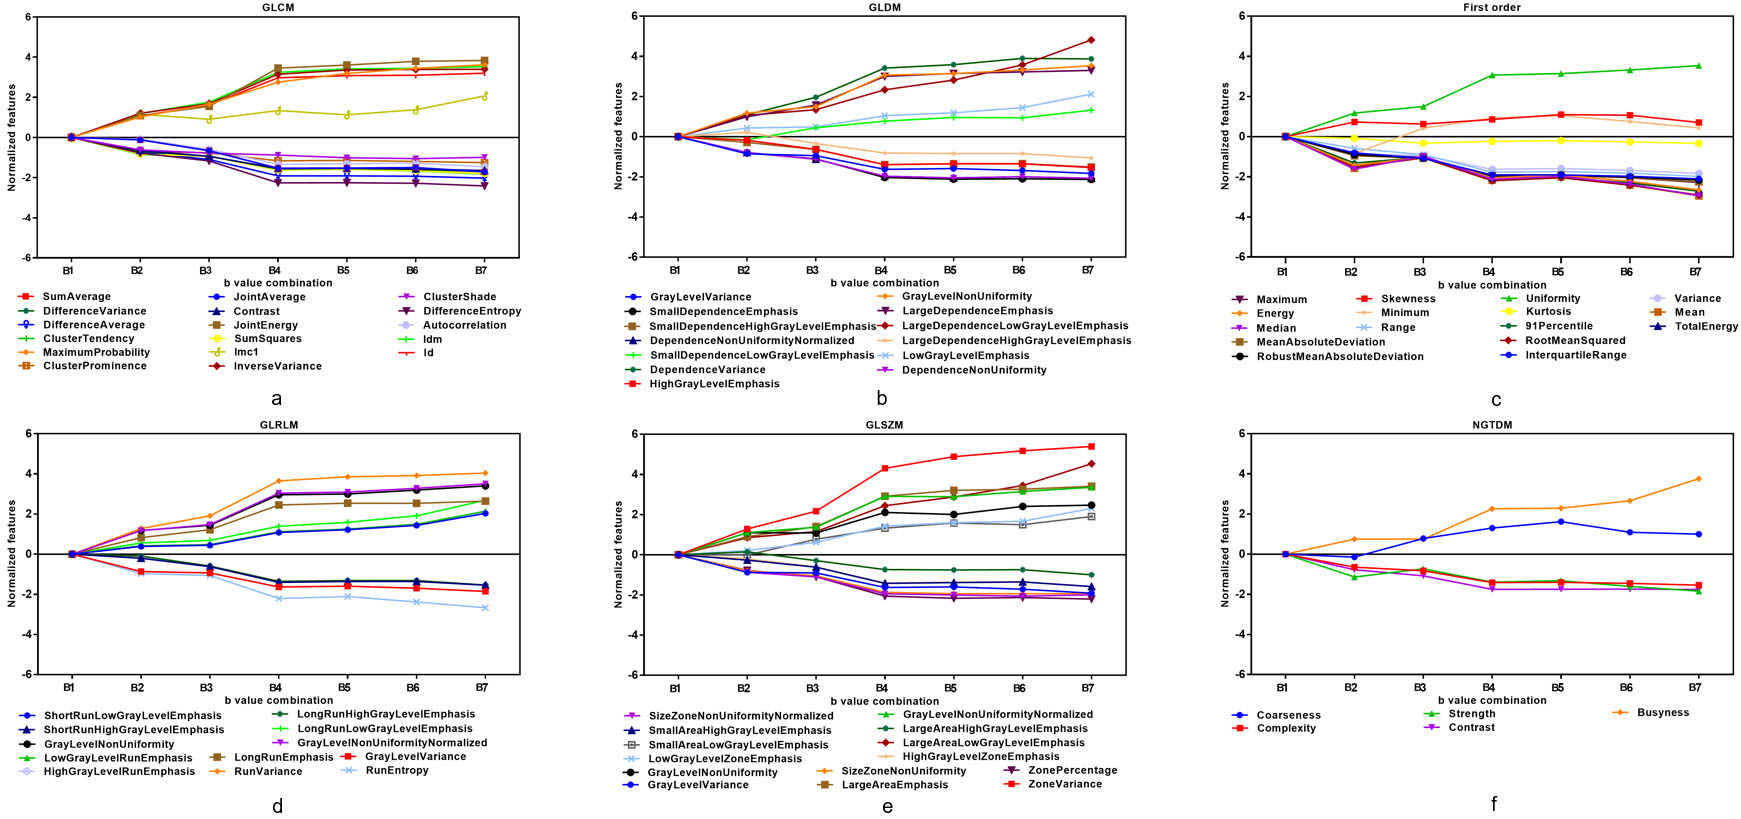
The effects of different b-value combinations on variability are illustrated in Fig 1 for the patient cohort quantified using CV. Only 16 of 92 radiomics features with the result of CV ≤ 5% indicated that they were relatively robust for the different b-value combinations. 10 of 92 radiomics features with the result of 5% < CV ≤ 10%, 22 of 92 radiomics features with 10% < CV ≤ 20%, 44 of 92 radiomics features with CV > 20%. Moreover, with the increase of the b-value combinations, 27 of 76 radiomics features rises and the rest decreases (CV > 5%). Meanwhile, the effects of b-value combinations on radiomics features extracted from ADC maps are shown in Fig 2. The feature values (CV > 5%) used in Fig 2 were normalized by CV of the corresponding ADC-based features to generate feature-normalized values under various b-values combinations. For cervical cancer, there was substantially changes in the feature-normalized values based on different b-value combinations. More specifically, with the increase of the b-value combinations, 27 of 76 radiomics features rises and the rest decreases (CV > 5%). The difference in feature-normalized values calculated for b-value combination of 0 and 1000 s/mm2 was substantially greater than feature-normalized values calculated from other b-value combinations.Discussion
There are few researches applied ADC-based radiomics features with different b-value combinations to tumor differentiation, histological grade evaluation and metastasis prediction etc. for cervical cancer 5-8. To our best knowledge, the influence of variable b-value combination on ADC-based radiomics features has not been taken seriously. Liu et al. 6 reported that the ADC-based features with different b-value combinations of b=0,800 s/mm2 and b=0,1000 s/mm2 both had the function of histological grade evaluation, but there were significant differences in the overall classification error (P=0.0076), which verified our study. These results suggest that we should pay more attention to the choice of b-value combinations in retrospective and multi-center studies. This is important because different b value combinations in multi-centers and inter-devices will affect ADC-based radiomics features, thus, it may be difficult to coordinate b-value combinations between inter-institutions.Conclusion
Variable b-value combinations can play substantially impact on radiomics features extracted from corresponding ADC maps.Acknowledgements
This study received funding from the China National Key Research and Development Program (2016YFC0103400). Jianfeng Qiu is supported by the Taishan Scholars Program of Shandong Province.References
1. Kim CK, Park BK, Kim B. High-b-value diffusion-weighted imaging at 3 T to detect prostate cancer: comparisons between b values of 1,000 and 2,000 s/mm2. AJR Am J Roentgenol. 2010;194(1):W33-37.
2. Vargas HA, Akin O, Franiel T, et al. Diffusion-weighted Endorectal MR Imaging at 3 T for Prostate Cancer: Tumor Detection and Assessment of Aggressiveness. Radiology. 2011;259(3):775-784.
3. Thörmer G, Otto J, Reiss-Zimmermann M, et al. Diagnostic value of ADC in patients with prostate cancer: influence of the choice of b values. Eur Radiol. 2012;22(8):1820-1828.
4. Peng Y, Jiang Y, Antic T, et al. Apparent diffusion coefficient for prostate cancer imaging: impact of B values. AJR Am J Roentgenol. 2014;202(3):W247-253.
5. Wu Q, Shi D, Dou S, et al. Radiomics Analysis of Multiparametric MRI Evaluates the Pathological Features of Cervical Squamous Cell Carcinoma. J Magn Reson Imaging. 2018.
6. Liu Y, Zhang Y, Cheng R, et al. Radiomics analysis of apparent diffusion coefficient in cervical cancer: A preliminary study on histological grade evaluation. J Magn Reson Imaging. 2018.
7. Becker AS, Ghafoor S, Marcon M, et al. MRI texture features may predict differentiation and nodal stage of cervical cancer: a pilot study. Acta Radiol Open. 2017;6(10):2058460117729574.
8. Downey K, Riches SF, Morgan VA, et al. Relationship between imaging biomarkers of stage I cervical cancer and poor-prognosis histologic features: quantitative histogram analysis of diffusion-weighted MR images. AJR Am J Roentgenol. 2013;200(2):314-320.
Figures