3486
Alteration of IVIM Parameters by Signal Variation of Multiple b-value DWI Measurement1Department of Medical Imaging, China Medical University Hsinchu Hospital, Hsinchu, Taiwan, taichung, Taiwan, 2Department of Automatic Control Engineering, Feng Chia University, Taichung, Taiwan, taichung, Taiwan, 3Department of Computer Science and Information Engineering, National Cheng-Kung University, Tainan, Taiwan., tainan, Taiwan, 4Department of Electrical Engineering, National Taiwan University of Science and Technology, Taipei, Taiwan, taipei, Taiwan
Synopsis
The purpose of this study is to explore the alterations of IVIM measurement among multiple b-value sets with different low b-value and high b-value numbers using EPDWI. EPDWI with 41 different b-values was performed. For simulating the situation in clinic, five sets of 16 b-value numbers were chose from the 41 b values. DWI data of 1000 pixels for each WM, GM and CSF were randomly chose to evaluate the error of IVIM parameters. Our study demonstrated the variation of DWI signal with multi-b-value, affect the evaluation of Df and f but does not affect Ds in pixel-wise IVIM analysis.
Introduction
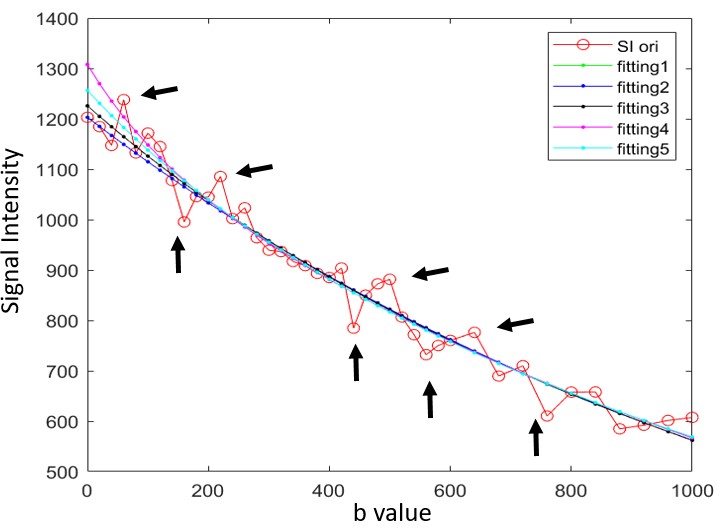
Intravoxel incoherent motion (IVIM) can not only measure the diffusion but also obtain the perfusion information in tissue without intravenous injection of contrast agent [1]. IVIM uses multiple b values, especially including the flow-sensitive low b values, to distinguish between fast microvascular flow and slow intracellular and extracellular water diffusion, and the proportion of perfusion. The acquired data with multiple b values are used to generate IVIM parametric maps via pixel-by-pixel computation based on a biexponential fit using a nonlinear fitting procedure. Many researchers have investigated on the fitting model of IVIM data processing for accurate IVIM computation [2-4]. Because of the limited scan time, typically 10 to 16 b-value sets are performed between 0 and 1000 s/mm² with half of b values at no more than 250 s/mm² in clinical practice [5,6]. However, signal variation of each single pixel on DWI is a concern for EPDWI measurement (Fig.1). It is obvious that the noise-related fitting errors might be incurred when fewer b-value numbers are selected due to DWI signal variation. In this study, errors of IVIM parameters by DWI signal variation were calculated using different b-value numbers in brain.Materials and Methods
Experiment design: One healthy volunteer (male, age of 23 years) given informed consent took IVIM MRI scan. All images were performed by a 3 Tesla MR scanner (GE Signa MR750, GE Healthcare, Milwaukee,WI). EPI DWI sequence with diffusion-weighting images obtained along 3 orthogonal directions using a total of 41 different b-values (b = 0, 20, 40, 60, 80, 100, 120, 140, 160, 180, 200, 220, 240, 260, 280, 300, 320, 340, 360, 380, 400, 420, 440, 460, 480, 500, 520, 540, 560, 580, 600, 640, 680, 720, 760, 800, 840, 880, 920, 960, 1000 s/mm2). DWI were acquired in the axial plane, matrix size 192 x 192, FOV 220 x 220 mm, section thickness = 5 mm, NEX = 1, acceleration factor = 2, TR = 4000 ms, TE =84ms. Data Analysis: Image co-registration were preprocessed using SPM12 package. The WM, GM and CSF map were segmented by b0 image. The DWI signal decay as a function of b-values is modeled according to the following biexponential equation based on the IVIM theory: Sb/So = f*exp(−b(Df)) + (1−f)*exp(−bDs), here f is the perfusion fraction, Df is called the pseudodiffusion coefficient and reflects dephasing due to perfusion, Ds is diffusion coefficient. We applied a pixel-wise non-linear least squares fit of the biexponential equation to the DWI data. For simulating the situation in clinic, five sets of 16 b-value numbers were chosen from the measurement data of 41 b values. In the five sets, the numbers of low b values (0-240) to high b values (260-1000) were 11:5, 10:6, 9:7, 8:8, and 7:9 with randomly assignment. DWI data of 1000 pixels for each WM, GM and CSF were randomly chosen to evaluate the error of IVIM parameters by the five sets of 16 b-value numbers. The IVIM parameters fitting by original 41 b values were as the reference set for calculating the error percentage for the IVIM parameters in five sets of 16 b values using |IVIM5set-IVIMori|/IVIMori x 100%.Result
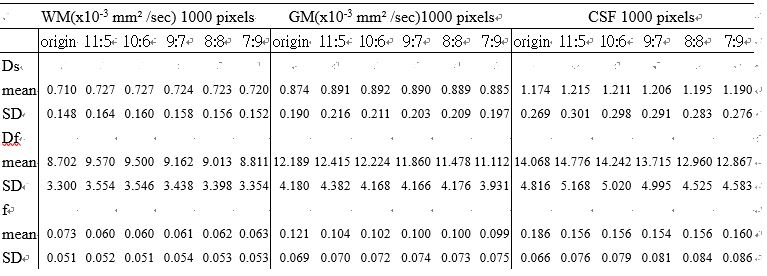
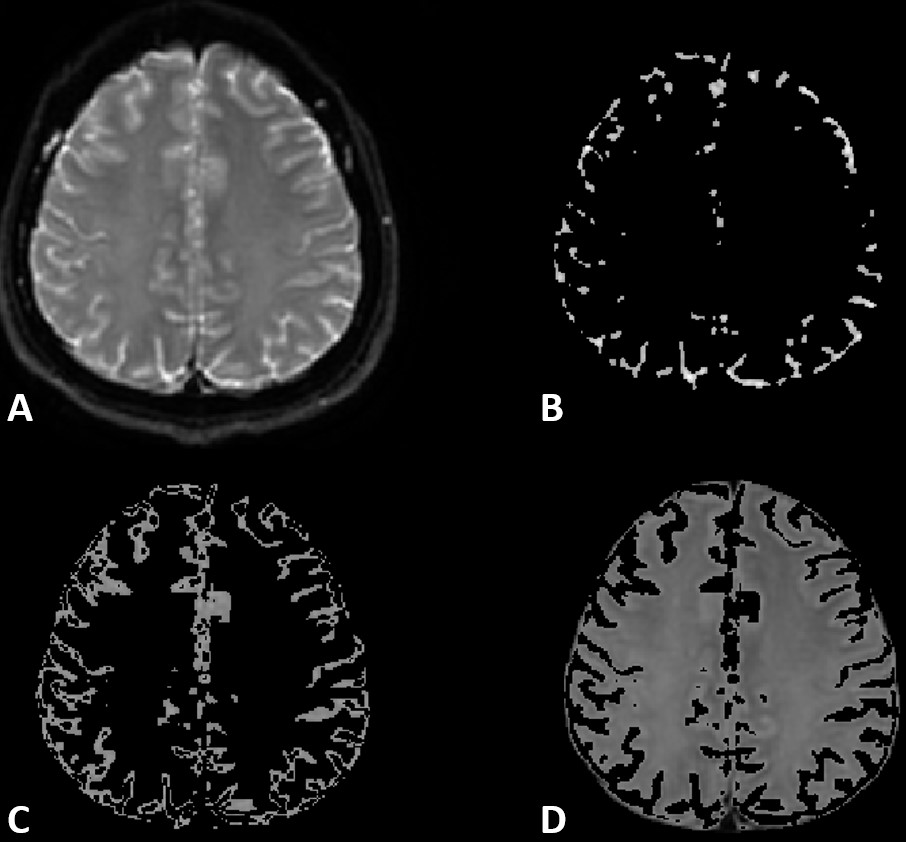
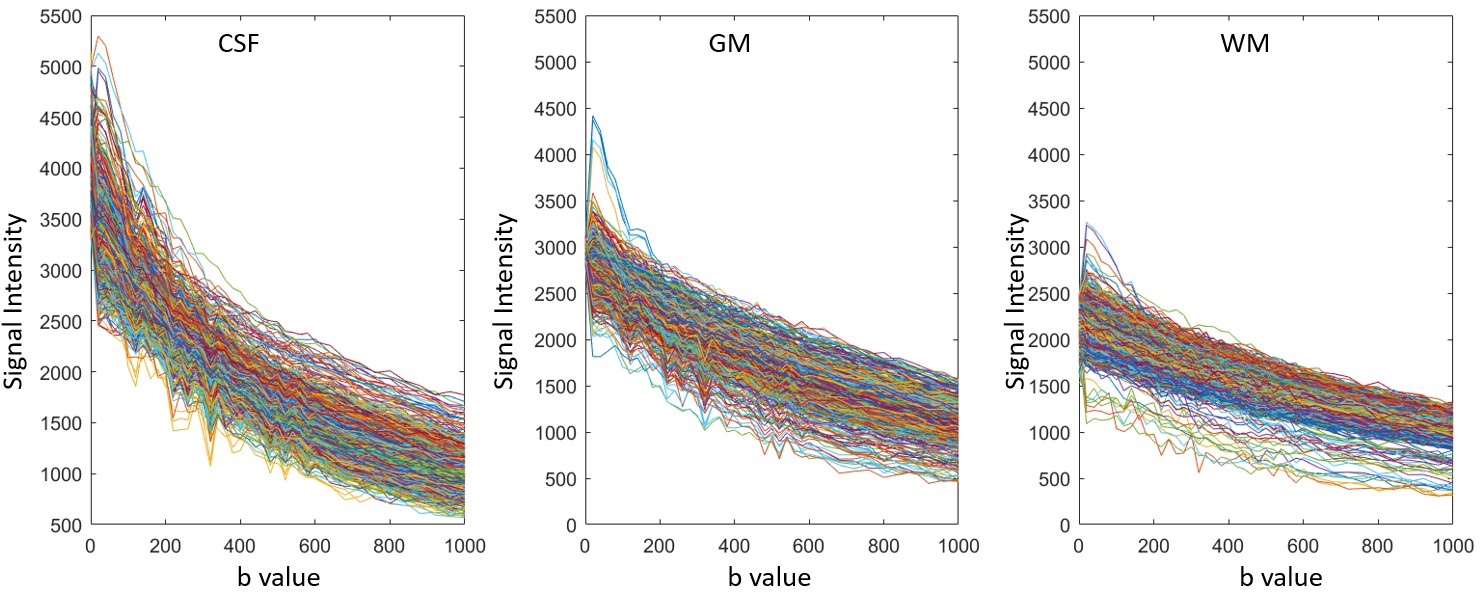
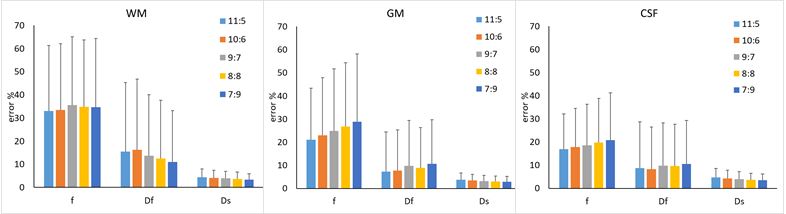
The GM, WM and CSF maps were segmented by b0 image (Fig. 2). Fig. 3 showed the DWI signals of randomly 1000 pixels in each maps. The results (mean and standard derivation) of IVIM parameters (Ds, Df and f) of original 41 b values and the five sets of 16 b-value numbers in WM, GM and CSF were listed on Table 1. Fig. 4 showed the error percentage of IVIM parameters (f, Df and Ds) between reference set and the five sets of 16 b values.Conclusion
Our results show that the mean of Ds was slight different between reference and the five sets in WM, DM and CSF, but the mean of Df and f were various (Table 1). The error percentage also illustrated that the Ds was less affected in five sets, the mean errors were smaller than 5% in all brain tissue. However, the larger variation was shown in Df and f. The mean errors of Df were around 10% in GM and CSF, and 11~16% in WM. The mean errors of f were around 15~20% in CSF, 20~30% in GM, and over 30% in WM. Despite the largest error in WM, the f values of WM are actually very small which easily produces the strong error. Our study demonstrates the variation of DWI signal with multi-b-value, due to the gradient noise in EPDWI scan, affects the evaluation of Df and f but does not affect Ds in pixel-wise IVIM analysis.Acknowledgements
Supported by the Ministry of Science and Technology under grants 105-2221-E-035 -049 -MY2References
1. Federau C, Maeder P, O'Brien K, Browaeys P, Meuli R, Hagmann P. Quantitative measurement of brain perfusion with intravoxel incoherent motion MR imaging. Radiology. 2012 Dec;265(3):874-81. doi: 10.1148/radiol.12120584. Epub 2012 Oct 16.
2. Conklin J, Heyn C, Roux M, Cerny M, Wintermark M, Federau C. A Simplified Model for Intravoxel Incoherent Motion Perfusion Imaging of the Brain. AJNR Am J Neuroradiol. 2016 Dec;37(12):2251-2257. Epub 2016 Aug 25.
3. Keil VC, Mädler B, Gielen GH, Pintea B, Hiththetiya K, Gaspranova AR, Gieseke J, Simon M, Schild HH, Hadizadeh DR. Intravoxel incoherent motion MRI in the brain: Impact of the fitting model on perfusion fraction and lesion differentiability. J Magn Reson Imaging. 2017 Oct;46(4):1187-1199. doi: 10.1002/jmri.25615. Epub 2017 Feb 2.
4. Gurney-Champion OJ, Klaassen R, Froeling M, Barbieri S, Stoker J, Engelbrecht MRW, Wilmink JW, Besselink MG, Bel A, van Laarhoven HWM, Nederveen AJ. Comparison of six fit algorithms for the intra-voxel incoherent motion model of diffusion-weighted magnetic resonance imaging data of pancreatic cancer patients. PLoS One. 2018 Apr 4;13(4):e0194590. doi: 10.1371/journal.pone.0194590. eCollection 2018.
5. Federau C, Meuli R, O'Brien K, Maeder P, Hagmann P. Perfusion measurement in brain gliomas with intravoxel incoherent motion MRI. AJNR Am J Neuroradiol. 2014 Feb;35(2):256-62. doi: 10.3174/ajnr.A3686. Epub 2013 Aug 8.
6. Kim HS, Suh CH, Kim N, Choi CG, Kim SJ. Histogram analysis of intravoxel incoherent motion for differentiating recurrent tumor from treatment effect in patients with glioblastoma: initial clinical experience. AJNR Am J Neuroradiol. 2014 Mar;35(3):490-7. doi: 10.3174/ajnr.A3719. Epub 2013 Aug 22.
Figures