3485
Multi-parametric segmentation of whole-brain variability maps of diffusion MRI metrics1Neuroimaging, King's College London, London, United Kingdom, 2Forensic and Neurodevelopmental Sciences, King's College London, London, United Kingdom, 3Natbrainlab, London, United Kingdom
Synopsis
The analysis of the whole-brain statistical variability maps corresponding to different statistical coefficients provides quantitative and anatomical information regarding the reproducibility, reliability or biological variability of diffusion MRI data. However, the separate analysis of each statistical map cannot reveal the emerging relationships that exist between these three properties of the data and their interactions across the brain anatomy. In this abstract, we present a new integrated multi-parametric segmentation approach for the combined visualisation and analysis of the reproducibility, reliability and biological variability maps using diffusion MRI data acquired from an older population.
Introduction
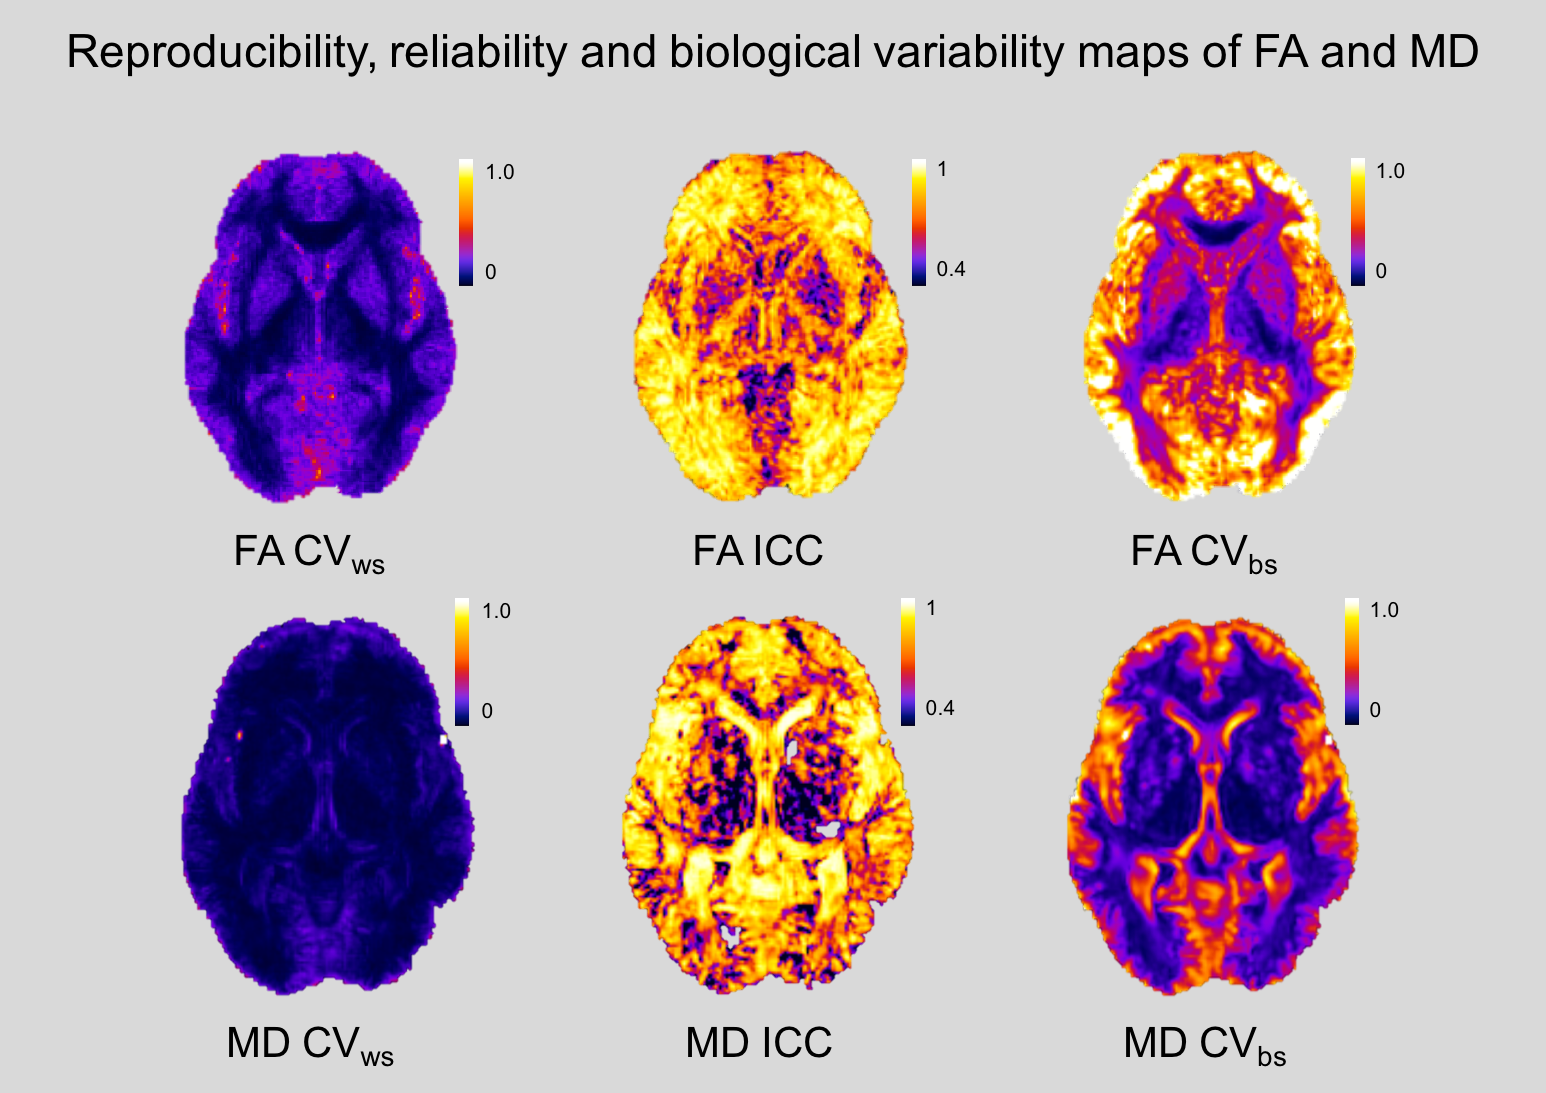
The reproducibility, reliability and biological variability of diffusion MRI metrics can be assessed at each voxel location by computing the corresponding coefficient of variation or correlation coefficient from image data acquired under appropriate test-retest conditions. From the statistical coefficients computed at the voxel level, whole-brain statistic variability maps can be produced to provide quantitative evaluation of these statistical properties across the brain anatomy (Figure 3). However, these statistical properties of the metrics are not independent from each other. Instead, they are related by a relationship that reflects their interaction throughout the brain. To investigate this relationship and the interaction between the reproducibility, the reliability and the biological sensitivity of diffusion MRI metrics across the brain, we propose a new method based on the multi-parametric segmentation of the statistical variability maps.Methods
Participants: sixteen healthy volunteers between 53 and 65 year old (8 females) each one scanned at three different sessions one and three weeks apart.
Data acquisition: per scanning session, 60 diffusion-weighted MRI volumes (b-value = 1500 sec/mm2) acquired along 60 different directions isotropically distributed on the sphere. In addition, 9 zero diffusion-weighted MRI volumes (3 volumes with reverse phase encoding direction).
Data preprocessing: each diffusion-weighted dataset was corrected for movement, Eddy currents and EPI geometric distortion artefacts using FSL eddy and topup1,2,3.
DTI metrics: nonlinear estimation of the diffusion tensor at each voxel and computation of fractional anisotropy (FA) and mean diffusivity (MD) whole-brain maps.
Voxel-level statistics: within-subject coefficient of variation (CVws), intra-class correlation coefficient (ICC) and between-subjects coefficient of variation (CVbs) to quantify the reproducibility, reliability and biological variability of each metric across the k=3 sessions at each voxel location.
$$$ CV_{ws}=\frac{(inTerSessionVariability) } {(grandMean)} ; $$$ $$$ ICC=\frac{(inTerSubjectVariability)-(inTerSessionVariability) } {(inTerSubjectVariability)+(k-1)(inTerSessionVariability)} ; $$$ $$$ CV_{bs}=\frac{(inTerSubjectVariability) } {(grandMean)}$$$
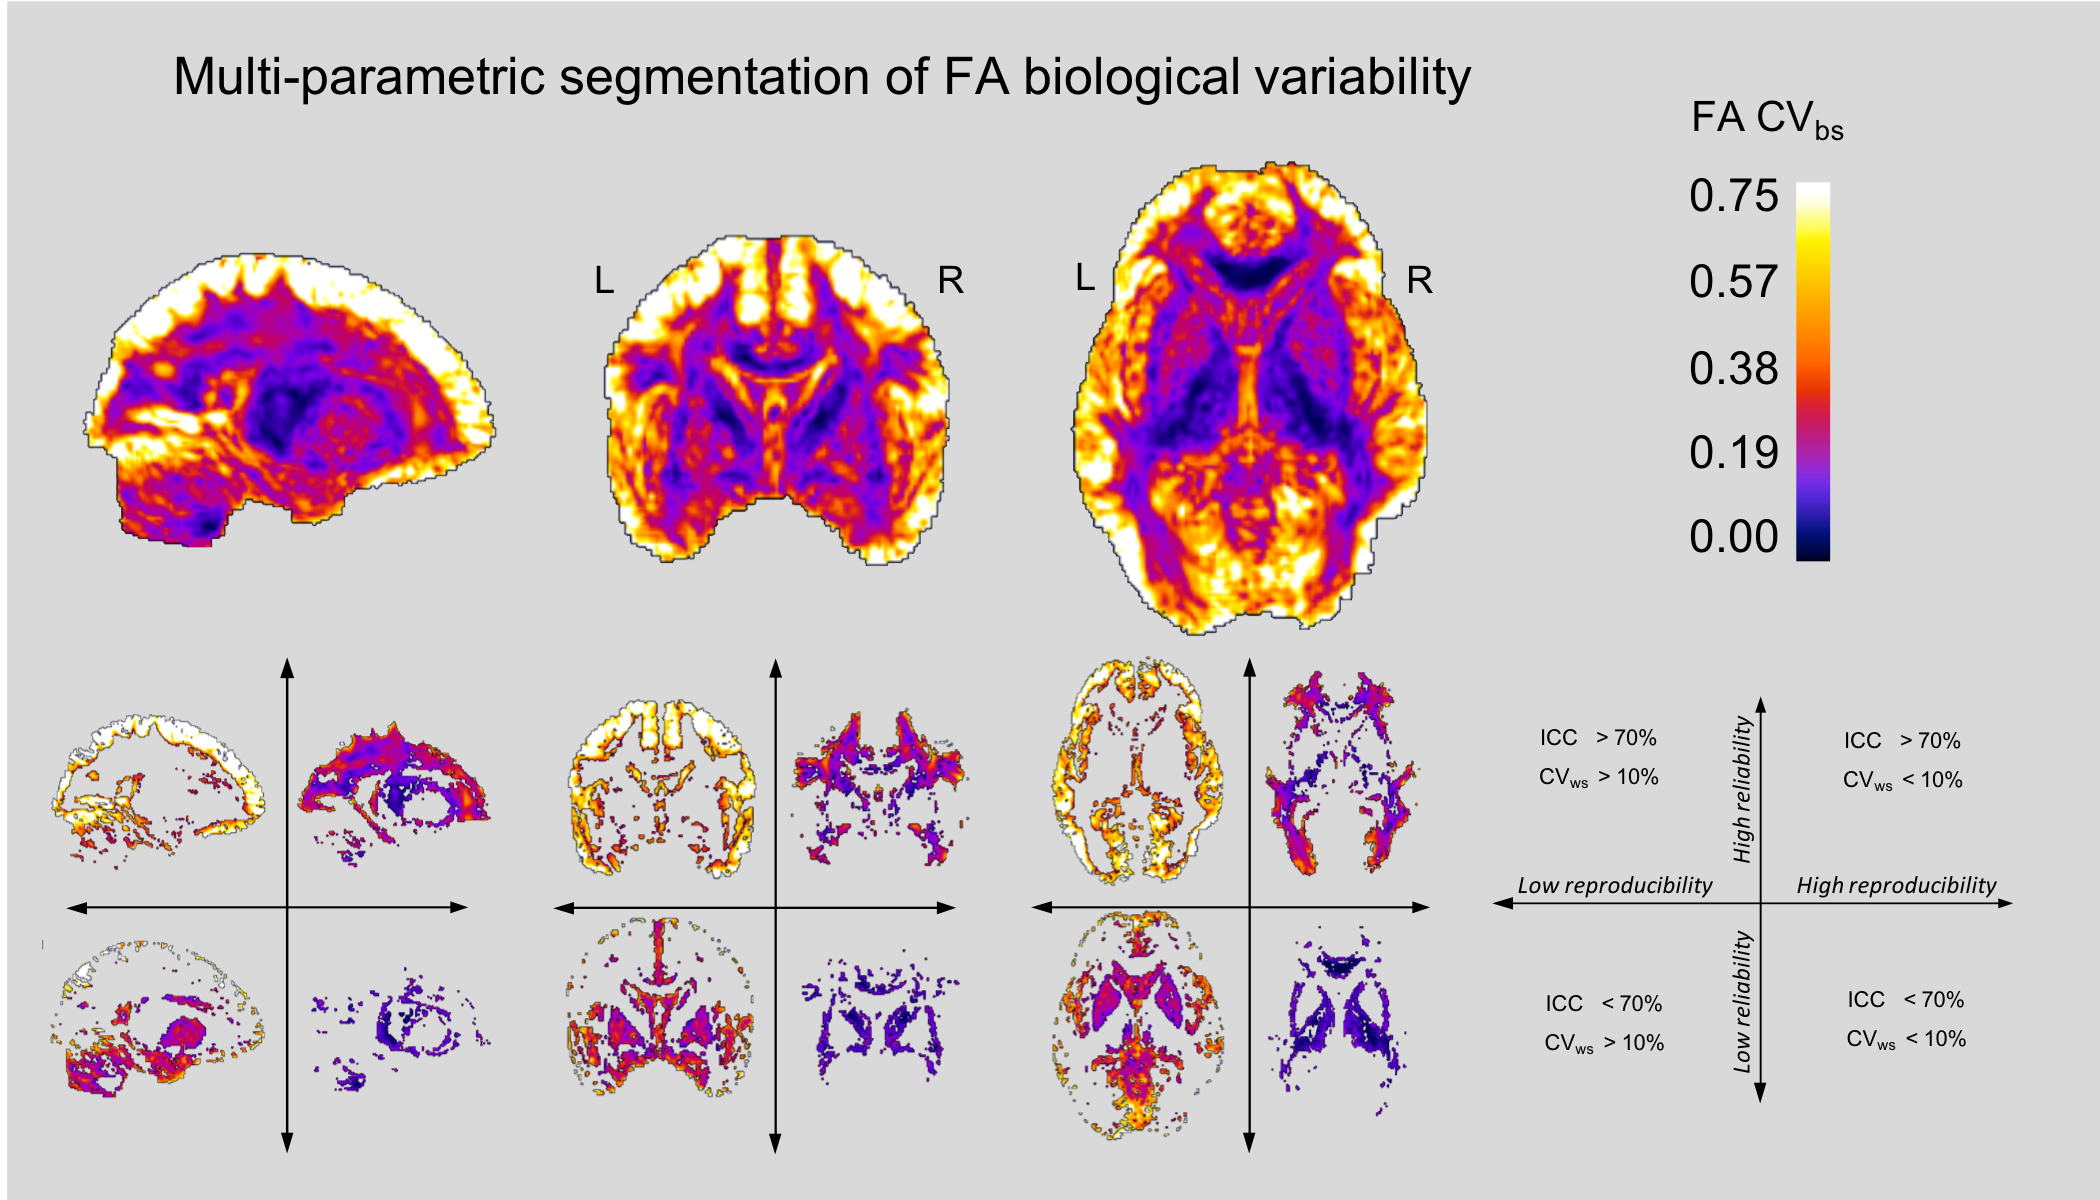
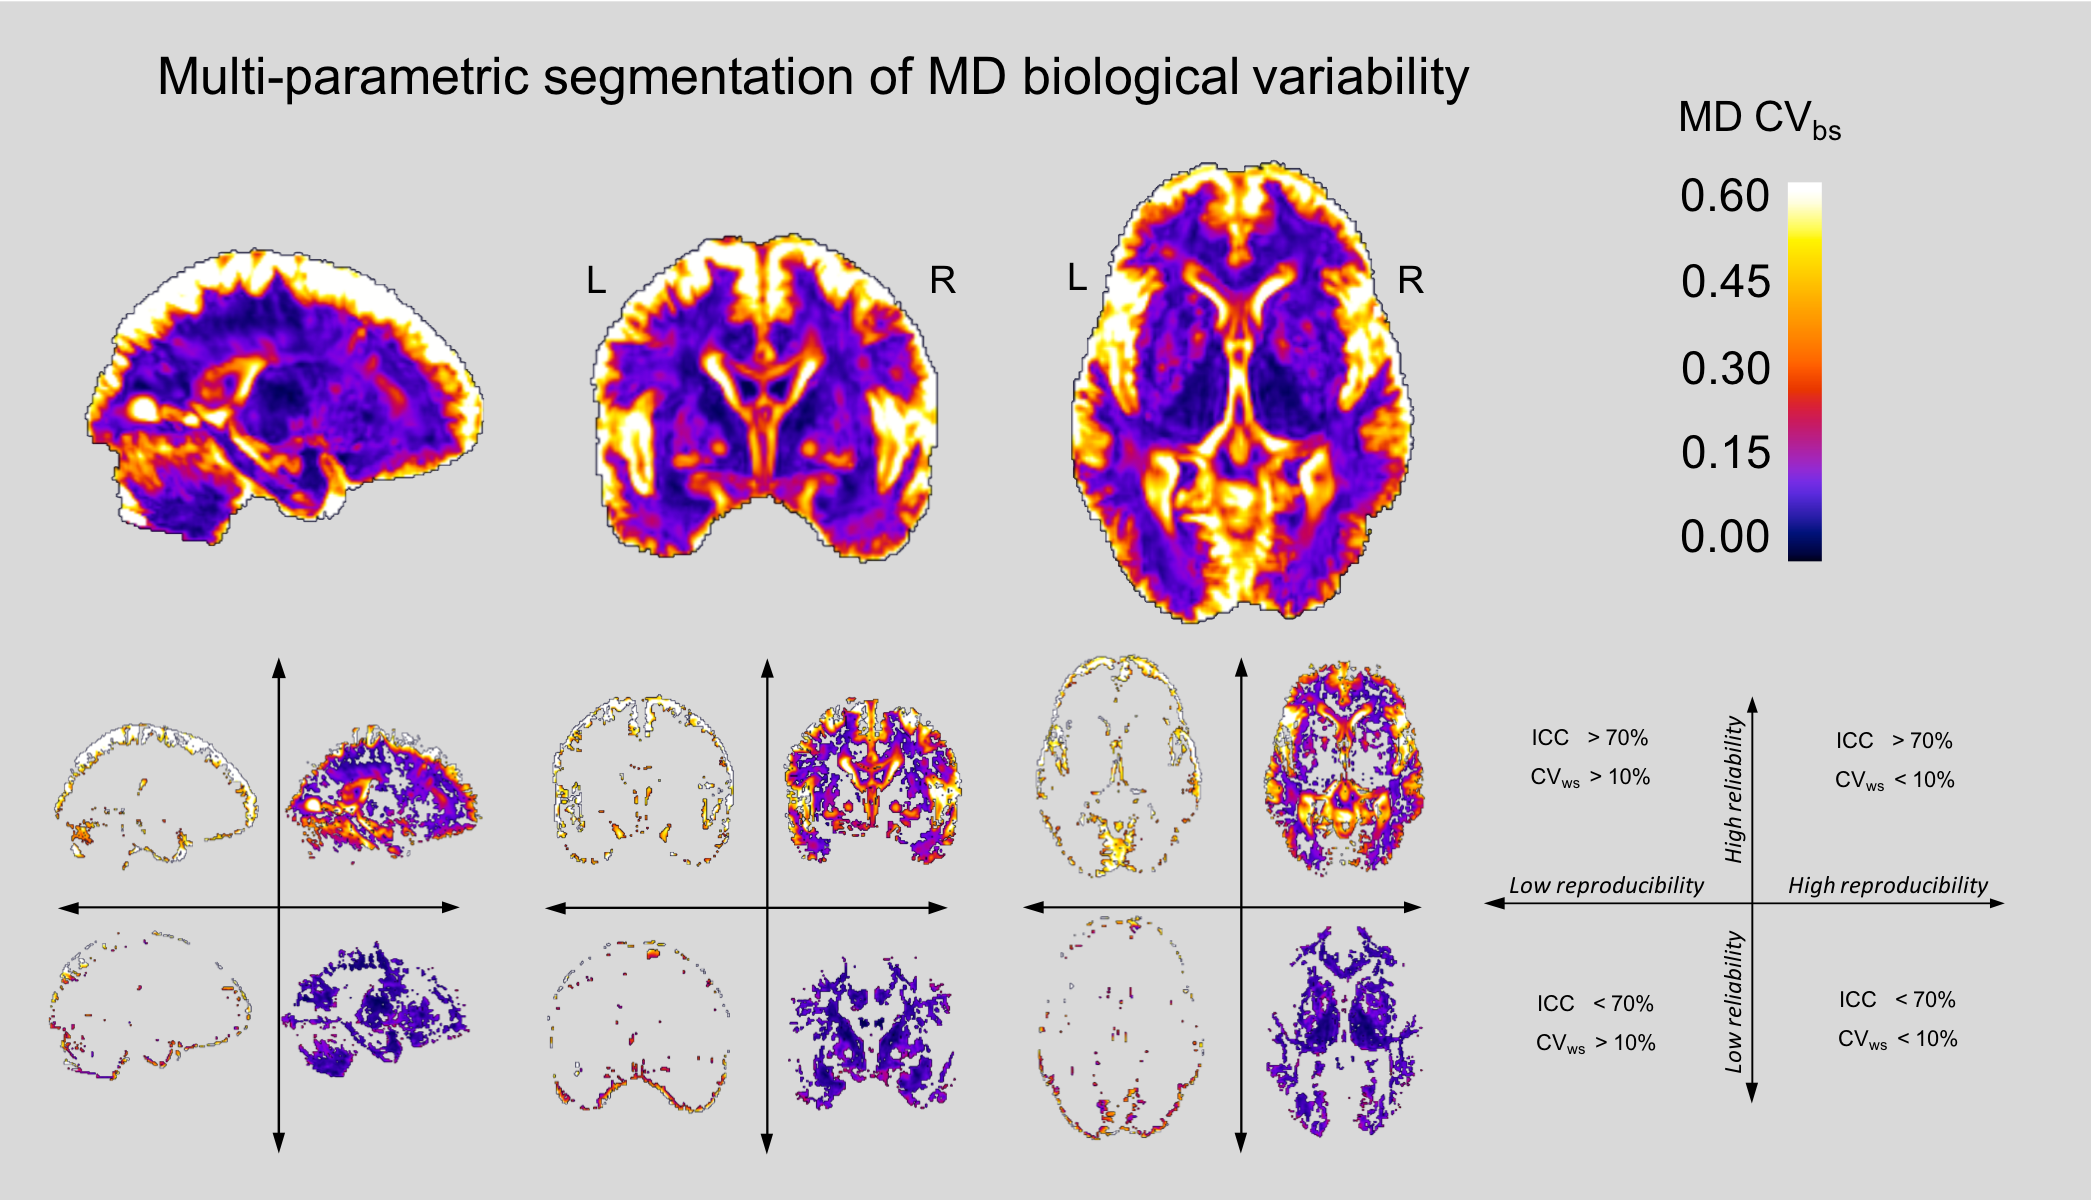
Multi-parametric segmentation of biological variability maps: each CVbs map was segmented into four separated regions of low/high levels of reproducibility and reliability using the following threshold criteria: CVws < 10% for high reproducibility regions versus CVws > 10% for low reproducibility regions5, ICC<70% for low reliability versus ICC > 70% high reliability 3,4,5,7.
Results
The multi-parametric segmentation of the CVbs maps produces meaningful anatomical regions where coherent patterns of reproducibility, reliability and biological variability can be identified. In addition, there is an emerging interaction effect of the reproducibility and reliability of the metrics on their biological variability.
For the FA, the biological variability is higher in regions of low reproducibility but high reliability such as the cortex and the underlying u-shape white matter fibres (Figure 1 Low-High quadrants). In contrast, the biological variability of FA is lower in regions of high reproducibility and low reliability such as the thalamus or the internal/external capsule (Figure 1 High-Low quadrants).
The same interaction between reproducibility and reliability is observed in the case of the MD, although demonstrated on a different pattern of anatomical regions. The biological variability of MD is very high in regions of low reproducibility and high reliability, for example near the surface of the brain (Figure 2 Low-High quadrants). It reduces in regions with high reproducibility and low reliability such as most subcortical grey matter regions (Figure 2 High-Low quadrants).
Finally, the regions with high levels of reproducibility and reliability are characterised by a dynamic range of biological variability in both metrics (High-High quadrants in Figure 1 and 2). In addition, there are clear anatomical differences between these groups of regions for each separate metric. The FA is reproducible and reliable mostly in the deep white matter, while in the case of the MD these regions are mostly associated with the cortical grey matter.
Conclusion
Multi-parametric segmentation of the biological variability maps reveals an emerging interaction between the reproducibility, the reliability and the biological variability of the diffusion metrics. Regions where the biological variability of the metrics is higher are the most reliable but the least reproducible, and vice versa. In consequence, those regions of very low biological variability where statistically significant results are more likely to be reported (specially by underpowered studies) are regions where the metrics are likely to be less reliable. The understanding of this interaction has important consequences for the statistical analysis of diffusion MRI data and for the interpretation of any results, particularly when these metrics are used to find brain differences between populations.Acknowledgements
This work is funded by the King’s College London & Imperial College London EPSRC Centre for Doctoral Training in Medical Imaging (EP/L015226/1) and by the National Institute for Health Research (NIHR) Biomedical Research Centre based at South London and Maudsley NHS Foundation Trust and King’s College London. The data collected was funded by Johnson & Johnson. The views expressed are those of the author(s) and not necessarily those of the NHS, the NIHR or the Department of Health.References
1 Andersson, J L R, S Skare, and J Ashburner. 2003. “How to correct susceptibility distortions in spin-echo echo-planar images: Application to diffusion tensor imaging.” Neuroimage 20 (2): 870–88.
2 Andersson, J L R, and S N Sotiropoulos. 2015. “Non- parametric representation and prediction of single- and multi-shell diffusion-weighted MRI data using Gaussian processes.” Neuroimage 122: 166–76.
3 Boekel, W, B U Forstmann, and M C Keuken. 2017. “A test-retest reliability analysis of diffusion measures of white matter tracts relevant for cognitive control.” Psychophysiology 54 (1): 24–33.
4 Duan, F, T Zhao, Y He, and N Shu. 2015. “Test-retest reliability of diffusion measures in cerebral white matter: A multiband diffusion MRI study.” Journal of Magnetic Resonance Imaging 42 (4): 1106–16.
5 Marenco, S, R Rawlings, G K Rohde, A S Barnett, R A Honea, C Pierpaoli, and D R Weinberger. 2006. “Regional distribution of measurement error in diffusion tensor imag- ing.” Psychiatry Research - Neuroimaging 147 (1): 69–78.
6 Smith, S M, M Jenkinson, M W Woolrich, C F Beck- mann, T E J Behrens, H Johansen-Berg, P R Bannister, et al. 2004. “Advances in functional and structural MR image analysis and implementation as FSL.” Neuroimage 23 (SUPPL. 1): S208–S219.
7 Vollmar, C, J O’Muircheartaigh, G J Barker, M R Symms, P Thompson, V Kumari, J S Duncan, M P Richardson, and M J Koepp. 2010. “Identical, but not the same: Intra-site and inter-site reproducibility of fractional anisotropy measures on two 3.0T scanners.” Neuroimage 51 (4): 1384–94.
Figures