3478
The Histogram Analysis of Intravoxel Incoherent Motion-Kurtosis (IVIM-Kurtosis) model for Detection of Prostate Cancer1Beijing Hospital, Beijing, China, 2Philips Healthcare, Beijing, China
Synopsis
Diffusion-weighted (DW) MR imaging has a great potential in the study of prostate cancer (PCa). We aimed to assess the feasibility and efficacy of intravoxel incoherent motion-kurtosis (IVIM-Kurtosis) model for the differential diagnosis of PCa, benign prostatic hyperplasia and prostatitis (BPH/prostatitis). Thirty-six patients were enrolled and underwent MRI subsequently using in-bore transrectal MR-guided biopsy as the pathological reference. Significant differences were found for D and f values for the differential diagnosis of PCa and BPH/prostatitis, and D median and f median had the highest area under curve. The f, K and D* were correlated with Gleason score (GS) of PCa.
Introduction
Diffusion-weighted (DW) MR imaging combined with various mathematical models has been gaining substantial interest as a possible tool to detect PCa. A few studies have demonstrated the potential of parameters of the diffusion and perfusion. However, few reports about intravoxel incoherent motion kurtosis (IVIM-Kurtosis) model have been reported. The goal of this study was to evaluate the feasibility and diagnosis efficiency of IVIM-Kurtosis model for the differential diagnosis of PCa and BPH/prostatitis. What’s more, we used the histogram analysis in this study for comprehensive evaluation of the characteristics of PCa and BPH/prostatitis.
Methods
A total of 36 patients suspected of PCa were enrolled in this study. MR imaging was performed with a 3 T MR system( Achieva 3.0 T; Philips Medical Systems, Best, the Netherlands). All patients underwent MR imaging and in-bore transrectal MR-guided biopsy was used as the pathological reference. Diffusion weighted imaging was acquired using 16 b values (0, 20, 50, 100, 200,500,1000,1500, 2000 s/mm2) and analyzed using an IVIM-Kurtosis model. Quantitative parameters were acquired, including diffusion coefficient (D), diffusion coefficient related to perfusion (D*), perfusion fraction (f) and kurtosis (K). The histogram analysis of these parameters was performed to get the mean, median, 10th percentile, 25th percentile, 75th percentile, 90th percentile, skew and kurtosis. Regions of interest (ROI) was performed by two neuroradiologists and the interobserver agreement was examined by using interclass correlation coefficients (ICC). The parameters of PCa and BPH/prostatitis were compared by using the independent t-test. The diagnostic performance of histogram parameters in identifying PCa and BPH/prostatitis was carried by ROC analysis. Spearman rank correlation analysis was used to evaluate the correlation of these parameters and GS of PCa.Results
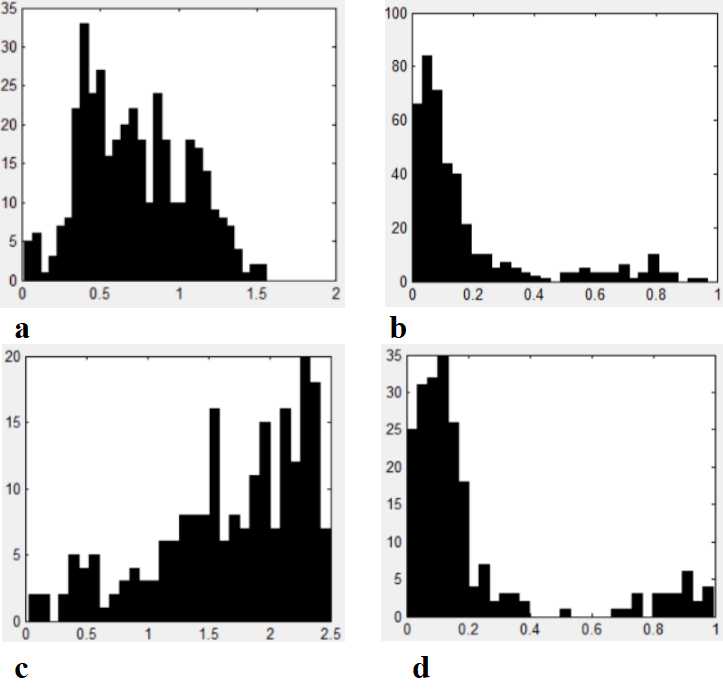
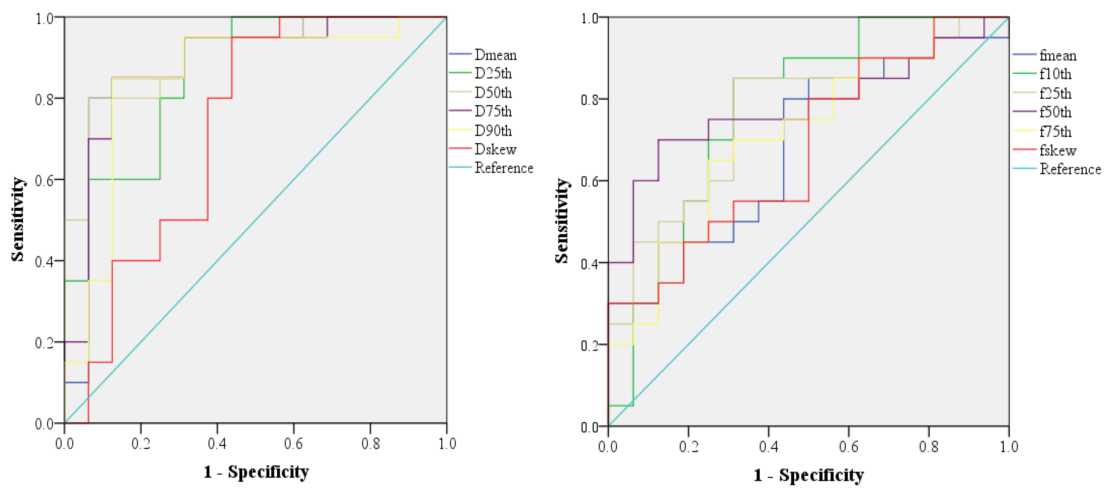
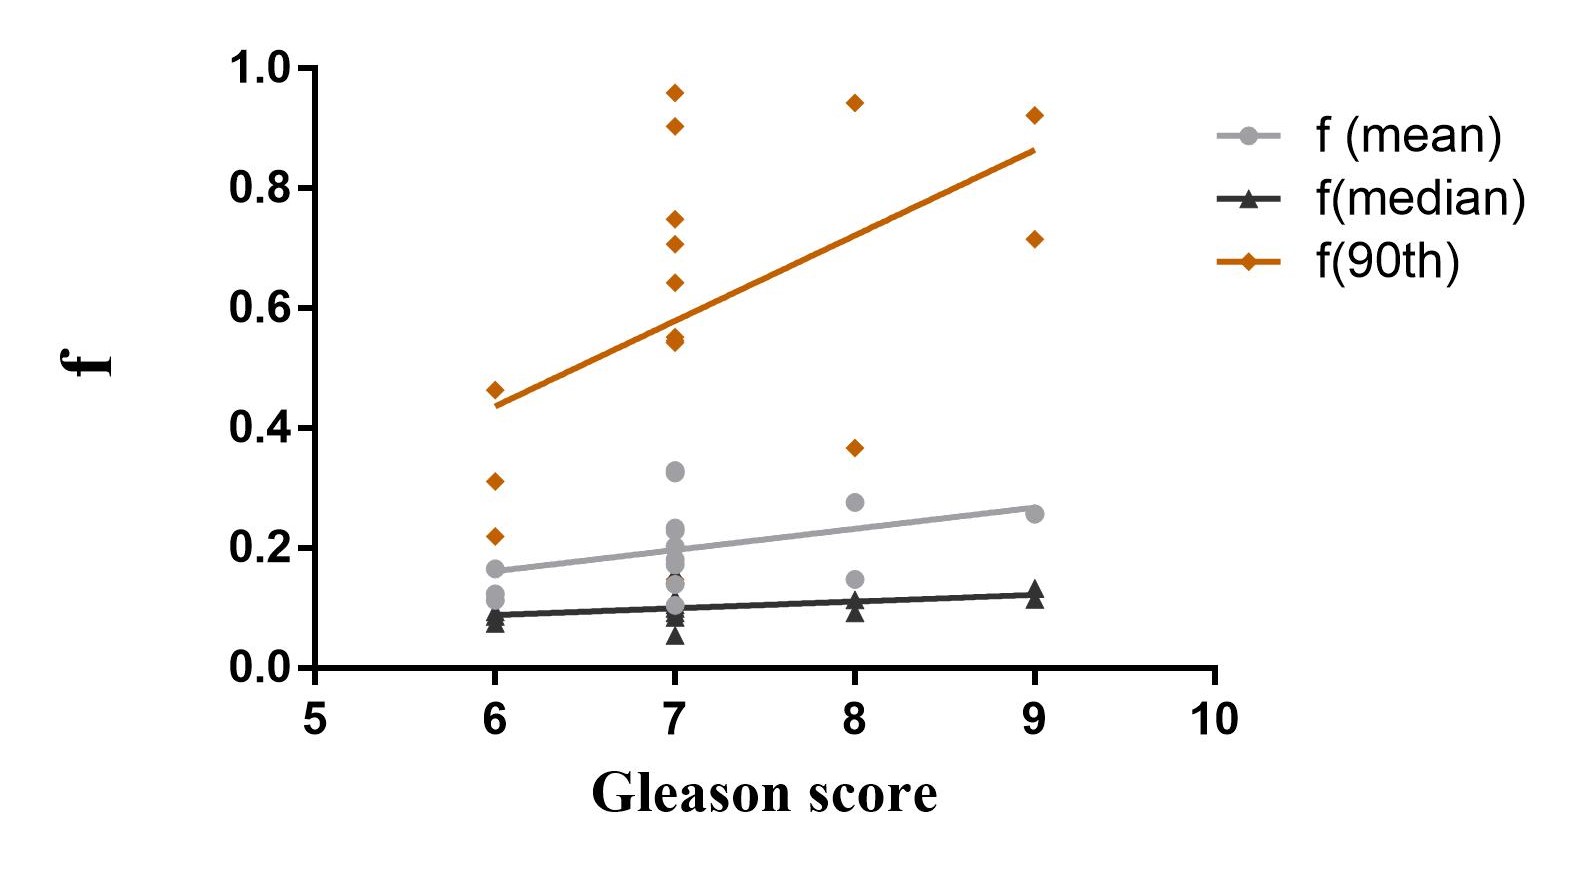
ICC of D (mean, 25th, 50th, 75th ,90th), D*(75th), f(75th, 90th), K(mean, 25th, 50th, 90th) were good (ICC=0.761~0.972, P<0.001). ICC of D (skew, kurtosis) and D* (25th, 90th, skew), f (mean, 10th, 25th,50th,skew, kurtosis), K(75th) were relative good (ICC=0.517~0.746, P≤0.001). The D values (mean, 25th, median, 75th, 90th) were significantly lower in the PCa compared to those found in the BPH/prostatitis (P<0.001, P<0.001, P<0.001, P<0.001, and P<0.001). The f (mean, 10th, 25th, median, 75th) of the PCa were lower than that of BPH/prostatitis significantly (P=0.02, P=0.008, P=0.048, P=0.019, P=0.028). The skew of D and f in PCa were also significant different from that of BPH/prostatitis (P=0.017, P=0.037)(Figure 1). The other parameters didn’t have significant differences between PCa and BPH/prostatitis. The D median and f median had the highest area under curve (AUC=0.906 and 0.781)(Figure 2). But for ROC analysis pairwise comparison, only the differences between D (10th) and D (median), D (median) and f (mean) were statistically significant (Z=2.109, P=0.0349; Z=2.103, P=0.0355). The f (mean, median, 90th), K (90th) were positively correlated with GS (P=0.041, P=0.034, P=0.033, P=0.016)(Figure 3). The D* (10th, 25th) was negatively correlated with GS (P=0.035, P=0.039).Discussion
In this study, we performed IVIM-Kurtosis model for the processing of DWI. The decline of D value in PCa compared to BPH/prostatitis, which was consistent with the previous study, may attribute to the presence of abundant fibrotic components and stromal fibroblasts or other microstructural differences in PCa[1]. We demonstrated that f was lower in PCa than BPH/prostatitis.The study of Pesapane F and Bao J didn’t find difference between PCa and BPH[2,3]. This may be due to that separation of perfusion from diffusion requires high signal-to-noise ratios, and there are some technical challenges affecting f values, such artifacts from other bulk flow phenomena[4]. Previous study reported K in malignant lesions was significantly higher than that in benign lesions[5]. However, we didn’t find the difference in this study and a possible explanation might be the different gradient directions and relatively isotropic diffusion in the prostate gland[5]. We also found that the D median and f median were excellent for differentiating PCa from BPH/prostatitis with high sensitivity and specificity. We demonstrated the correlations between f, K, D* and GS, but Zhang YD used D and ADC to stratify the pathological grade of PCa[6]. Within the PCa, tissue heterogeneity and the extracellular components, which are reflected by processing models, are highly responsible for the pathological grade.The different b values and post-processing models may lead to the stratification differences.Conclusion
IVIM-Kurtosis quantitative parameters (D and f) histogram analysis is a valuable tool for distinguishing prostate cancer from BPH/prostatitis. It may also be useful to predict the GS of prostate cancer.Acknowledgements
No acknowledgement found.References
1.Yang F, Tuxhorn JA, Ressler SJ, et al. Stromal expression of connective tissue growth factor promotes angiogenesis and prostatecancer tumorigenesis. Cancer Res. 2005;65(19):8887-95.
2. Pesapane F, Patella F, Fumarola EM, et al. Intravoxel incoherent motion (IVIM) Diffusion Weighted Imaging (DWI) in the periferic prostate cancer detection and stratification. Medical Oncology. 2017; 34(3):35.
3. Bao J, Wang X, Hu C, et al. Differentiation of prostate cancer lesions in the transition zone by diffusion-weighted MRI. European Journal of Radiology Open. 2017; 29(4):123-128.
4. Iima M, Le Bihan D. Clinical intravoxel incoherent motion and diffusion MR imaging: past, present, and future. Radiology. 2016; 278(1): 13-32.
5. Quentin M, Pentang G, Schimmöller L, et al. Feasibility of diffusional kurtosis tensor imaging in prostate MRI for the assessment of prostate cancer: preliminary results. Magn Reson Imaging. 2014;32(7):880-5.
6. Zhang YD, Wang Q, Wu CJ, et al, The histogram analysis of diffusion-weighted intravoxel incoherent motion (IVIM) imaging for differentiating the gleason grade of prostate cancer. Eur Radiol. 2015;25(4):994-1004.
Figures