3476
Whole-lesion histogram analysis of the apparent diffusion coefficient - a correlation study with histological grade of hepatocellular1Radiology, First Hospital of LanZhou University, lanzhou, China, 2First Hospital of LanZhou University, lanzhou, China, 3MR scientific marketing,Siemens healthineers,China, Lanzhou, China
Synopsis
Lately, an increasing number of studies made an effort to investigate the correlation between quantitative analysis of diffusion weighted imaging (DWI) and the histological grade of HCC. However, the optimal ADC parameter for characterization of grade of HCC has yet to be determined. Various investigators have evaluated that ADC value such as the mean ADC and minimum ADC correlate with histological grade of HCC, which were derived from single or several parts slice–based ROIs within tumors. We drew lesions on multiple slices to get more reliable estimate of lesion signal.
Synopsis
Lately, an increasing number of studies made an effort to investigate the correlation between quantitative analysis of diffusion weighted imaging (DWI) and the histological grade of HCC. However, the optimal ADC parameter for characterization of grade of HCC has yet to be determined. Various investigators have evaluated that ADC value such as the mean ADC and minimum ADC correlate with histological grade of HCC, which were derived from single or several parts slice–based ROIs within tumors. We drew lesions on multiple slices to get more reliable estimate of lesion signal.Purpose
To evaluate the relationship between histological grade of hepatocellular carcinoma (HCC) and histogram-derived parameters of apparent diffusion coefficient (ADC) obtained from whole-lesion assessment of diffusion-weighted magnetic resonance (MR) imaging in the liver, and to determine which histogram metric of ADC may help predicting histological grade of HCC.Materials and Methods
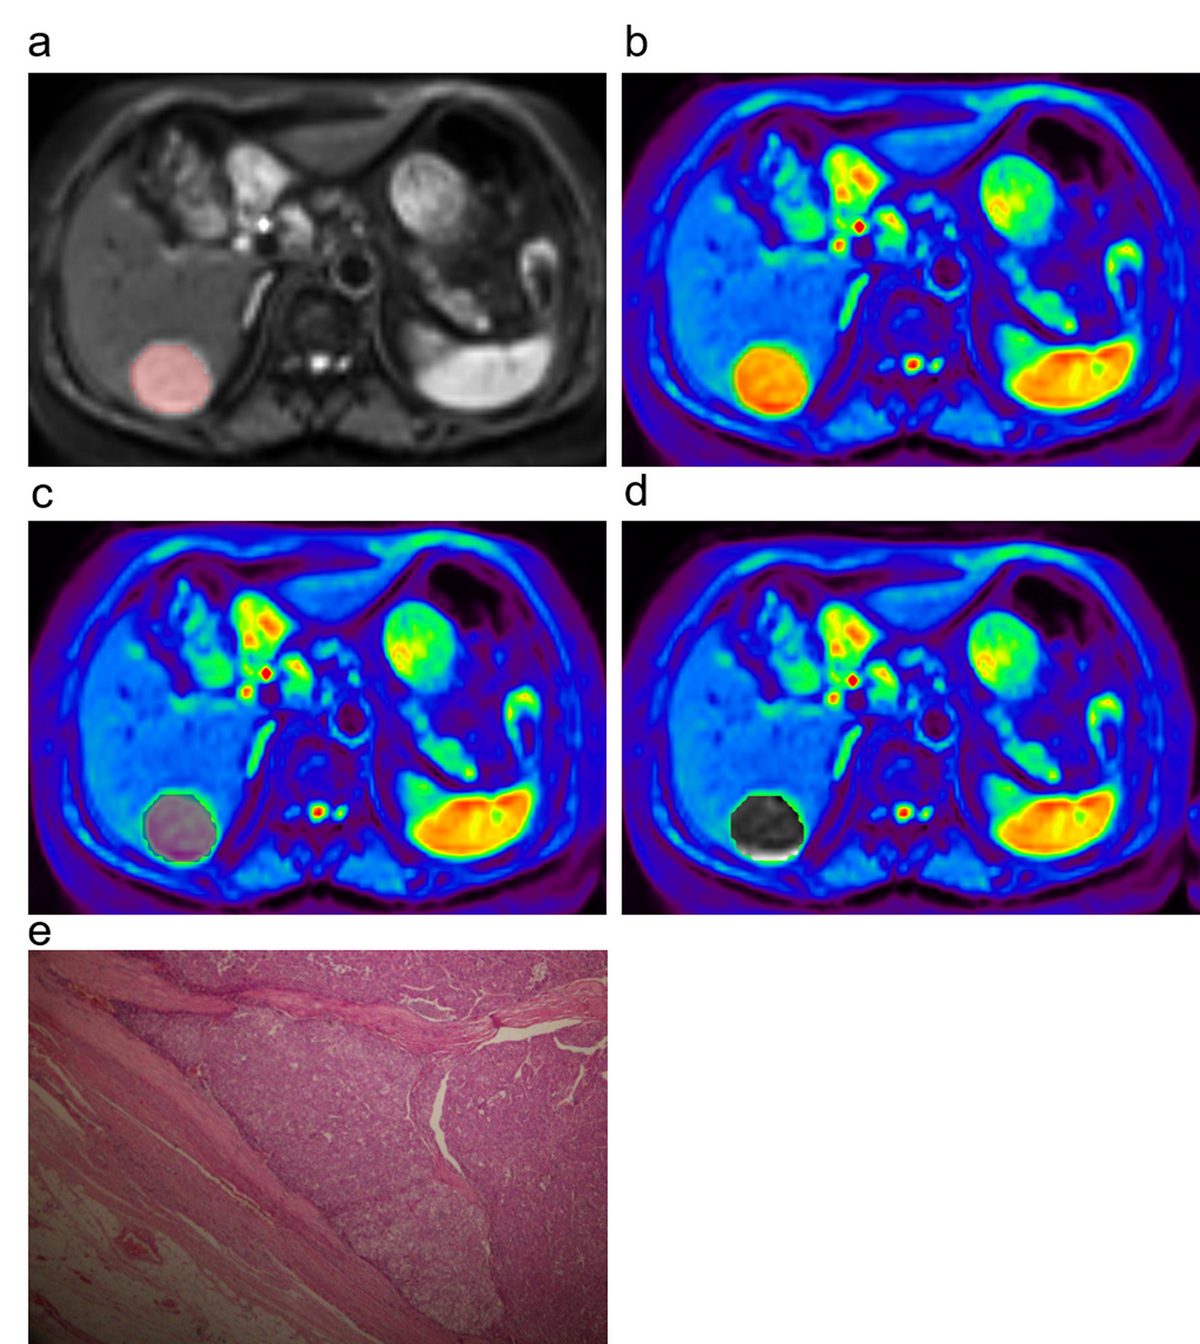
Retrospective study. 51 patients with 51 HCCs (median age, 51 years; age range, 36–76 years), with 40 men (median age, 51 years; age range, 43–79 years) and 11 women (median age, 52 years; age range 36–65 years), were included. The patients underwent preoperative diffusion-weighted MR imaging. The tumors were identified at wholemount step-section histopathologic examination, and Edmondson-Steiner grades of the tumors were recorded. Regions of interest were manually drawn on each slice of the lesions on diffusion weighted maps. The whole-lesion histogram parameters were performed using dedicated software (FireVoxel) and correlated with the Edmondson-Steiner grades by using the Spearman correlation coefficient (ρ). The differences of ADC parameters between different tumor histological grades were compared using the Mann-Whitney U test. The extent of each parameter in help differentiating tumors with poor performance (Ⅲ, Ⅳ) and fair performance (Ⅰ, Ⅱ) was assessed by using the area under the receiver operating characteristic curve (Az).Results
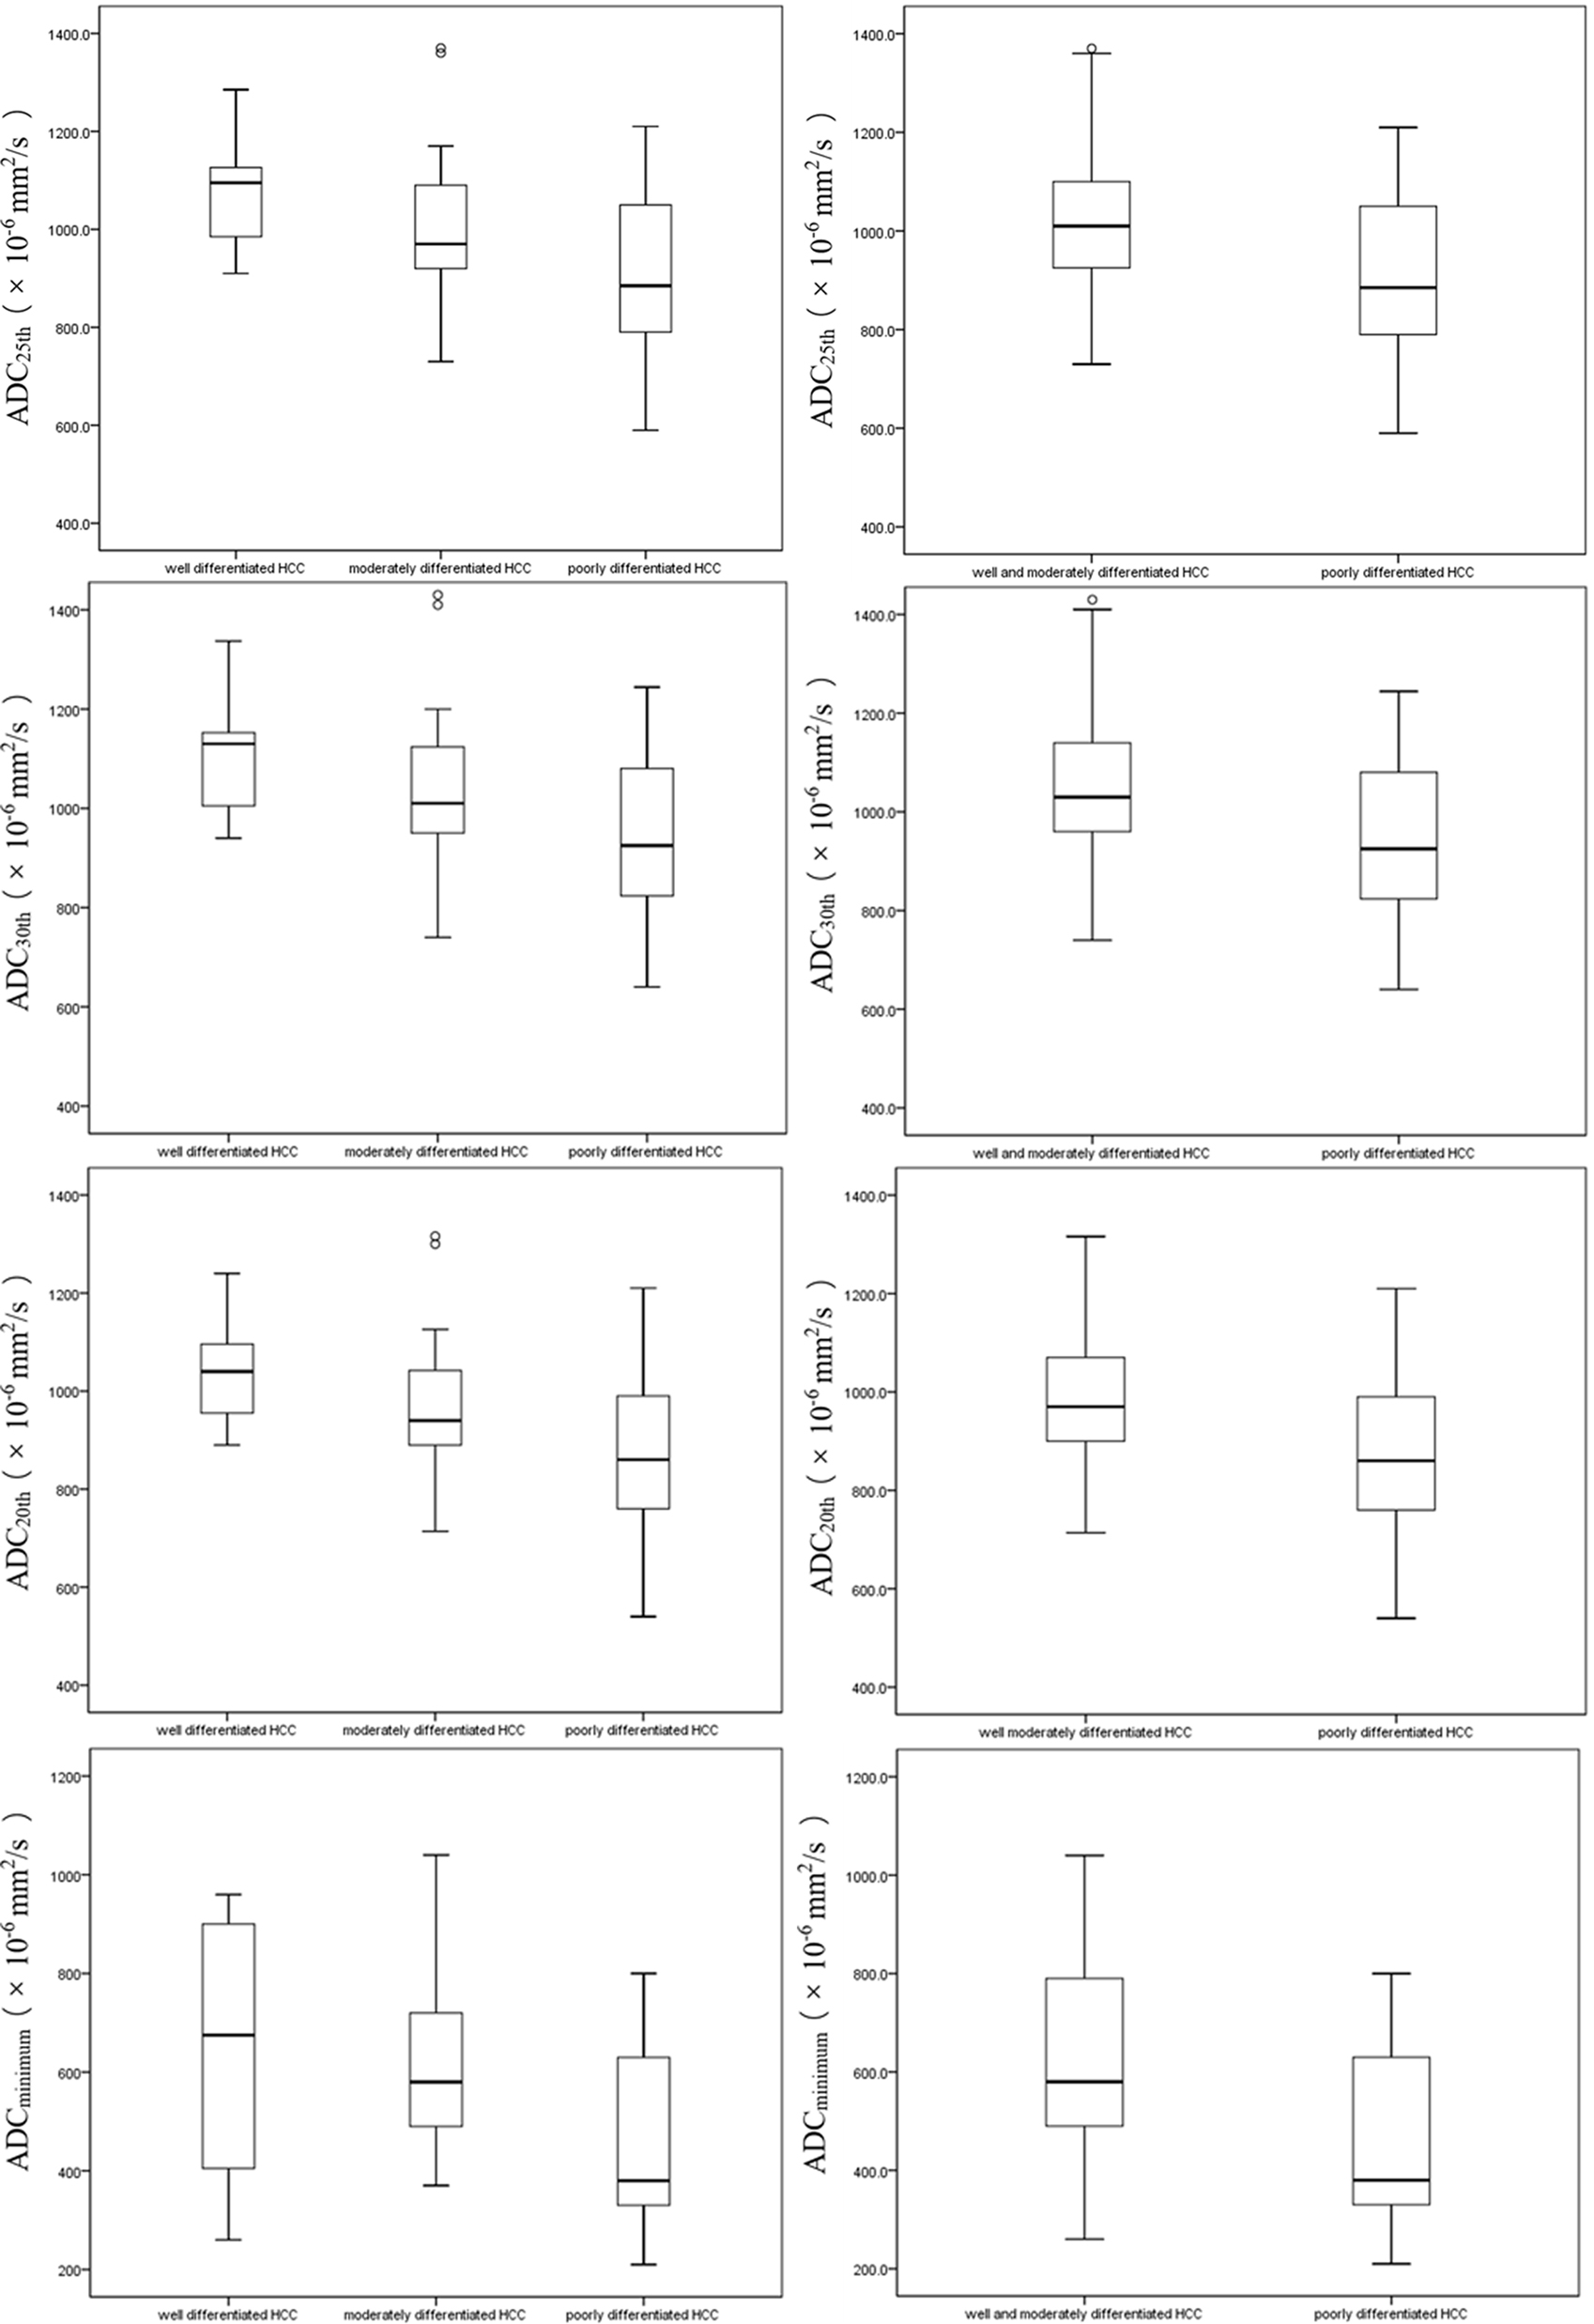
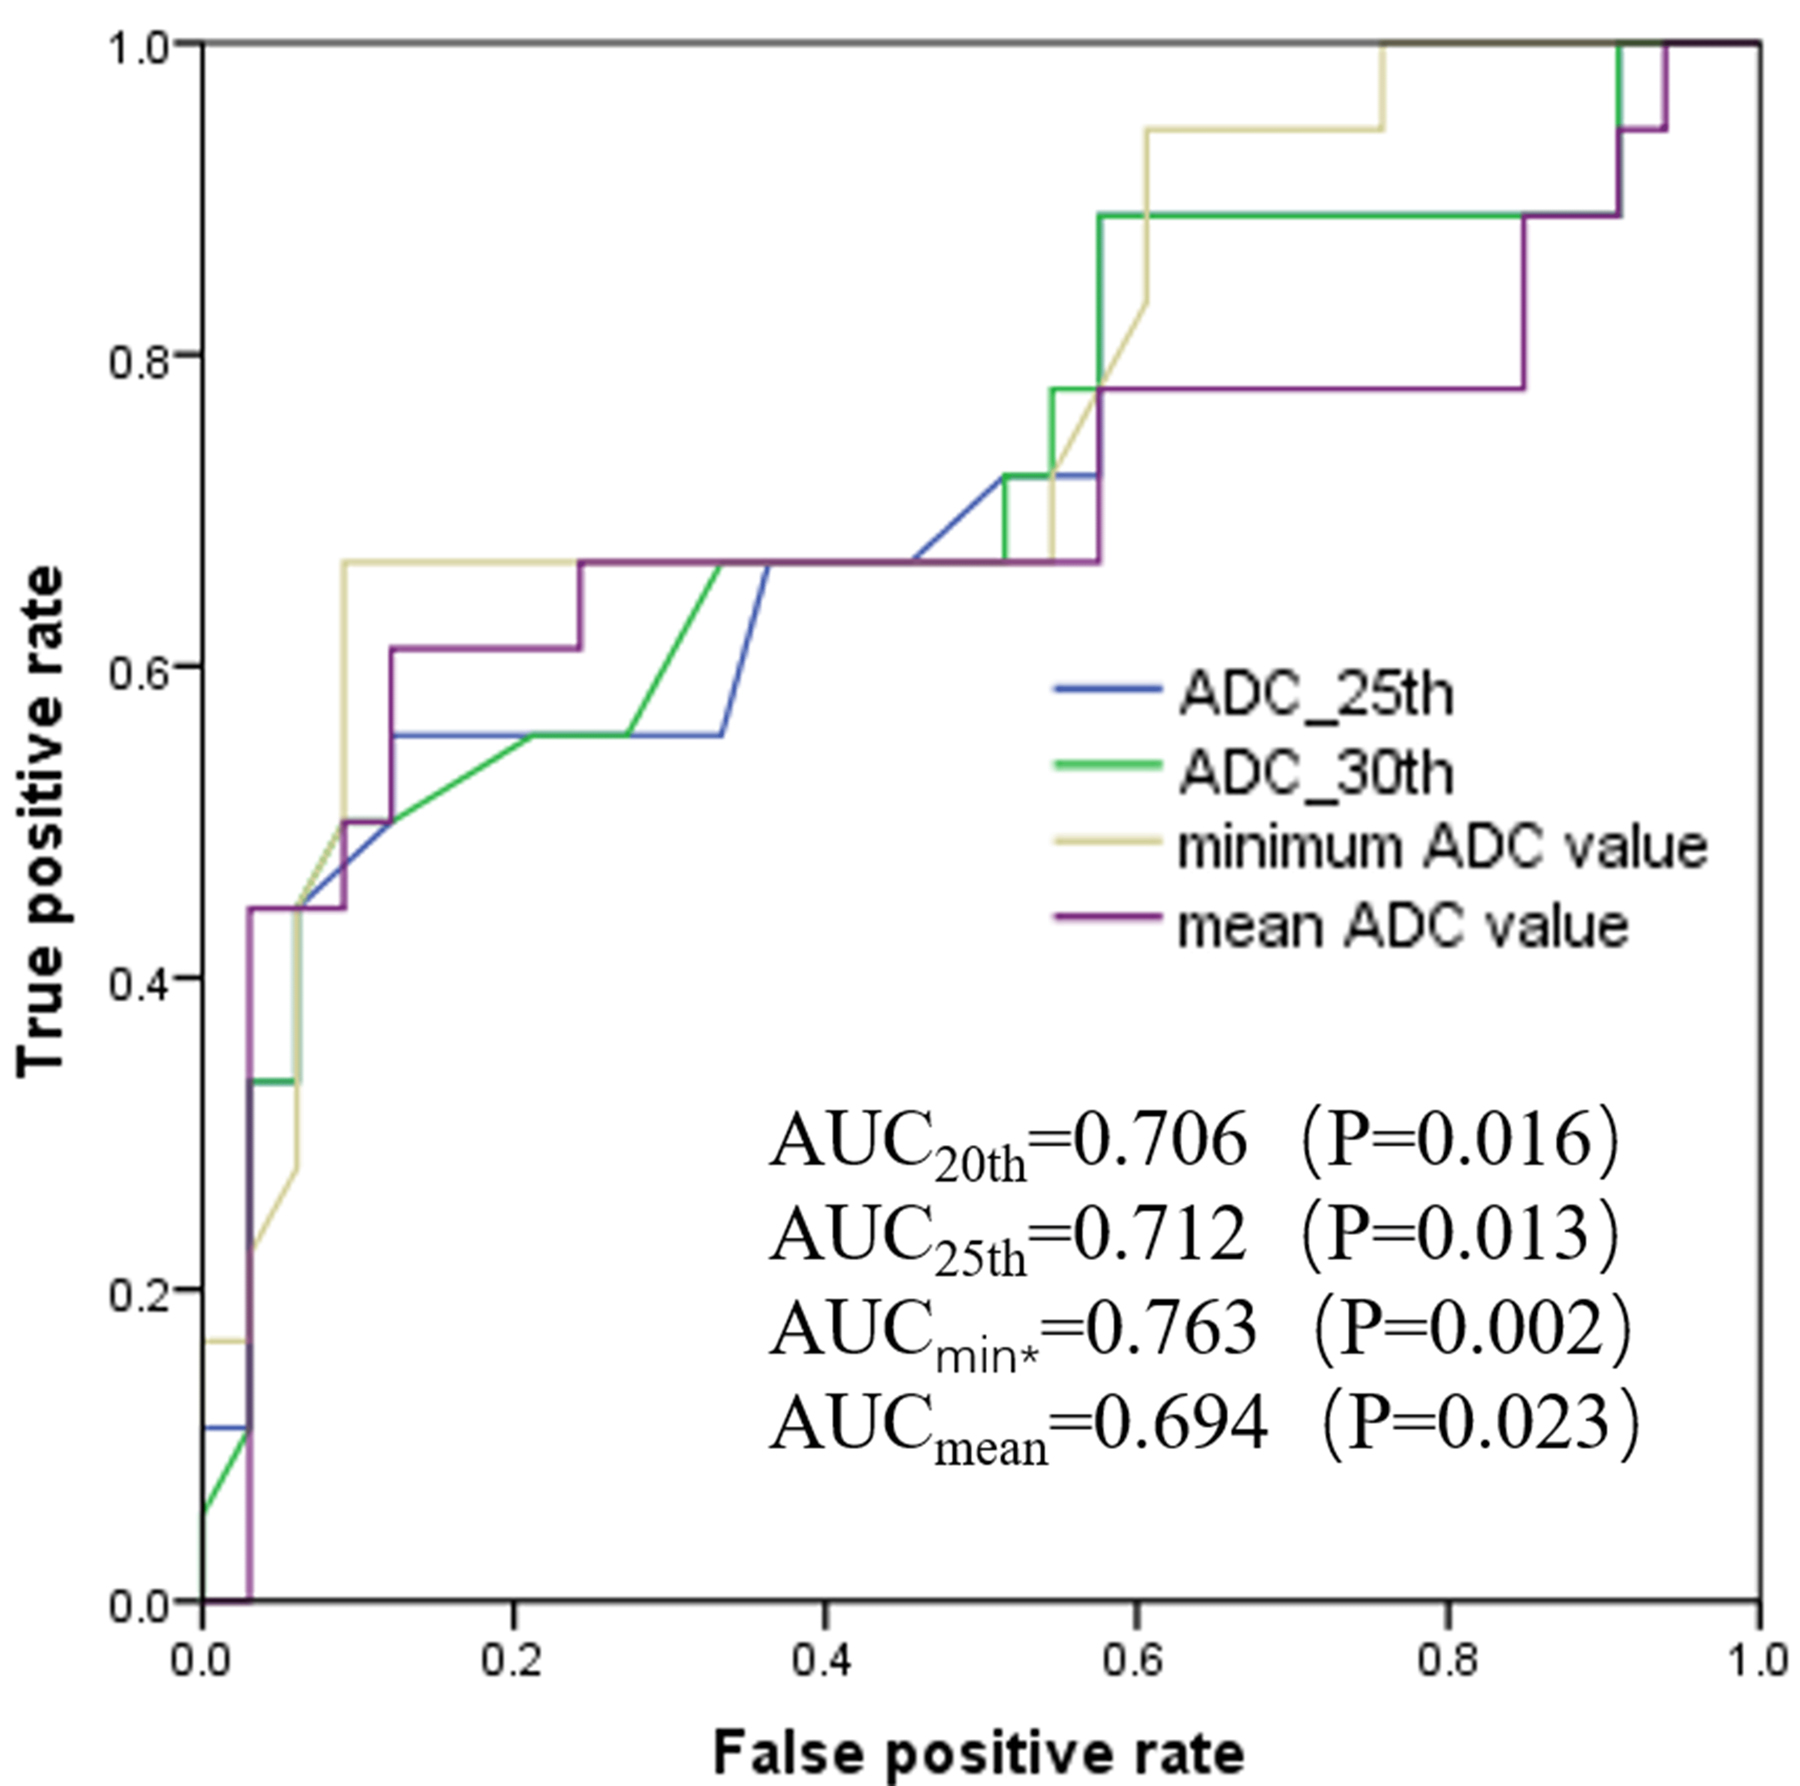
For the ADC parameters, 25th percentile ADC exhibits most negative correlation with histological grade (ρ= -0.397), followed by 30th percentile ADC (ρ= -0.395) , minimum ADC value (ρ=-0.390) and 20th percentile ADC (ρ= -0.385), whereas minimum ADC value yielded the highest Az (0.763; 95% confidence interval: 0.618-0.907) in the differentiation of tumor foci with poorly differentiated from fairly differentiated HCCs. The minimum ADC of 4.15 × 10⁻³ mm2/s or lower was considered to be poorly differentiating performance, and the corresponding sensitivity and specificity were 66.7 and 90.9%, respectively.Conclusion
In the whole-lesion histogram analysis of ADC parameters, 25th percentile of ADC showed a stronger correlation with histological grade of HCC than other ADC parameters and minimum ADC values. The findings suggest that 25th percentile of ADC might be optimal metric for differentiating poor and fair differentiations of HCC in diffusion-weighted MR imaging.Acknowledgements
This study was financially supported by Excellence Plan from First Hospital of LanZhou University, Lanzhou, Gansu Province, China. No. 20180060060 and 20180060056.References
1. Colombo M, Lleo A. The impact of antiviral therapy on hepatocellular carcinoma epidemiology. Hepatic oncology 2018;5:Hep03.
2. Altekruse SF, Henley SJ, Cucinelli JE, et al. Changing hepatocellular carcinoma incidence and liver cancer mortality rates in the United States. Am J Gastroenterol 2014;109:542-553.
3. Shindoh J, Hasegawa K, Inoue Y, et al. Risk factors of post-operative recurrence and adequate surgical approach to improve long-term outcomes of hepatocellular carcinoma. HPB (Oxford) 2013;15:31-39.
4. Edmondson HA, Steiner PE. Primary carcinoma of the liver: a study of 100 cases among 48,900 necropsies. Cancer 1954;7:462-503.
5. Zhou L, Rui JA, Zhou WX, et al. Edmondson-Steiner grade: A crucial predictor of recurrence and survival in hepatocellular carcinoma without microvascular invasio. Pathol Res Pract 2017;213:824-830. 6. Zhou L, Rui JA, Ye DX, et al. Edmondson-Steiner grading increases the predictive efficiency of TNM staging for long-term survival of patients with hepatocellular carcinoma after curative resection. World J Surg 2008;32:1748-1756.
7. Shankar S, Kalra N, Bhatia A, et al. Role of Diffusion Weighted Imaging (DWI) for Hepatocellular Carcinoma (HCC) Detection and its Grading on 3T MRI: A Prospective Study. J Clin Exp Hepatol 2016;6:303-310.
8. Jiang T, Xu JH, Zou Y, et al. Diffusion-weighted imaging (DWI) of hepatocellular carcinomas: a retrospective analysis of the correlation between qualitative and quantitative DWI and tumour grade. Clin Radiol 2017;72:465-472.
9. Li X, Zhang K, Shi Y, et al. Correlations between the minimum and mean apparent diffusion coefficient values of hepatocellular carcinoma and tumor grade. J Magn Reson Imaging 2016;44:1442-1447.
10. An C, Park MS, Jeon HM, et al. Prediction of the histopathological grade of hepatocellular carcinoma using qualitative diffusion-weighted, dynamic, and hepatobiliary phase MRI. Eur Radiol 2012;22:1701-1708.
11. Nishie A, Tajima T, Asayama Y, et al. Diagnostic performance of apparent diffusion coefficient for predicting histological grade of hepatocellular carcinoma. Eur J Radiol 2011;80:e29-33.
12. Moriya T, Saito K, Tajima Y, et al. 3D analysis of apparent diffusion coefficient histograms in hepatocellular carcinoma: correlation with histological grade. Cancer Imaging 2017;17:1. 13. Heo SH, Jeong YY, Shin SS, et al. Apparent diffusion coefficient value of diffusion-weighted imaging for hepatocellular carcinoma: correlation with the histologic differentiation and the expression of vascular endothelial growth factor. Korean J Radiol 2010;11:295-303.
14. Muhi A, Ichikawa T, Motosugi U, et al. High-b-value diffusion-weighted MR imaging of hepatocellular lesions: estimation of grade of malignancy of hepatocellular carcinoma. J Magn Reson Imaging 2009;30:1005-1011.
15. Guo W, Zhao S, Yang Y, et al. Histological grade of hepatocellular carcinoma predicted by quantitative diffusion-weighted imaging. Int J Clin Exp Med 2015;8:4164-4169.
16. Nakanishi M, Chuma M, Hige S, et al. Relationship between diffusion-weighted magnetic resonance imaging and histological tumor grading of hepatocellular carcinoma. Ann Surg Oncol 2012;19:1302-1309.
17. Chang WC, Chen RC, Chou CT, et al. Histological grade of hepatocellular carcinoma correlates with arterial enhancement on gadoxetic acid-enhanced and diffusion-weighted MR images. Abdom Imaging 2014;39:1202-1212.
18. Saito K, Moriyasu F, Sugimoto K, et al. Histological grade of differentiation of hepatocellular carcinoma: comparison of the efficacy of diffusion-weighted MRI with T2-weighted imaging and angiography-assisted CT. J Med Imaging Radiat Oncol 2012;56:261-269.
19. Nasu K, Kuroki Y, Tsukamoto T, et al. Diffusion-weighted imaging of surgically resected hepatocellular carcinoma: imaging characteristics and relationship among signal intensity, apparent diffusion coefficient, and histopathologic grade. AJR Am J Roentgenol 2009;193:438-444.
20. Donati OF, Mazaheri Y, Afaq A, et al. Prostate cancer aggressiveness: assessment with whole-lesion histogram analysis of the apparent diffusion coefficient. Radiology 2014;271:143-152.
21. Japan LCSGO. The general rules for the clinical and pathological study of primary liver cancer. Jpn J Surg 1989;19:98-129.
22. Bruegel M, Holzapfel K, Gaa J, et al. Characterization of focal liver lesions by ADC measurements using a respiratory triggered diffusion-weighted single-shot echo-planar MR imaging technique. Eur Radiol 2008;18:477-485.
23. Liau J, Lee J, Schroeder ME, et al. Cardiac motion in diffusion-weighted MRI of the liver: artifact and a method of correction. J Magn Reson Imaging 2012;35:318-327.
24. Metens T, Absil J, Denolin V, et al. Liver apparent diffusion coefficient repeatability with individually predetermined optimal cardiac timing and artifact elimination by signal filtering. J Magn Reson Imaging 2016;43:1100-1110.
25. Murtz P, Flacke S, Traber F, et al. Abdomen: diffusion-weighted MR imaging with pulse-triggered single-shot sequences. Radiology 2002;224:258-264.
Figures