3474
A Simplified Approach for Measuring Tissue ADC: Application to Prostate Diffusion Scans1Radiology, Sahlgrenska Academy, Gothenburg University, Gothenburg, Sweden, 2Radiology, Brigham and Women's Hospital, Boston, MA, United States
Synopsis
A simplified approach is presented to obtain consistent tissue ADC data, irrespective of diffusion protocol, location within field of view and MR system. Examples of application in prostate diffusion scans are presented. This could greatly facilitate the establishment of suitable cut-off values to differentiate aggressive from indolent disease in prostate cancer, but as detailed in the abstract would entail several other substantial benefits that are universally applicable to diffusion imaging in tissues.
Introduction
Due to the non-monoexponential signal decay in tissues [1], basic monoexponential ADC computation with different bmax settings yields different results (Fig. 1). There is no universally agreed upon setting for bmax, since it typically is adjusted for optimal lesion conspicuity and for optimal SNR, i.e, factors that are also influenced by field strength, echo time, voxel geometry and coil setup. Thus, unless bmax falls within a narrow range, ADC values among sites are not comparable. Another system factor, are gradient non-linearities, that bring about a diffusion encoding strength that is location dependent. Since this non-linearity is associated with a local change of bmax, tissue ADCs, unlike simple liquid diffusion, cannot readily be corrected.
Methods
We have fitted various models to high-b diffusion data sets of the prostate [2]. For each model we investigated the ability of the resulting fitting parameters to differentiate suspected tumor areas from normal tissue and how they correlate with Gleason score. We observed that once parameters of a model are linearly combined, all models, including the mono-exponential model exhibited the same ability for differentiation. Moreover, for the kurtosis model with $$$S = S_0 · \exp(−bADC_K + b^2ADC_K^2K/6)$$$ [3], ADCK or the kurtosis parameter K alone permitted equally good differentiation, which is explained by the high covariance of the parameters (see Figs. 2 and 3).
Jensen et al [4] have analyzed the behavior of the kurtosis model for different diffusion scenarios. In particular, they analyzed a one-dimensional model with barriers for short diffusion times. Rearrangement of the formulas given in [4] shows that $$$K = (1 − ADC_K/ADC_f ) · 6/5$$$, where ADCf is the diffusion coefficient of free diffusing water. Thus kurtosis K depends linearly on ADCK, and reaches 6/5 for completely restricted diffusion, where ADCK=0 and 0 for ADCK=ADCf , i.e., 3 μm2/ms at 37 C.
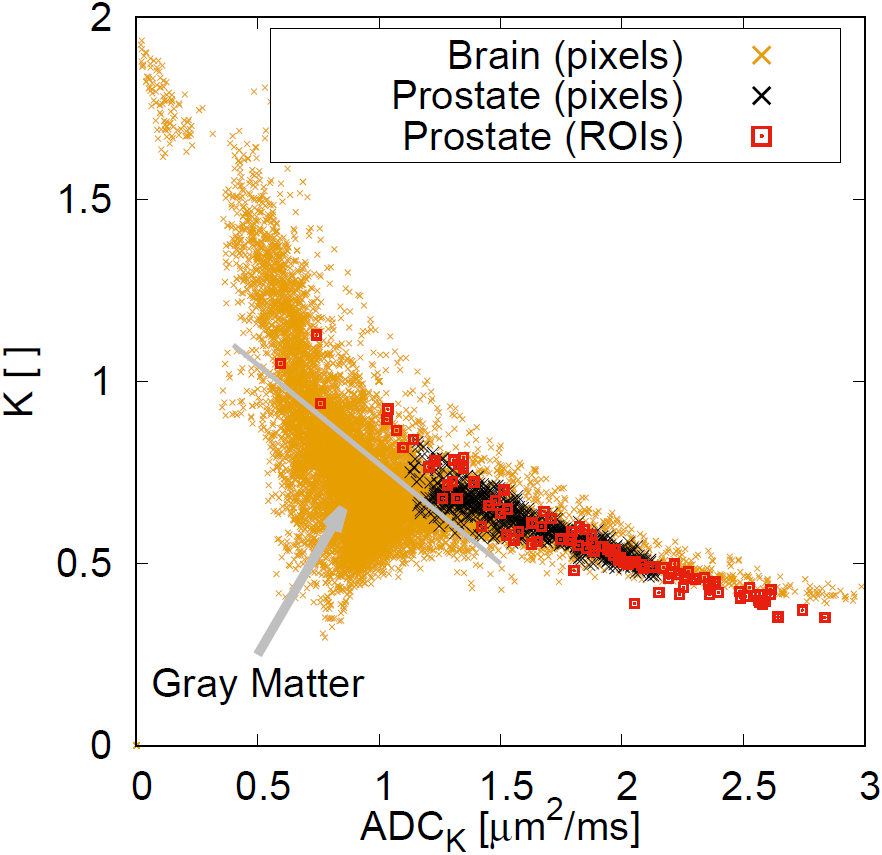
The fact that ADCK and K are highly correlated, opens up the possibility to only measure one value and then compute the other value with a known and preferably standardized correlation function. It can be assumed that this correlation holds as long as diffusion times are not too long and complete exchange occurs, in which case K would tend towards zero, a scenario not supported by our data. It also holds as long as that we do not study tissues with micro-anisotropy [5], such as gray matter (see Fig. 3). But the assumption of correlation is probably valid for all abdominal tissues, most tumor tissues, and even white matter.
The proposed approach was tested in data obtained during multi-parametric prostate MR exams at 3 Tesla. An endo-rectal coil was used to obtain echo-planar diffusion-weighted images for 15 evenly spaced b-factors between 0 and 3500 s/mm2. A quadratic correlation function between K and ADCK was obtained with existing ROI data [2] through non-linear fitting and subsequently applied to subsets of the multi-b data.
Results
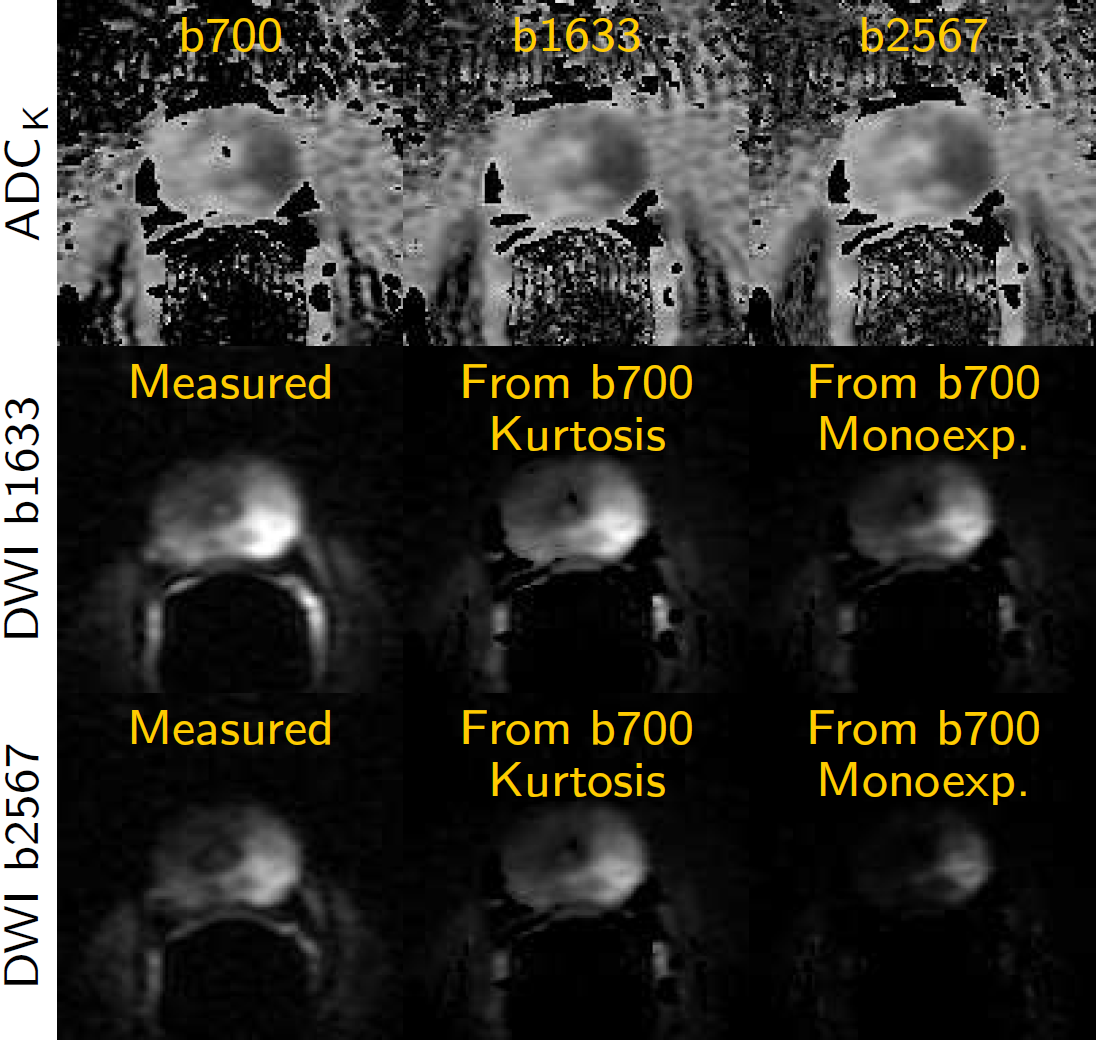
Examples of single-parameter fits using the prior of the correlation function between K and ADCK and the conventional monoexponential approach are presented in Fig 4.Discussion
As we take this knowledge into account for the fitting process, major advantages arise; (i) if we ex-clude the range of IVIM perfusion (<150 s/mm2), the correlated kurtosis model is applicable to both low and high b data. (ii) Low b data can correctly be extrapolated to higher b-factors for optimal lesion conspicuity. (iii) ADCK is largely b-factor range independent, which makes the parameter fully transparent and comparable among protocols. (iv) System-specific gradient non-linearities, which result in spatially variable b-factors can be fully corrected and will not falsify ADCK results in tissues. (v) The measured ADCK is equal to the conventional ADC for low b-factors (<700 s/mm2). (vi) The model yields non-monoexponential decays even if only two b-factors were measured, e.g., b=150 and 1000 s/mm2. (vii) For IVIM studies, the correct non-monoexponential model can be used even with only two b-factors, which takes out the guesswork at which b-factor tissue diffusion should be measured. (viii) Unlike the regular kurtosis model with two unknown parameters ADCK and K, the correlated kurtosis model requires the estimation of only one parameter, i.e., ADCK, which therefore is much more stable and, consequently, resulting maps are not more noisy than mono-exponential ADC maps. In other words, it is only with the correlated model that all these benefits arise or become practical.Conclusion
Our preliminary results indicate that the approach is robust and practical. Further investigation is needed to establish a correlation function for wide spread use. In particular the effect of noise and potential connection with non-zero K values at ADCK approaching free water diffusion (Fig. 3) needs to be investigated and properly handled with a suitable fitting algorithm.Acknowledgements
ALFGBG-449801, CAN2017/558, NIH R01 CA160902References
1) Mulkern RV, Barnes AS, Haker SJ, Hung YP, Rybicki FJ, Maier SE, Tempany CM. Biexponential characterization of prostate tissue water diffusion decay curves over an extended b-factor range. Magn Reson Imaging. 2006;24(5):563–8.
2) Langkilde F, Kobus T, Fedorov A, Dunne R, Tempany C, Mulkern RV, Maier SE.Evaluation of fitting models for prostate tissue characterization using extended-range b-factor diffusion-weighted imaging. Magn Reson Med. 2018;79(4):2346–2358.
3) Jensen JH, Helpern JA, Ramani A, Lu H, Kaczynski K. Diffusional kurtosis imaging: the quantification of non-Gaussian water diffusion by means of magnetic resonance imaging. Magn. Reson. Med. 2005;53: 1432–1440.
4) Jensen JH and Helpern JA. MRI quantification of non-Gaussian water diffusion by kurtosis analysis. NMR Biomed. 2010; 23: 698–710.
5) Szczepankiewicz F, Lasic S, van Westen D, Sundgren PC, Englund E, Westin CF , Stalberg F, Latt J, Topgaard D, and Nilsson M. Quantification of microscopic diffusion anisotropy disentangles effects of orientation dispersion from microstructure: applications in healthy volunteers and in brain tumors. Neuroimage, 104:241–52, 2015.
6) Kitajima K, Kaji Y, Kuroda K, and Sugimura K. High b-value diffusion-weighted imaging in normal and malignant peripheral zone tissue of the prostate: effect of signal-to-noise ratio. Magn Reson Med Sci, 7(2):93–9, 2008.
7) Kim CK, Park BK, and Kim B. High-b-value diffusion-weighted imaging at 3 T to detect prostate cancer: comparisons between b values of 1,000 and 2,000 s/mm2. Am J Roentgenol, 194(1):W33–7, 2010.
Figures
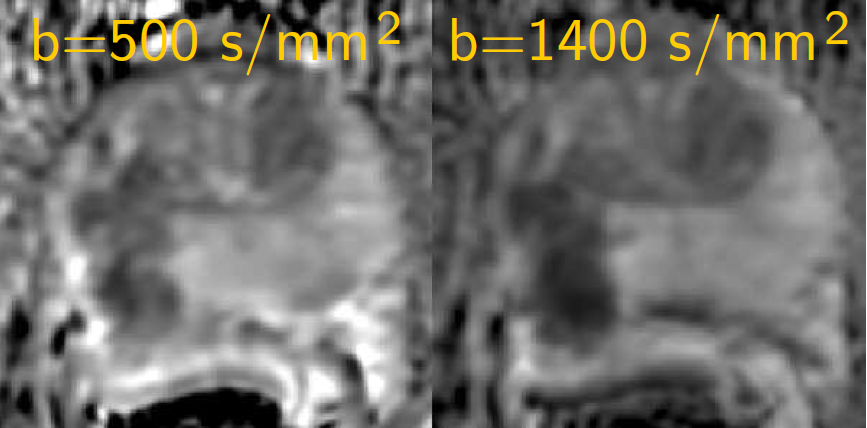
ADC maps of prostate diffusion scans obtained with an endo-rectal coil. The ADCs computed from different diffusion scans with non-identical bmax look different. This precludes a meaningful comparison among protocols and systems. Also, recommendations for suitable cut-off values to differentiate aggressive from indolent disease in prostate cancer cannot be established.
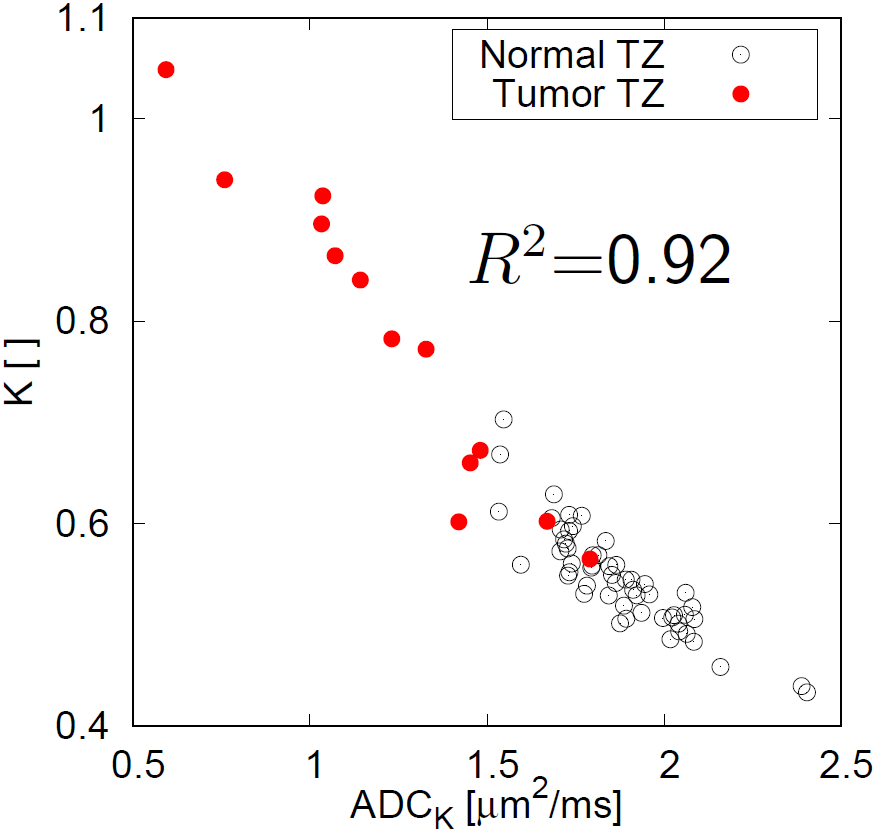
Kurtosis K vs kurtosis diffusion coefficient ADCK, as plotted here for 40 ROI measurements from prostate transition zones (TZ) of 27 patients, are highly correlated [2].