3472
Differential diagnosis of pathologic grade of hepatocellular carcinoma (HCC) using whole-tumor histogram and texture analysis based on apparent diffusion coefficient (ADC) map1The First Affiliated Hospital of Dalian Medical University, Dalian, China
Synopsis
This work aimed for ADC histogram and texture features based strategy to identify poorly differentiated hepatocellular carcinoma (HCC) which may own a high risk of recurrence or metastasis. The results showed that ADC histogram and texture features can discriminate HCC grade. The 95th percentile achieved the best result (AUC: 0.772; sensitivity: 90%; specificity: 72%) on ADC signal intensity map, forming a valuable strategy for clinical practice.
Purpose
Introduction
Hepatocellular carcinoma (HCC) is the most common type of primary hepatic cancer. The histological grade of HCC is a major contributing factor to recurrence after surgery, and poorly differentiation of HCC would be a risk factor for tumor seeding or intrahepatic dissemination after treatment delivery1. Thus, accurate grading of HCC is vital for describe tumors’ biological behavior for prognosis and clinical decision. Some studies have already reported about the diagnosis of tumor histological grade using the apparent diffusion coefficient (ADC)2,3. When the ROI is set on a slice of the entire tumor, the measured ADC is represented only on the selected slice. Three-dimension regions of interest (ROI) set across the entire lesion can lead to a more accurate diagnosis4. MR histogram and texture analysis can quantify the distribution of signal intensity of voxels within the tumor to reflect tumor heterogeneity. Therefore, ADC-based histogram and texture analysis was introduced in the present study to evaluate its clinical application performance on HCC grade.Materials and Methods
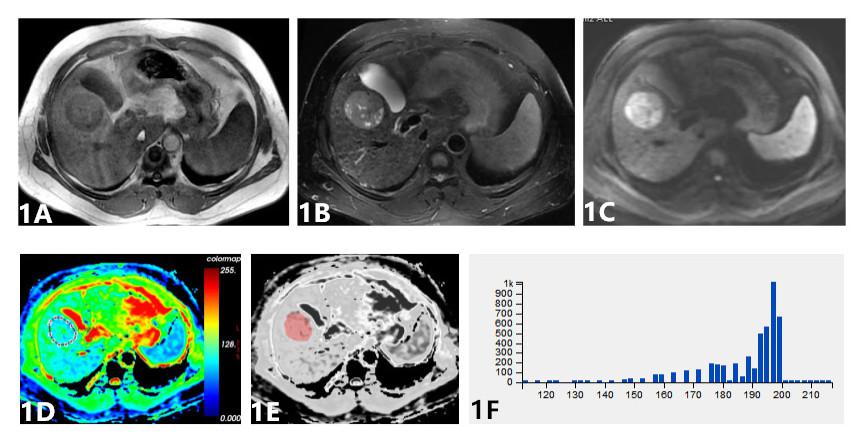
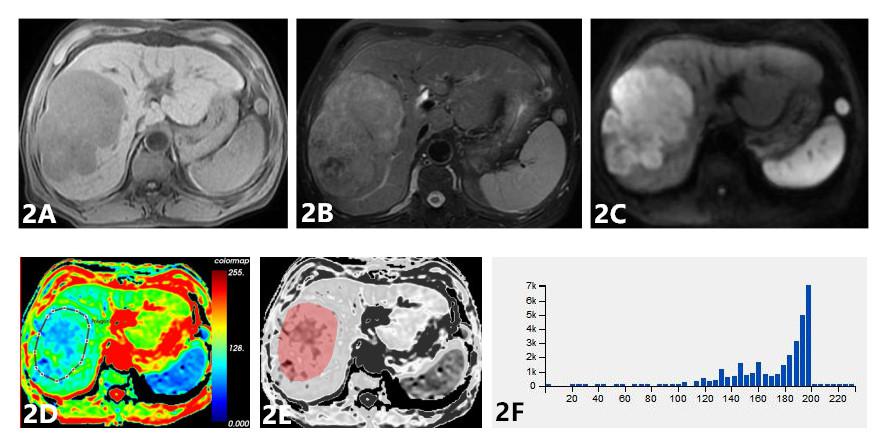
Twenty-five well & moderately differentiated HCCs (group A) and Eighteen poorly differentiated HCCs (group B) underwent conventional MR and DWI-MR examinations from January 2014 to March 2017 were enrolled from histopathology database. All scannings were performed on a 1.5T MR (GE-Signa HDXT) with routine T1WI, T2WI and DWI ( b value=0, 600 s/mm2 ). ADC maps were derived from Functool software on the GE AW4.6 workstation and then transferred to Omni-Kinetics software (GE Healthcare). Histogram and texture features based on ADC signal intensity map, including minimum, maximum, median, mean, standard deviation, variance, skewness, kurtosis, uniformity, percentiles (5th, 10th, 25th, 50th, 75th, 90th and 95th), inertia and correlation were generated automatically after 3D Regions of interest (ROIs) which covered the whole tumor were sketched by readers. All the statistical analysis was conducted with SPSS 22.0 software. Nonparametric Wilcoxon test was used to compare the difference between the two groups, and receiver operating characteristic (ROC) curves were plotted to assess diagnostic efficiency of them.Results
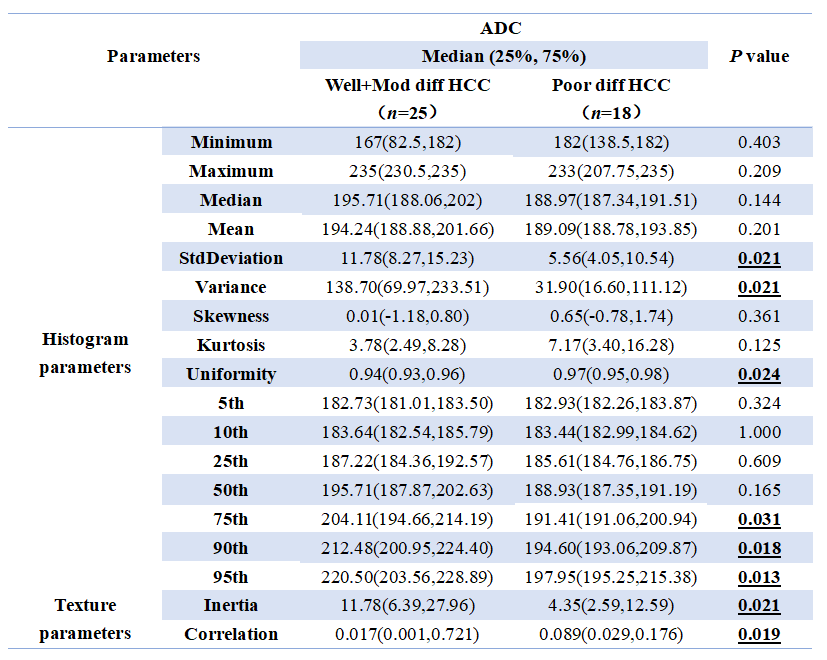
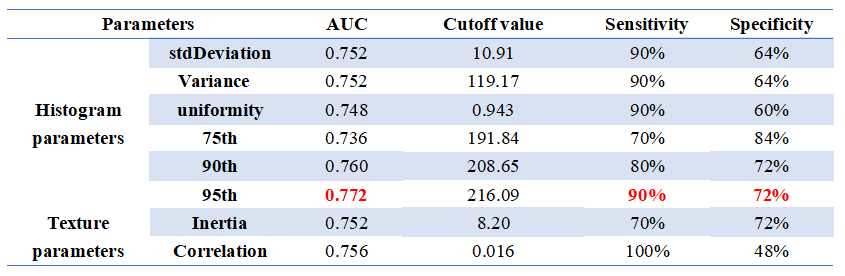
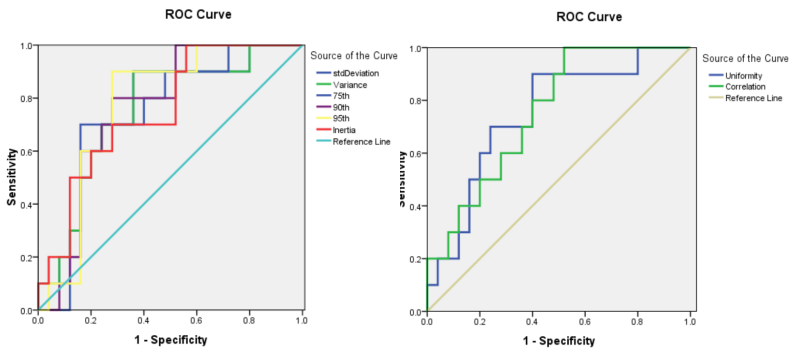
The standard deviation, variance, 75th, 90th, 95th percentile and inertia of ADC signal intensity of group A were higher than those of group B (P<0.05), while uniformity and correlation of group A were lower than those of group B (P<0.05) (Table 1). The area under ROC curve (AUC) of standard deviation, variance, uniformity, 75th, 90th, 95th percentile, inertia and correlation of ADC signal intensity were 0.752, 0.752, 0.748, 0.736, 0.760, 0.772, 0.752 and 0.756, respectively. Results indicated that 95th percentile (AUC: 0.772, sensitivity: 90%, specificity: 72% on ADC signal intensity (Table 2).Discussion
The ADC histogram and texture based strategy is useful to distinguish poorly differentiated HCC from well and moderately differentiated HCC, and the 95th percentile ADC has shown the best diagnostic performance in grading HCC. The 95th percentile ADC in poorly differentiated HCC was lower compared to well and moderately differentiated HCC. As tumor histological grade increases, the cellularity of the tumor usually increases. This leads to restricted diffusion.
Conclusion
Whole-tumor histogram and texture analysis of ADC can supply mutiple-parameter method for differentiating well & moderately differentiated HCC and poorly differentiated HCC.Acknowledgements
No acknowledgement found.References
[1] Nakanishi M, Chuma M, Hige S, et al. Relationship between diffusion-weighted magnetic resonance imaging and histological tumor grading of hepatocellular carcinoma. Ann Surg Oncol. 2012;19:1302-1309.
[2] Suo ST, Chen XX, Fan Y, et al. Histogram analysis of apparent diffusion coefficient at 3.0 T in urinary bladder lesions: correlation with pathologic findings. Acad Radiol, 2014, 21(8): 1027-1034.
[3] Woo S, Cho JY, Kim SY, et al. Histogram analysis of apparent diffusion coefficient map of diffusion-weighted MRI in endometrial cancer: a preliminary correlation study with histological grade. Acta Radiol, 2014, 55(10): 1270-1277.
[4] Moriya T, Saito K, Tajima Y, et al. 3D analysis of apparent diffusion coefficient histograms in hepatocellular carcinoma: correlation with histological grade. Cancer Imaging, 2017, 17(1): 1.
Figures