3469
Optimal subsampling of q-space for Mean Apparent Propagator MRI using a genetic algorithm1Department of Neurosurgery, Medical College of Wisconsins, Milwaukee, WI, United States, 2Center for Imaging Research, Medical College of Wisconsin, Milwaukee, WI, United States, 3Department of Biophysics, Medical College of Wisconsin, Milwaukee, WI, United States, 4Department of Radiology, Medical College of Wisconsin, Milwaukee, WI, United States
Synopsis
Mean Apparent Propagator (MAP) MRI provides a robust analytical framework to estimate the diffusion probability density function (PDF). Several scalar metrics are calculated from the PDF, which might better characterize tissue microstructure compared to conventional diffusion methods. The downside of MAP MRI is the long acquisition times of over an hour. In this study we developed a genetic algorithm (GA) to determine optimal q-space subsampling scheme for MAP MRI that will keep total scan time under 10 minutes, while preserving accuracy. Results show that the metrics derived from the optimized schemes match those from the full set closely.
Introduction:
Mean Apparent Propagator (MAP) MRI provides a robust analytical framework to estimate the diffusion probability density function (PDF). Zero-displacement and non-Gaussianity metrics are calculated from the PDF, which might better characterize tissue microstructure compared to DTI or Diffusion Kurtosis. The downside of MAP MRI is the long acquisition times (70min or more). The original MAP acquisition was performed ex vivo, using seven b-values up to 9800s/mm2 with a total of 489 directions1. Avram et al2 proposed a 10-minute scan with a heuristically-derived q-space subsampling scheme, with 93 directions and b-values up to 6000s/mm2. However, this subsampling scheme was not optimized systematically to preserve the accuracy of the metrics. In this study we developed a genetic algorithm (GA) to determine optimal q-space subsampling scheme for MAP MRI that will keep total scan time under 10 minutes. Results show that the metrics derived from the optimized schemes match those from the full set more closely, compared to the heuristic subsampling.Methods:
A MAP data was acquired from a healthy volunteer (male, 26YO) and used for optimization. The study was approved by the IRB, and written informed consents were obtained. The data was acquired with b = {1000, 2000, 3000, 4000, 5000, 6000} s/mm2 along 19, 32, 56, 87, 125, and 170 directions, respectively. Single-shot SE-EPI was used to acquire 20 slices with 2.2 x 2.2 x 2mm3 voxel resolution (TE=86.8ms, TR=4200ms).
MAP model fitting was performed using DIPy3. Two separate GA optimizations were performed for return-to-origin probability (RTOP) and non-Gaussianity (NG). The resulting sampling schemes are denoted GARTOP and GANG. Diffusion signals from 400 randomly selected voxels in the white matter were used for optimization. 400 voxels were considered to be sufficient for this purpose4. There were 200 individuals in each population for the GA, which consisted of 95 b-vectors chosen from the full set. This corresponds to approximately a 10-minute acquisition. A population size of 200 provided sufficient diversity to sample solution space5. The GA evaluation function was the mean squared error (MSE) with respect to the RTOP or NG calculations from the full set. Selection was fitness-proportionate with Stochastic Uniform Sampling, as well as sigma scaling to maintain selection pressure. Uniform crossover was used to increase mixing. Elite survival rate, crossover rate, and mutation rate were 0.02, 0.8, and 0.01, respectively.
For comparison, the reduced sampling scheme proposed by Avram et al2 was also emulated. The required b-vectors were subsampled from the full set to include the same number of directions per shell as proposed.
Initial validations were performed using 1000 voxels in the white matter that were not used in optimization. For each of the reduced sampling schemes, MSE of the MAP metrics with respect to full sampling were computed. A second data set was acquired from a healthy volunteer (female, 26YO) for independent validation and generalizability of the optimal sampling schemes.
Results:
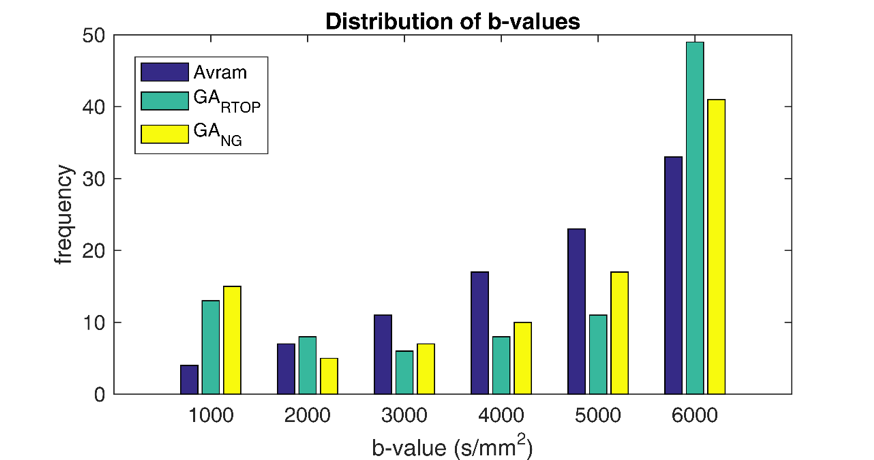
Both GARTOP and GANG schemes required more samples from the b = 1000 and 6000 s/mm2 shells and fewer directions on the middle shells as opposed to the monotonically increasing directions in Avram’s scheme (Fig.1). This finding suggests that preserving more samples on the innermost and outermost shells are important for accuracy of MAP metrics.
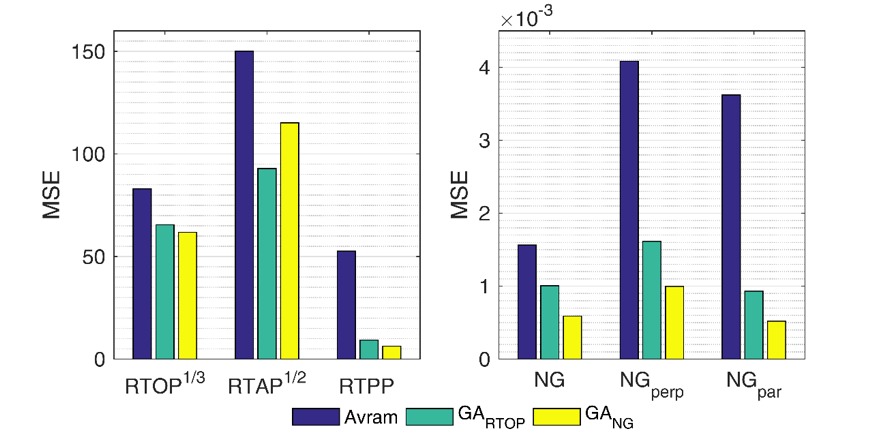
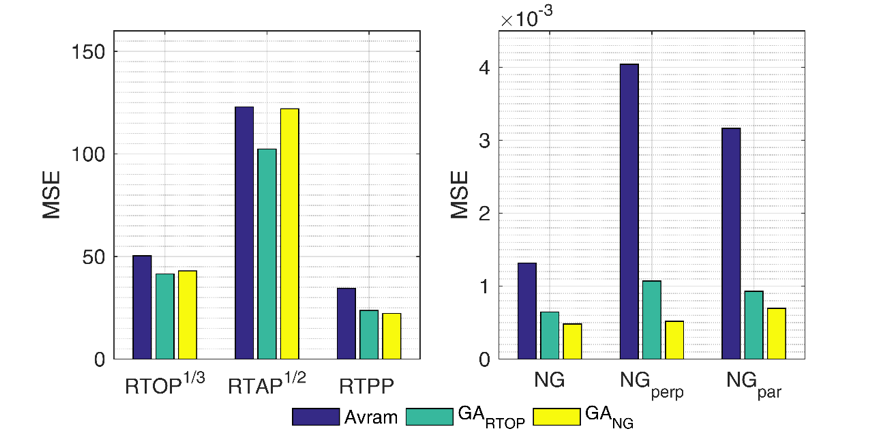
Initial validation with the first data showed that both GA schemes reduced the MSE for all MAP metrics compared to the Avram scheme (Fig.2). GANG marginally outperformed GARTOP in RTOP1/3 and had the best performance for every non-Gaussianity metric. The results from the second experiment were similar to those of the first subject, which suggests generalizability of the optimized schemes (Fig.3). The non-Gaussianity metrics from the optimized sampling schemes were much closer to those of the full set. Improvements in RTOP1/3, RTAP1/2 and RTPP were more modest.
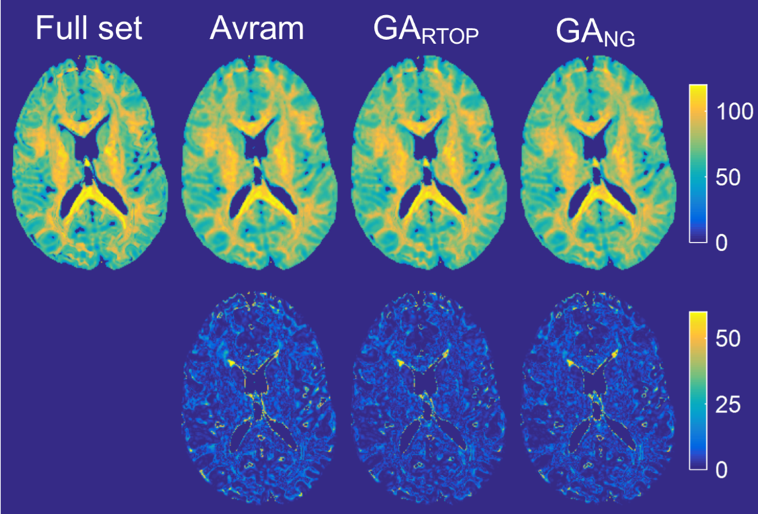
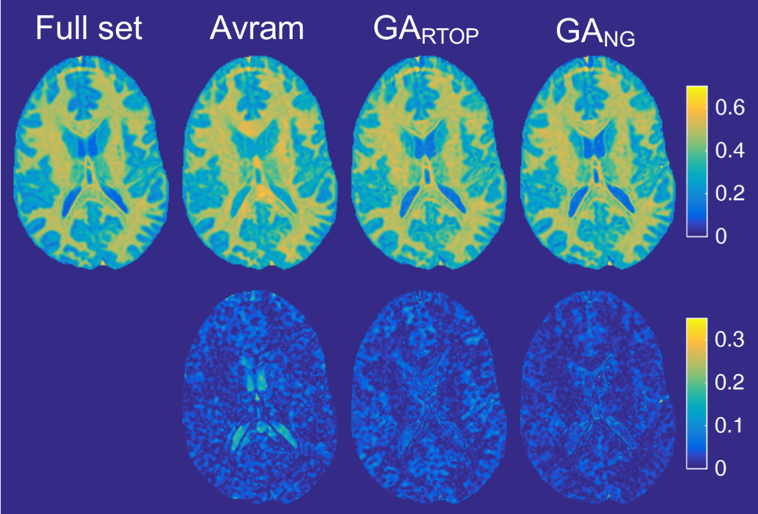
Qualitatively, each of the reduced sampling schemes produced sufficiently accurate RTOP1/3 estimates (Fig.4). Slight improvement can be seen in the white matter with the GA sampling schemes. The GANG scheme most closely replicated the NG of the full set (Fig.5). GARTOP was relatively accurate in the white matter but slightly overestimated the gray matter NG. Overall, both GARTOP and GANG performed better in highly organized fibers such as the splenium and genu, producing values much closer to the full set.
Discussion:
The genetic algorithm determined two q-space sampling schemes, which produced MAP metrics that closely matched those from the full set. The data is acquired in a fraction of the time needed for the full acquisition. This optimization approach can be easily adapted to other diffusion MRI models that require a large number of diffusion-encoding vectors.Acknowledgements
This work is supported in part by funding provided by the Daniel M. Soref Charitable Trust.References
1. Özarslan E, Koay CG, Shepherd TM, et al. Mean apparent propagator (MAP) MRI: A novel diffusion imaging method for mapping tissue microstructure. NeuroImage 2013;78:16–32.
2. Avram AV, Sarlls JE, Barnett AS, et al. Clinical feasibility of using mean apparent propagator (MAP) MRI to characterize brain tissue microstructure. NeuroImage 2016;127:422–34.
3. Garyfallidis E, Brett M, Amirbekian B, Rokem A, van der Walt S, Descoteaux M, et al. Dipy, a library for the analysis of diffusion MRI data. Front Neuroinformatics 2014;8:8.
4. Poot DHJ, den Dekker AJ, Achten E, Verhoye M, Sijbers J. Optimal experimental design for diffusion kurtosis imaging. IEEE Trans Med Imaging 2010;29:819–29.
5. Diaz-Gomez PA, Hougen D. Initial population for genetic algorithms: A metric approach. Proc. 2007 Int. Conf. Genet. Evol. Methods, Las Vegas, NV: 2007, p. 43–9.
Figures