3466
Diffusion kurtosis imaging as an effective predictor of liver function1Department of Medical Technology, Tokyo Women's Medical University Yachiyo Medical Center, Yachiyo, Japan, 2Department of Radiological Technology, Tokushima Bunri University Faculty of Health and Welfare, Sanuki, Japan, 3Department of Radiological Service, The University of Tokyo Hospital, Hongo, Japan, 4Division of Health Sciences, Graduate School of Medical Science, Kanazawa University, Kanazawa, Japan
Synopsis
We evaluated whether DKI analysis as an indicator of liver function can replace laboratory tests. The mean kurtosis value was found to correlate with the Child–Pugh score and the ICG score. However, the correlation between the mean kurtosis valueand the ALBI score was the poorest among these. ADC values correlated with only the ICG score. The mean kurtosis value can be one of predictors for liver function owing to its correlation with typical indicators of liver function by serum data although this method, which shows liver function using DKI alone, cannot completely substitute the laboratory tests.
INTRODUCTION
Currently, liver function is evaluated using various blood parameters, such as serum albumin and serum bilirubin levels, or biochemical classifications, such as Child–Pugh and ALBI scores. However, it is impossible to evaluate focal liver disorders using such blood parameters because the results indicate the function of the entire liver. In particular, a specific part of the liver that has impaired function cannot be evaluated.In a previous study, MR elastography has been reported to provide the highest performance for advanced fibrosis detection[1]. However, MR elastography has the disadvantage that it requires dedicated hardware and software additions, which may not be available in all hospitals, and that it is costly. Recently, Non-Gaussian diffusion-weighted imaging (DWI) techniques such as q-space imaging (QSI) and diffusion kurtosis imaging (DKI) have emerged as advanced methods to evaluate tissue microstructure in vivo using water diffusion[2][3]. The possibility of evaluating liver microstructural degeneration or liver function using DKI is clinically beneficial. In general, evaluation by serum data is simple and common use to evaluate liver functions. Comparing the mean kurtosis value with the Child–Pugh score, ALBI score, and ICG-R15 value, which are typical indicators of liver function obtained from serum data, might render liver function evaluation much more efficient in the clinical. Therefore, the purpose of the present study was to determine whether DKI analysis as an additional sequence can replace laboratory tests as an indicator of liver function.
METHODS
This retrospective study was approved by our Institutional Review Boardand informed consent was waived. Between April 2015 and May 2017, 79 patients (40 men and 39 women; mean age, 65 years; range, 35–81 years) suspected of having a hepatobiliary disease who underwent liver MRI including DWI were enrolled (including non-contrast inspection). 15 patients (9 men and 6 women; mean age, 30 years; range, 24–40 years) were control groups.Various blood serum parameters, including the indocyanine green (ICG) retention rate 15 min after an intravenous injection of ICG (ICG-R15)and mean kurtosis values and Child–Pugh and albumin–bilirubin (ALBI) scores, were calculated [4-7]. In total, 17 patients were tested using ICG-R15.For evaluating liver function, correlations between the mean kurtosis valueand the Child–Pugh score,ALBI score,and ICG-R15 valueas indicators of liver function obtained from blood data were assessed using Spearman’s rank correlation. In apparent diffusion coefficient (ADC) as well, we assessed correlations with these indicators.In order to eliminate the misalignment of image at each b-value, images obtained from three b-values (b = 0, 1000 and 2000 s/mm2) were acquired with one breath hold. Imaging range covered the entire liver.All patients underwent MRI with a 3.0-T unit (Achieva, Philips Medical Systems, the Netherlands) equipped with a 6-channel cardiac coil. DKI was acquired using a single-shot, spin echo EPI sequence with two diffusion weightings (b = 1000 and 2000 s/mm2) along three noncolinear directions, and one b = 0 s/mm2volume (TR, 2500 ms; TE, 58 ms; flip angle, 90 degrees; field of view, 400 × 400 mm2; matrix, 80 × 80; slice thickness, 5.0 mm; no intersection gap; and acquisition time, 22 s). ROIs were placed without knowing the histopathological results. All ROIs (round, ≥ 10 mm diameter) in diffusion kurtosis images and ADC images were placed at the same location as the T2-weighted MR image. Correlations between the mean kurtosis value and the Child–Pugh and ALBI scores and ICG-R15 values were assessed using Spearman’s rank correlation. Discriminative capacities of DKI were evaluated using receiver operating characteristic (ROC) analysis.RESULTS
The mean kurtosis value correlated with the Child–Pugh score (Spearman’s rank-correlation coefficient, ρ= 0.3992; p< 0.0001). Moreover, the mean kurtosis valuerevealed a correlation withthe ICG-R15 value (Spearman’s rank-correlation coefficient, ρ= 0.5972; p= 0.00114). The correlation between the mean kurtosis valueand the ALBI score was the poorest among these (Spearman’s rank-correlation coefficient, ρ= 0.3395; p= 0.0008) (Figure 1). According to the ROC analysis for the classification of Child–Pugh and ALBI grade, AUC were 0.736 and 0.694 respectively (Figure 2, 3). Figure 4 shows three representative DKI maps and the mean kurtosis values for evaluating hepatic functions. Comparing between each classification and control group using Mean kurtosis and ADC value was shown in Figure 5.CONCLUSION
The mean kurtosis value obtained from DKI analysis can be one of predictors for liver functionowing to its correlation with the Child–Pugh score, the ALBI score, and ICG-R15 valuealthough this method, which shows liver function using DKI alone, cannot completely substitute thelaboratory tests.Acknowledgements
No acknowledgement found.References
1. H. A. Dyvorne et al., Liver Int., vol. 36, no. 5, pp. 659–66, May 2016.
2. J. H. Jensen et al., Magn. Reson. Med., vol. 53, no. 6, pp. 1432–1440, Jun. 2005.
3. Y. Assaf et al., Magn. Reson. Med., vol. 48, no. 1, pp. 71–81, Jul. 2002.
4. A. W. H. Chan et al., J. Gastroenterol. Hepatol., vol. 30, no. 9, pp. 1391–1396, 2015.
5. A. Hiraoka et al., Liver Cancer, vol. 6, no. 3, pp. 204–215, Jun. 2017.
6. P. J. Johnson et al., J. Clin. Oncol., vol. 33, no. 6, pp. 550–8, Feb. 2015.
7. Y. Seyama et al., Hepatol. Res., vol. 39, no. 2, pp. 107–116, Feb. 2009.
Figures
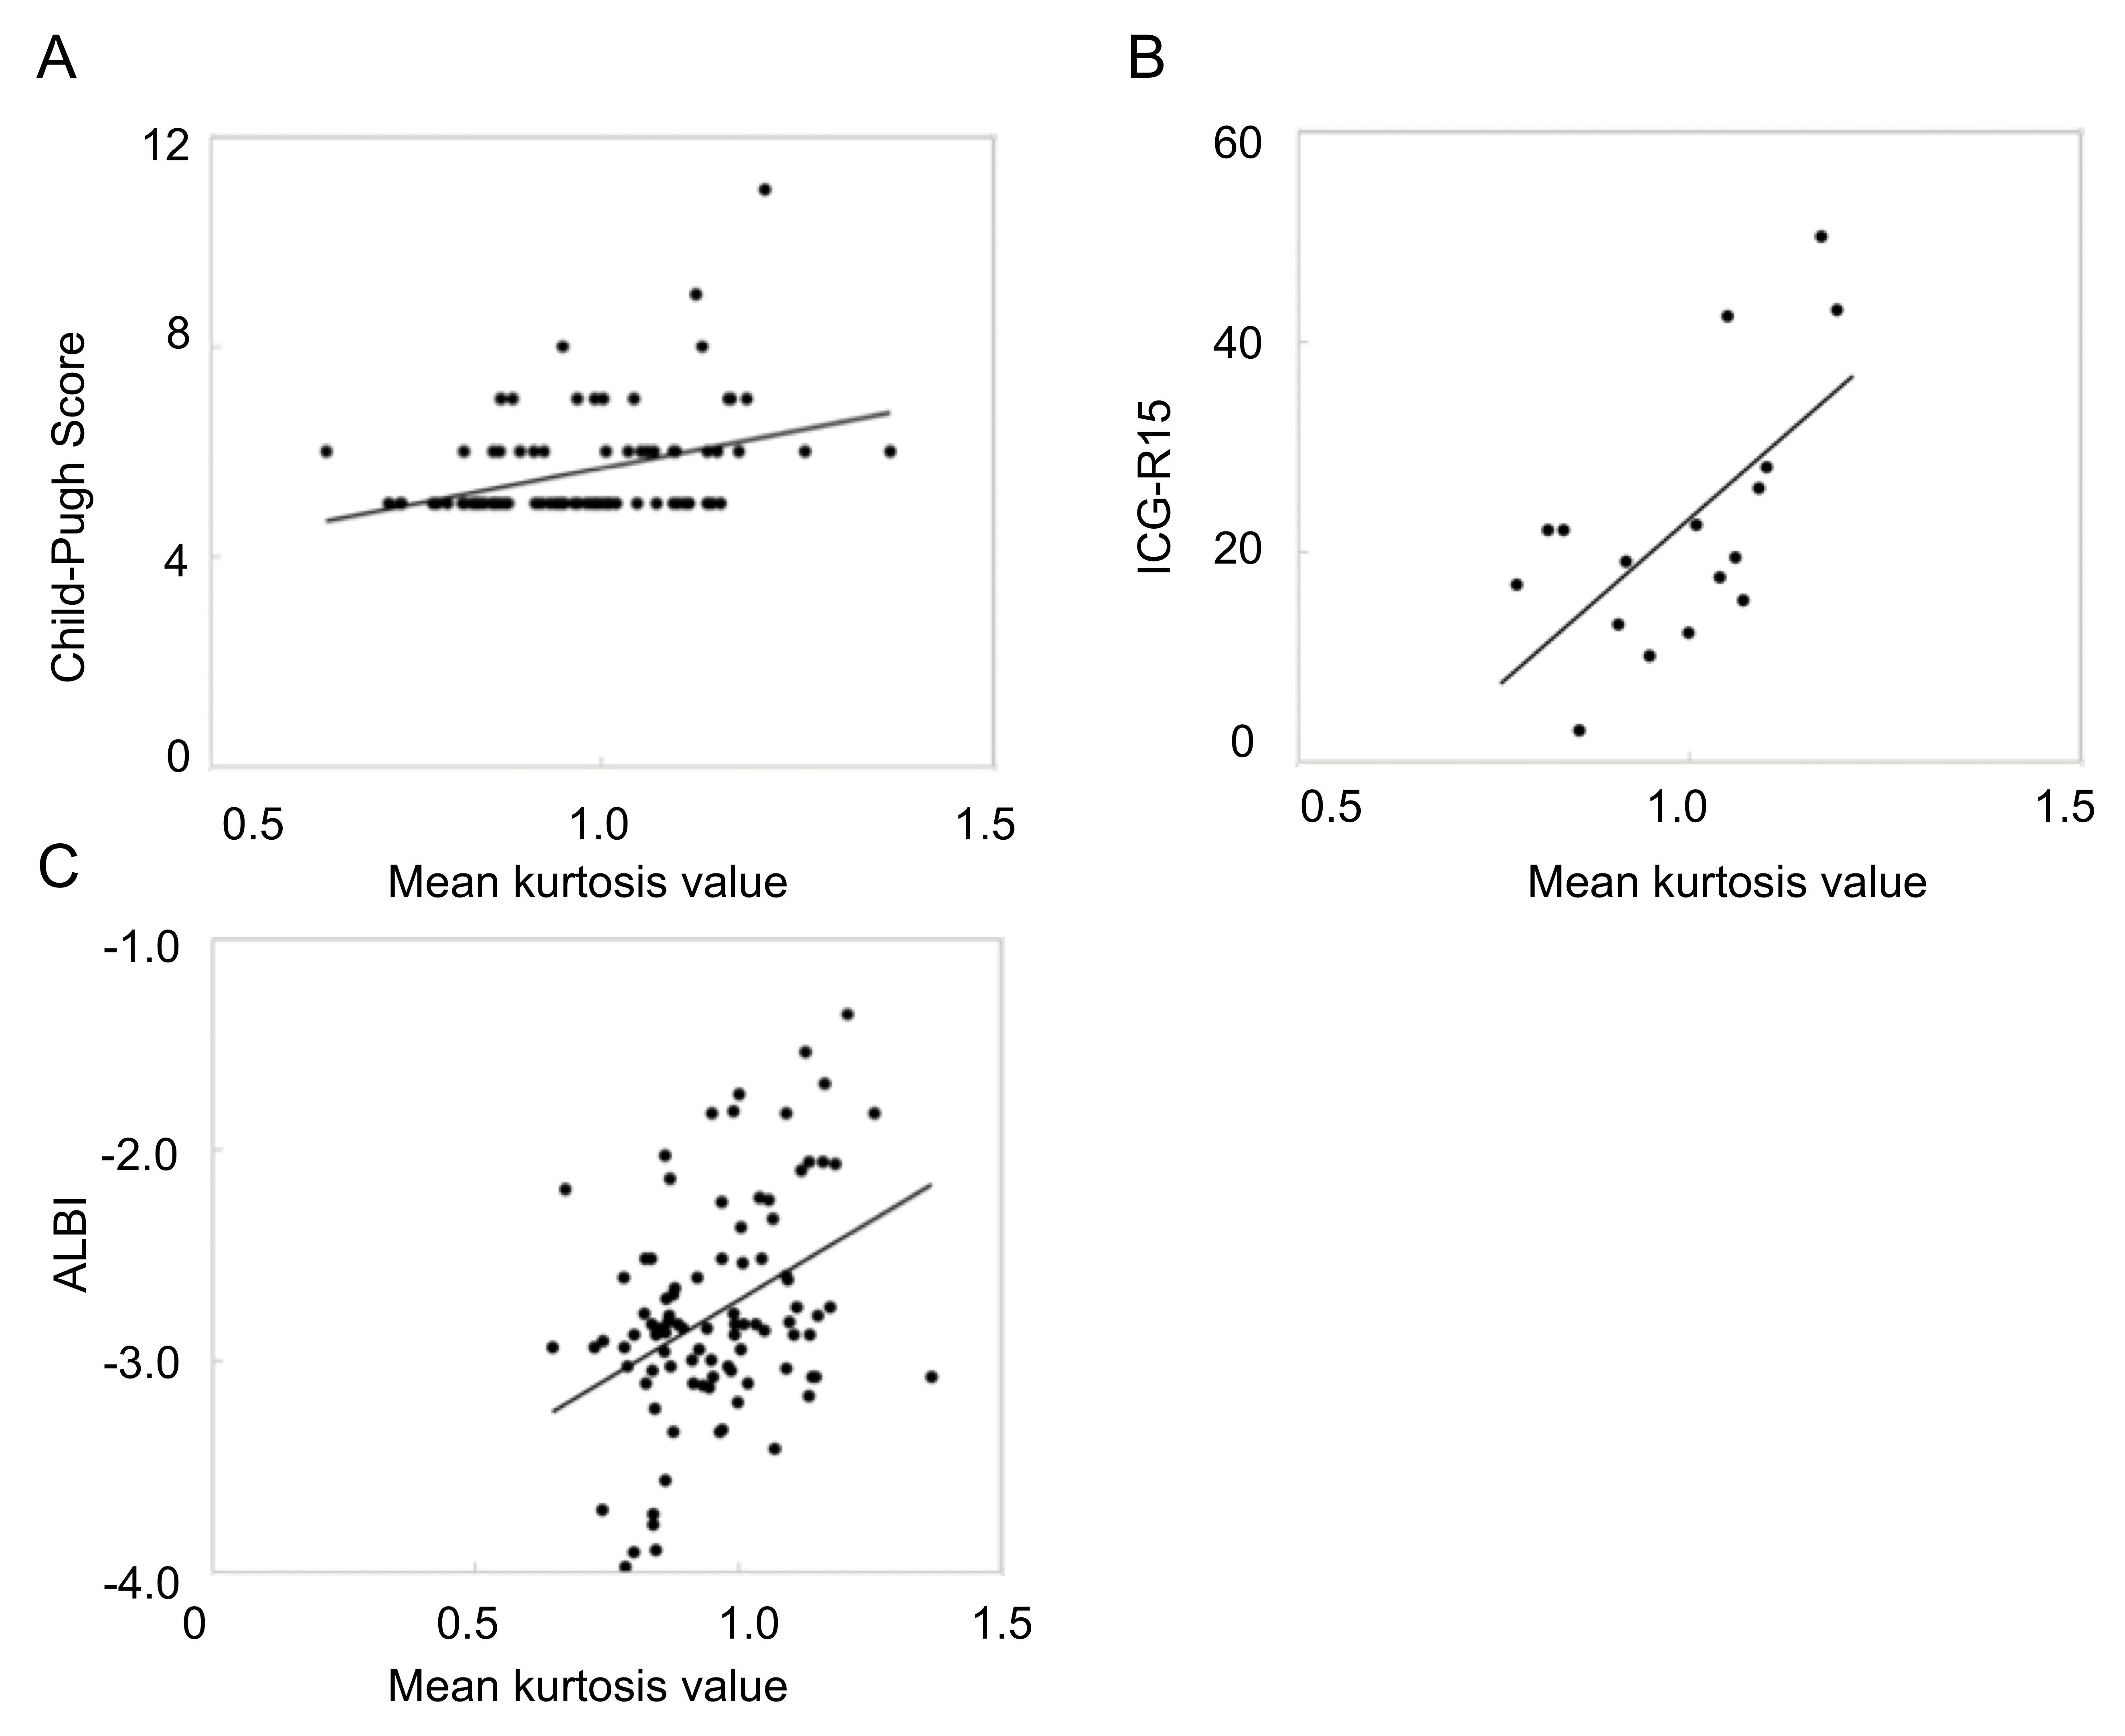
Figure 1
Scatter plots of the correlation between the mean kurtosis value and three serum classification parameters. The correlation between the mean kurtosis value of liver parenchyma and A) the Child–Pugh score, B) the ICG-R15 value, and C) the ALBI score is shown.
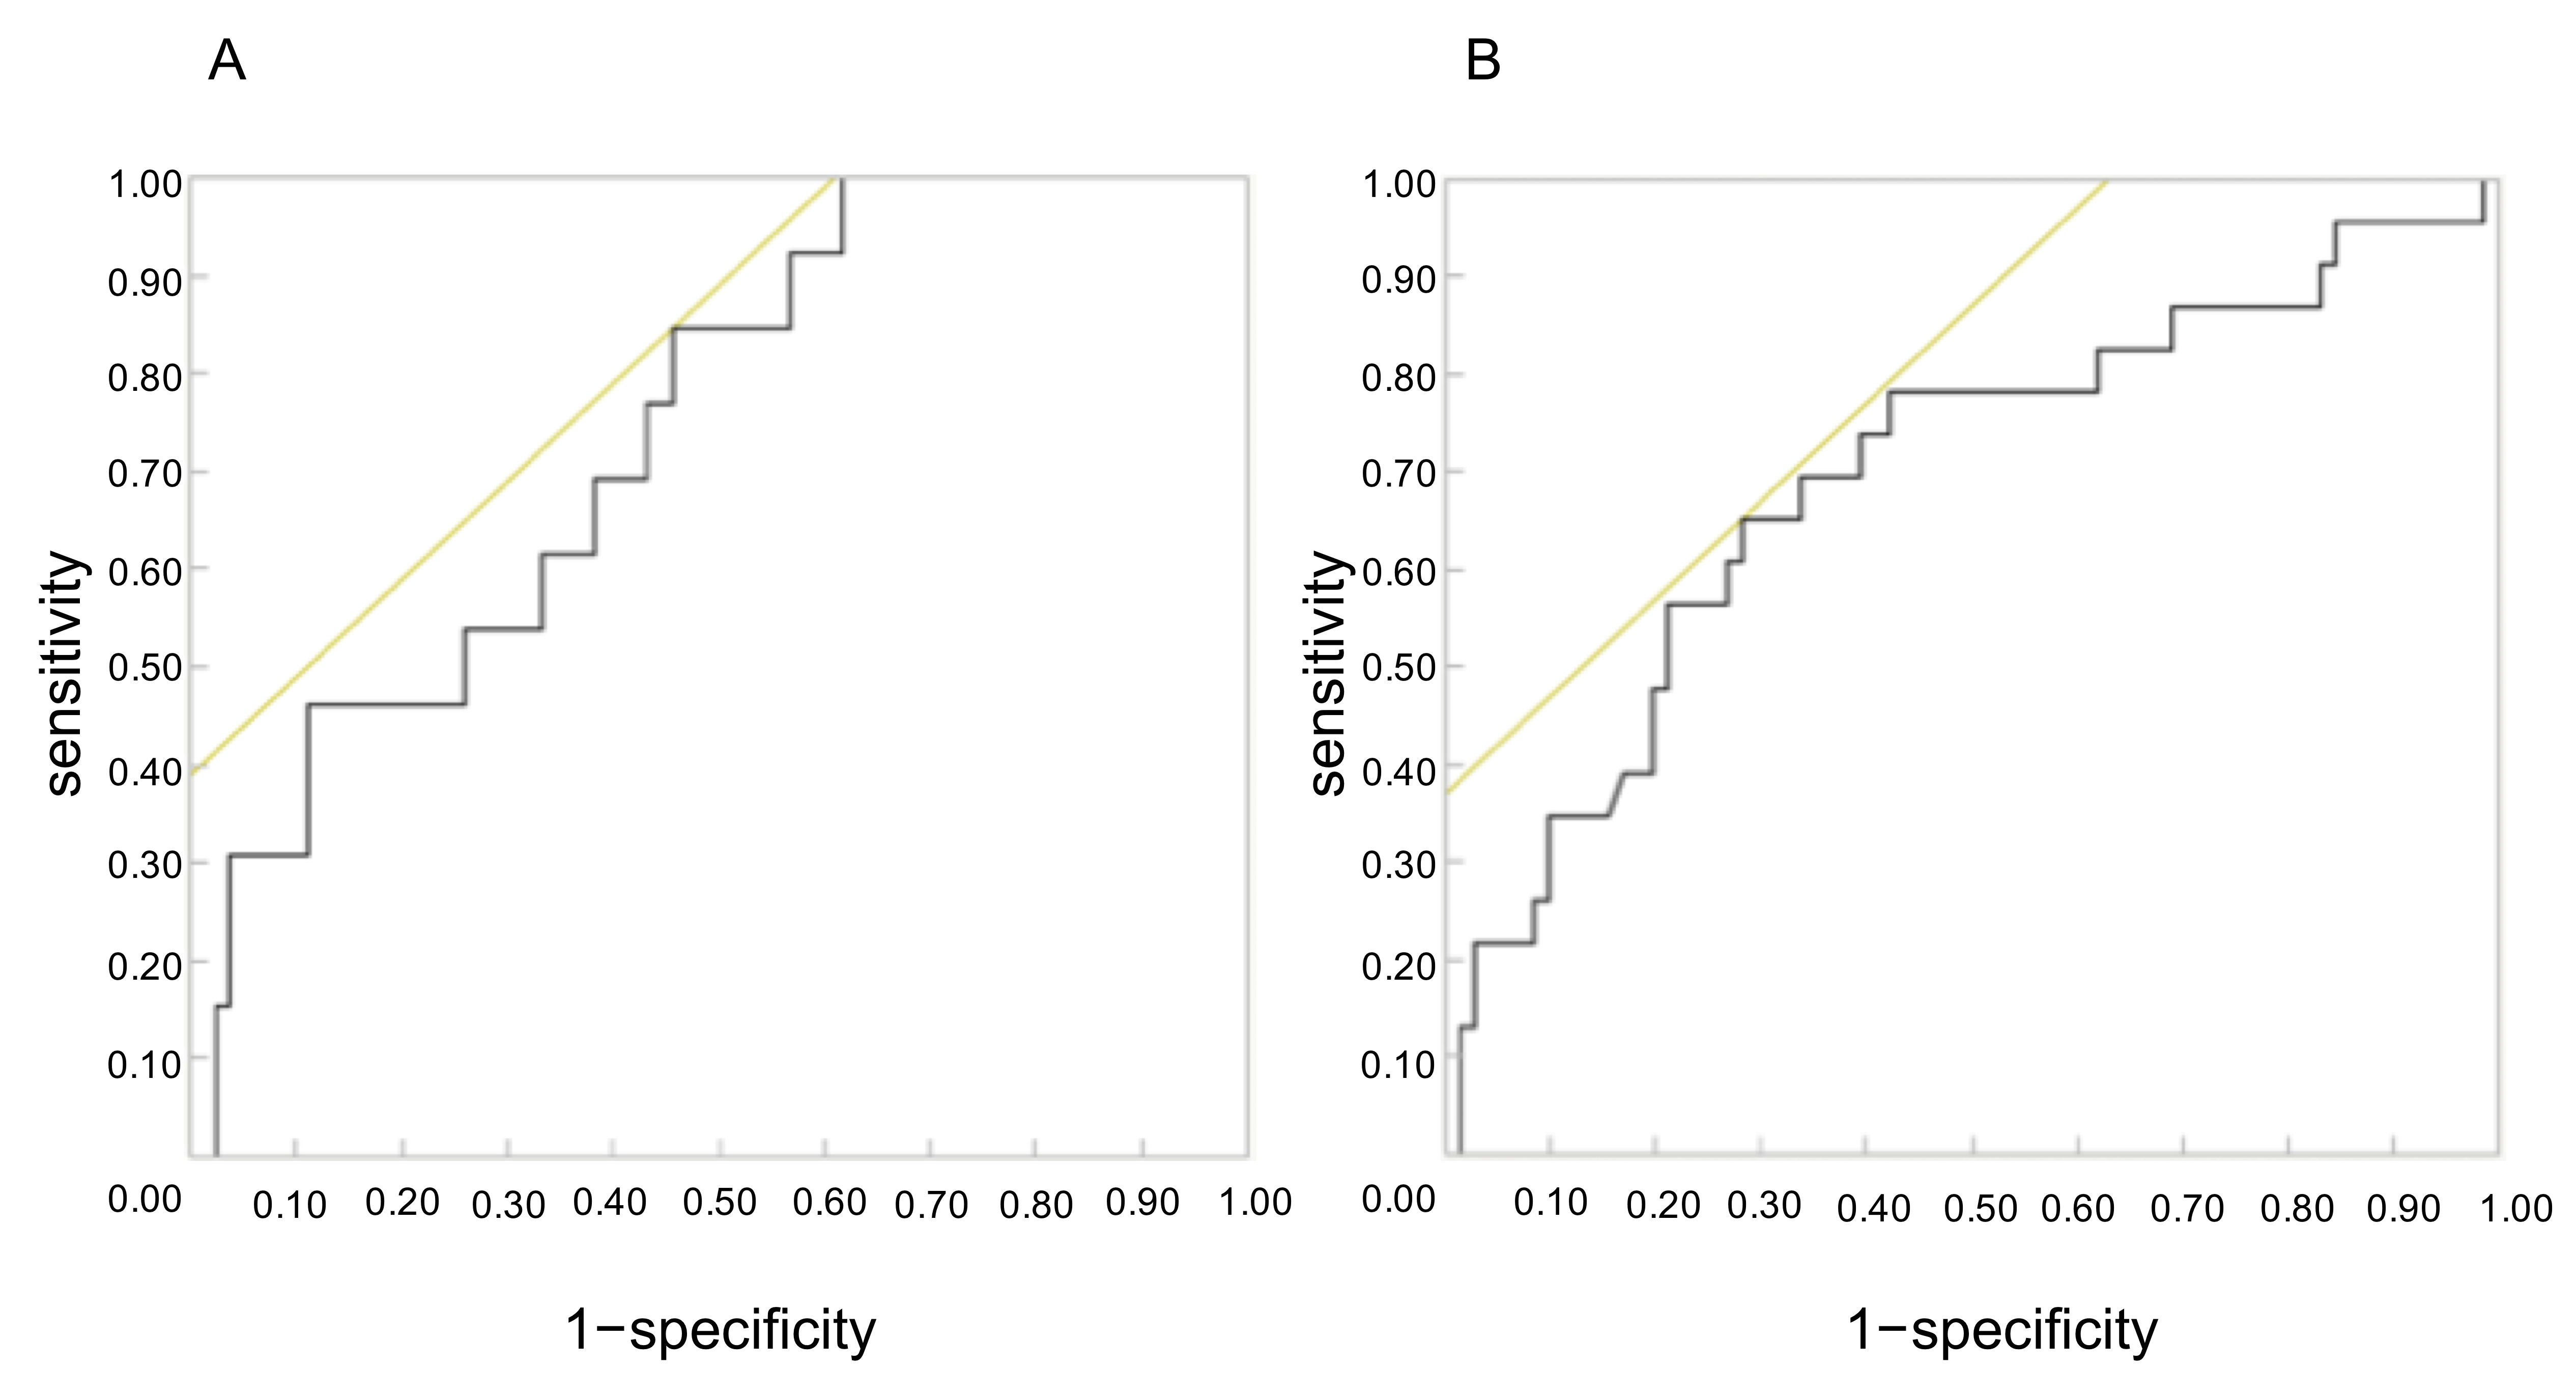
Figure 2
A) Receiver operating characteristic curve (ROC) and area under the ROC (AUC) analysis of the detection of differentiating Child–Pugh A from Child–Pugh B.
B) Receiver operating characteristic curve (ROC) and area under the ROC (AUC) analysis of the detection of differentiating ALBI grade 1 from grade 2 - 3.
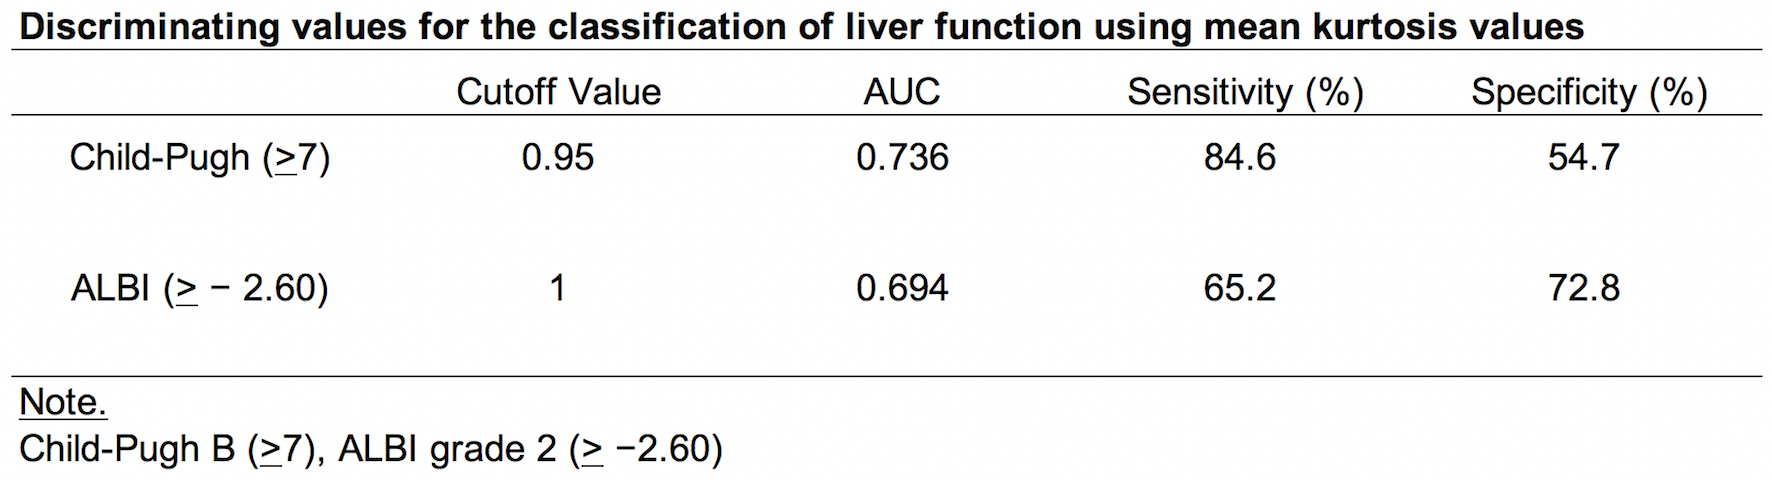
Figure 3
Discriminating values for the classification of liver function using mean kurtosis values
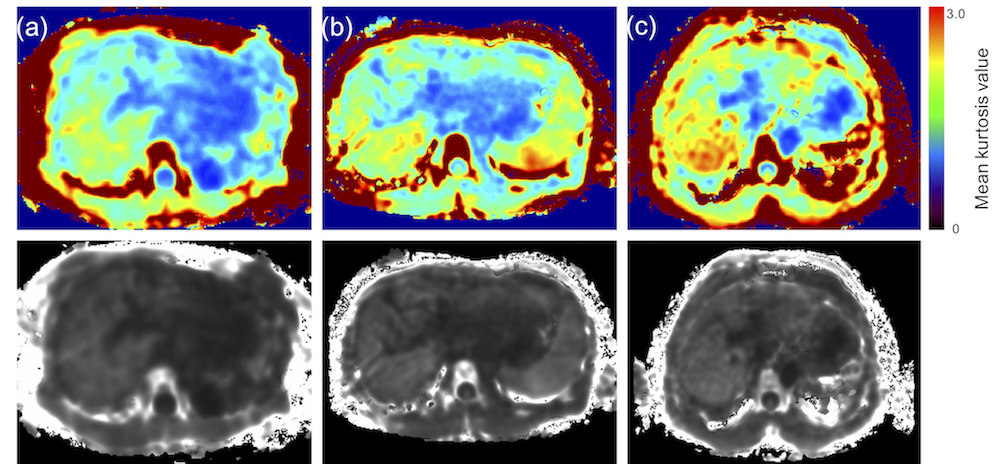
Figure 4
Representative DKI maps of each class in the Child–Pugh classification. (a) Class A of the Child–Pugh classification (mean kurtosis value = 1.04), (b) Class B of the Child–Pugh classifications (mean kurtosis value = 1.14), and (c) Class C of the Child–Pugh classifications (mean kurtosis value = 1.19). The lower row of images presents the original DKI map. The upper row of images presents the color map used to make a visual assessment of the difference in values between organizations easier. The mean kurtosis value was defined as ranging from 0 to 3.
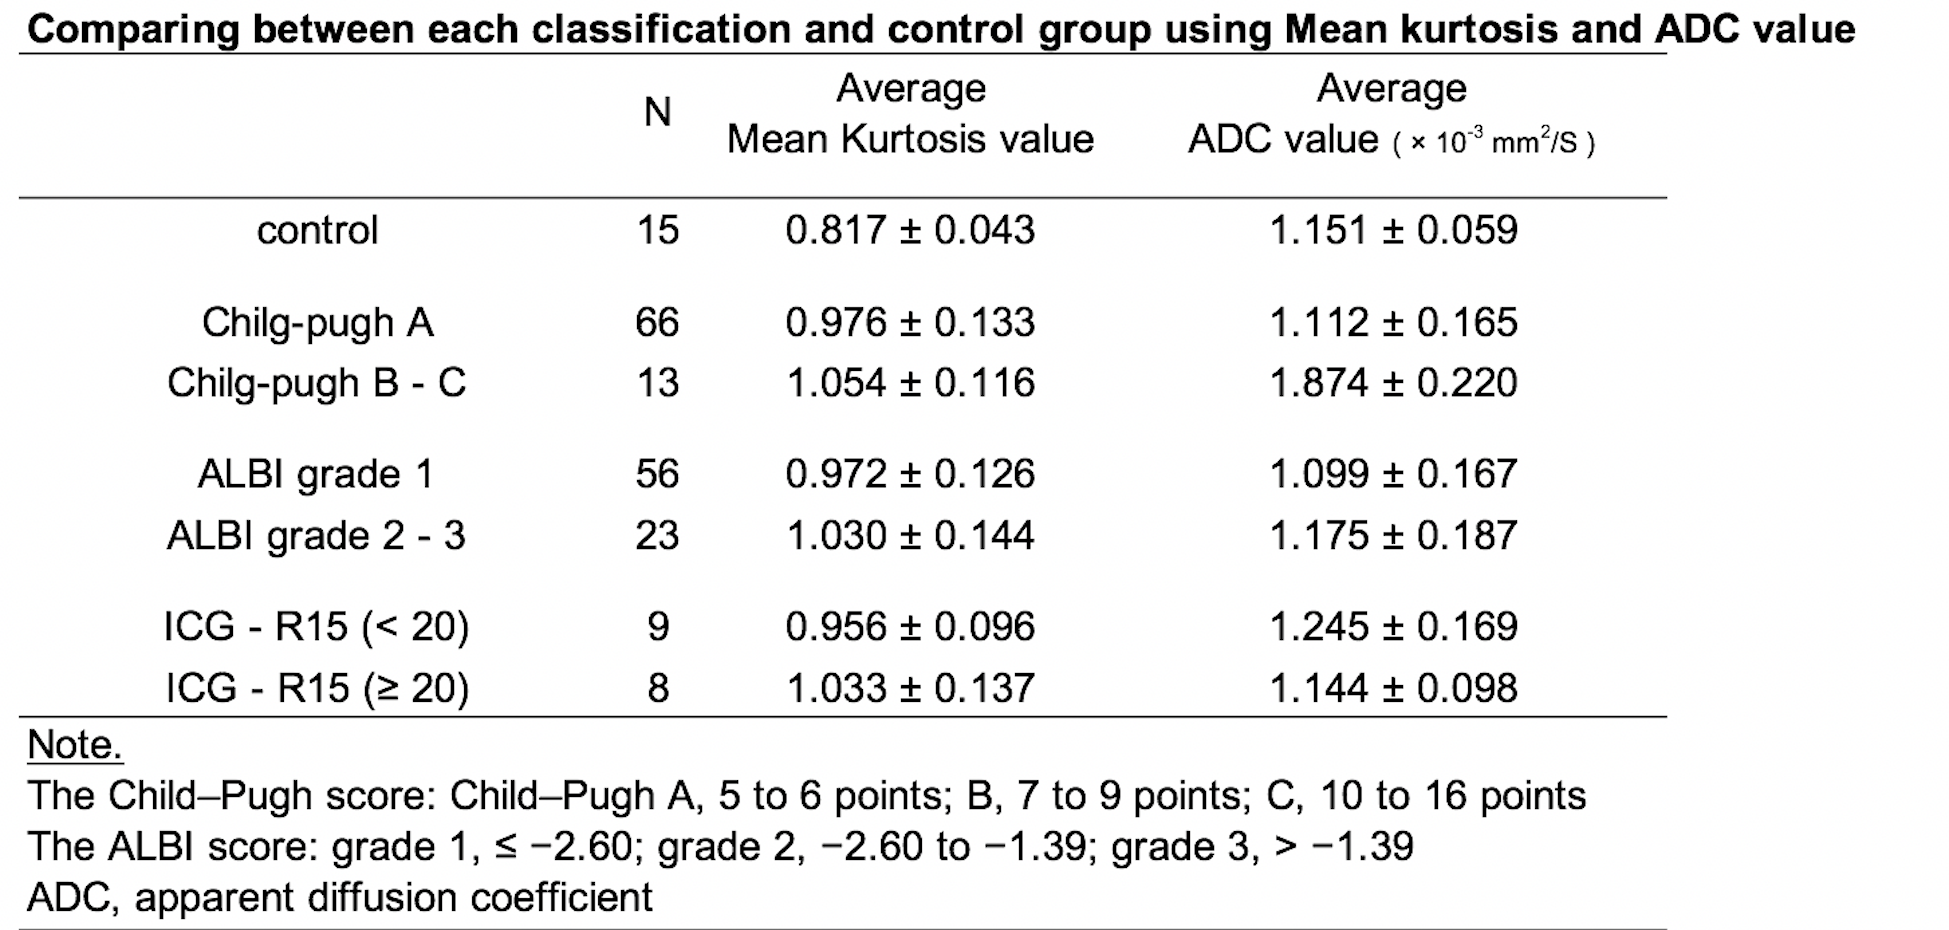
Figure 5
Comparing between each classification and control group using Mean kurtosis and ADC value