3464
Correlation Tensor Imaging (CTI): resolving diffusion sources of non-Gaussian diffusion1Champalimaud Neuroscience Programme, Champalimaud Centre for the Unknown, Lisbon, Portugal, 2Center of Functionally Integrative Neuroscience (CFIN) and MINDLab, Clinical Institute, Aarhus University, Aarhus, Denmark, 3Department of Physics and Astronomy, Aarhus University, Aarhus, Denmark
Synopsis
The cumulant expansion of Double Diffusion Encoding (DDE) involving correlation tensors has been previously theoretically presented but never exploited beyond microscopic anisotropy detection. Here, we propose the correlation tensor imaging (CTI) as novel approach capable of mapping correlation tensor features using DDE acquisitions. The correlation tensor can provide unique information: as a first step, we theoretically and experimentally demonstrate that CTI can be used to resolve the different underlying sources of diffusion kurtosis vis-à-vis isotropic and anisotropic variance of tensors and restricted diffusion (µK). The ensuing estimates bode well for many future applications.
Introduction
Non-Gaussian signal decay in single-diffusion encoding (SDE), typically referred to as diffusion kurtosis, emerges from variance of diffusion tensors (inter-compomponental kurtosis), the presence of restricting boundaries (intra-compartmental kurtosis), and exchange1-4. Double diffusion encoding (DDE) can disentangle microscopic anisotropy and orientation dispersion without requiring specific microstructural model constraints5-7. Theory presented by Jespersen et al.6,7 suggests that correlation tensors can be extracted from DDE data which can be connected to a 6D kurtosis tensor8,9. Here, this framework is expanded to explicitly resolve underlying inter- and intra-compartment kurtosis contributions. Simulations and experiments validate the ensuing correlation tensor imaging (CTI) approach and provide its first contrasts in the ex-vivo brain.Theory
To assess the different non-Gaussian sources, it is useful to express the powder-average signal kurtosis $$${K_p}$$$ for a generic system compromised of multiple non-Gaussian diffusion compartments:$$\overline{D }^2K_p=\frac{12}{5}\langle V_\lambda(\mathbf{D_i})\rangle+3V(\overline{D_i})+\overline{D }^2\mu K\,\,\,\,(1)$$where $$$\overline{D}$$$ is the mean diffusivity, $$$\mathbf{D_i}$$$ models the apparent diffusivity of individual compartments, $$$\overline{D_i}$$$ is the mean diffusivity of individual compartments, $$$\langle V_\lambda(\mathbf{D_i})\rangle$$$ is the averaged variance of $$$\mathbf{D_i}$$$ eigenvalue’s (microscopic anisotropy term), $$$V(\overline{D_i})$$$ is the variance of $$$\overline{D_i}$$$ across individual compartments (inter-compartment kurtosis), and $$$\mu K$$$ is a term modelling the effects of intra-compartmental kurtosis.
In the long timing time regime, DDE signals $$$E(\boldsymbol{q}_1,\boldsymbol{q}_2)$$$ can be expressed in terms of the following cumulant expansion by6:$$\log{E}(\boldsymbol{q}_1,\boldsymbol{q}_2)=-(q_{1i}q_{1j}+q_{2i}q_{2j})\Delta D_{ij}+\frac{1}{16}(q_{1i}q_{1j}q_{1k}q_{1l}+ q_{2i}q_{2j}q_{2k}q_{2l})\Delta^2\overline{D}^2 W_{ijkl}+$$ $$\frac{1}{14}q_{1i} q_{1j}q_{2k}q_{2l}Z_{ijkl}+O(q^6)\,\,\,\,(2)$$ where $$$\boldsymbol{q}_1$$$ and $$$\boldsymbol{q}_2$$$ are the q-vectors of the two diffusion encoding pulses, $$$D_{ij}$$$ and $$$W_{ijkl}$$$ are the elements of the diffusion and kurtosis tensor, and $$$Z_{ijkl}$$$ are the elements of the 4nd order correlation tensor.
In the long timing time regime, $$$Z_{ijkl}$$$ can also be converted to the covariance tensor10,11 - $$$C_{ijkl}= Z_{ijkl}/(4(\Delta-\delta/3)^2)$$$. From this, the terms of Eq.1 can be estimated as following:
1.Microscopic anisotropy:7,11$$W_{aniso}= W_{aniso}=\frac{12}{5}\langle V_\lambda(\mathbf{D_i})\rangle=$$ $$\frac{8}{15}[ C_{1111}+D_{11}^2+C_{2222}+D_{22}^2+C_{3333}+D_{33}^2-C_{1122}-D_{11}D_{22}-$$ $$C_{1133}-D_{11}D_{33}-C_{2233}-D_{22}D_{33}+3(C_{1212}+D_{12}^2+C_{1313}+D_{13}^2 +C_{2323}+D_{23}^2)]\,\,\,\,(3)$$2.Inter-component kurtosis:11$$W_{iso}=3V(\overline{D_i})=\frac{1}{2}(C_{1111}+C_{2222}+C_{3333}+2C_{1122}+2C_{1133}+2C_{2233})\,\,\,\,(4)$$3.Intra-compartmental kurtosis:$$\mu W=\overline{D }^2\mu K=\overline{D}^2K_p–W_{aniso}–W_{iso}\,\,\,\,(5)$$where $$$\overline{D}$$$ and $$$K_p$$$ can be estimated from $$$D_{ij}$$$ and $$$W_{ijkl}$$$.
Methods
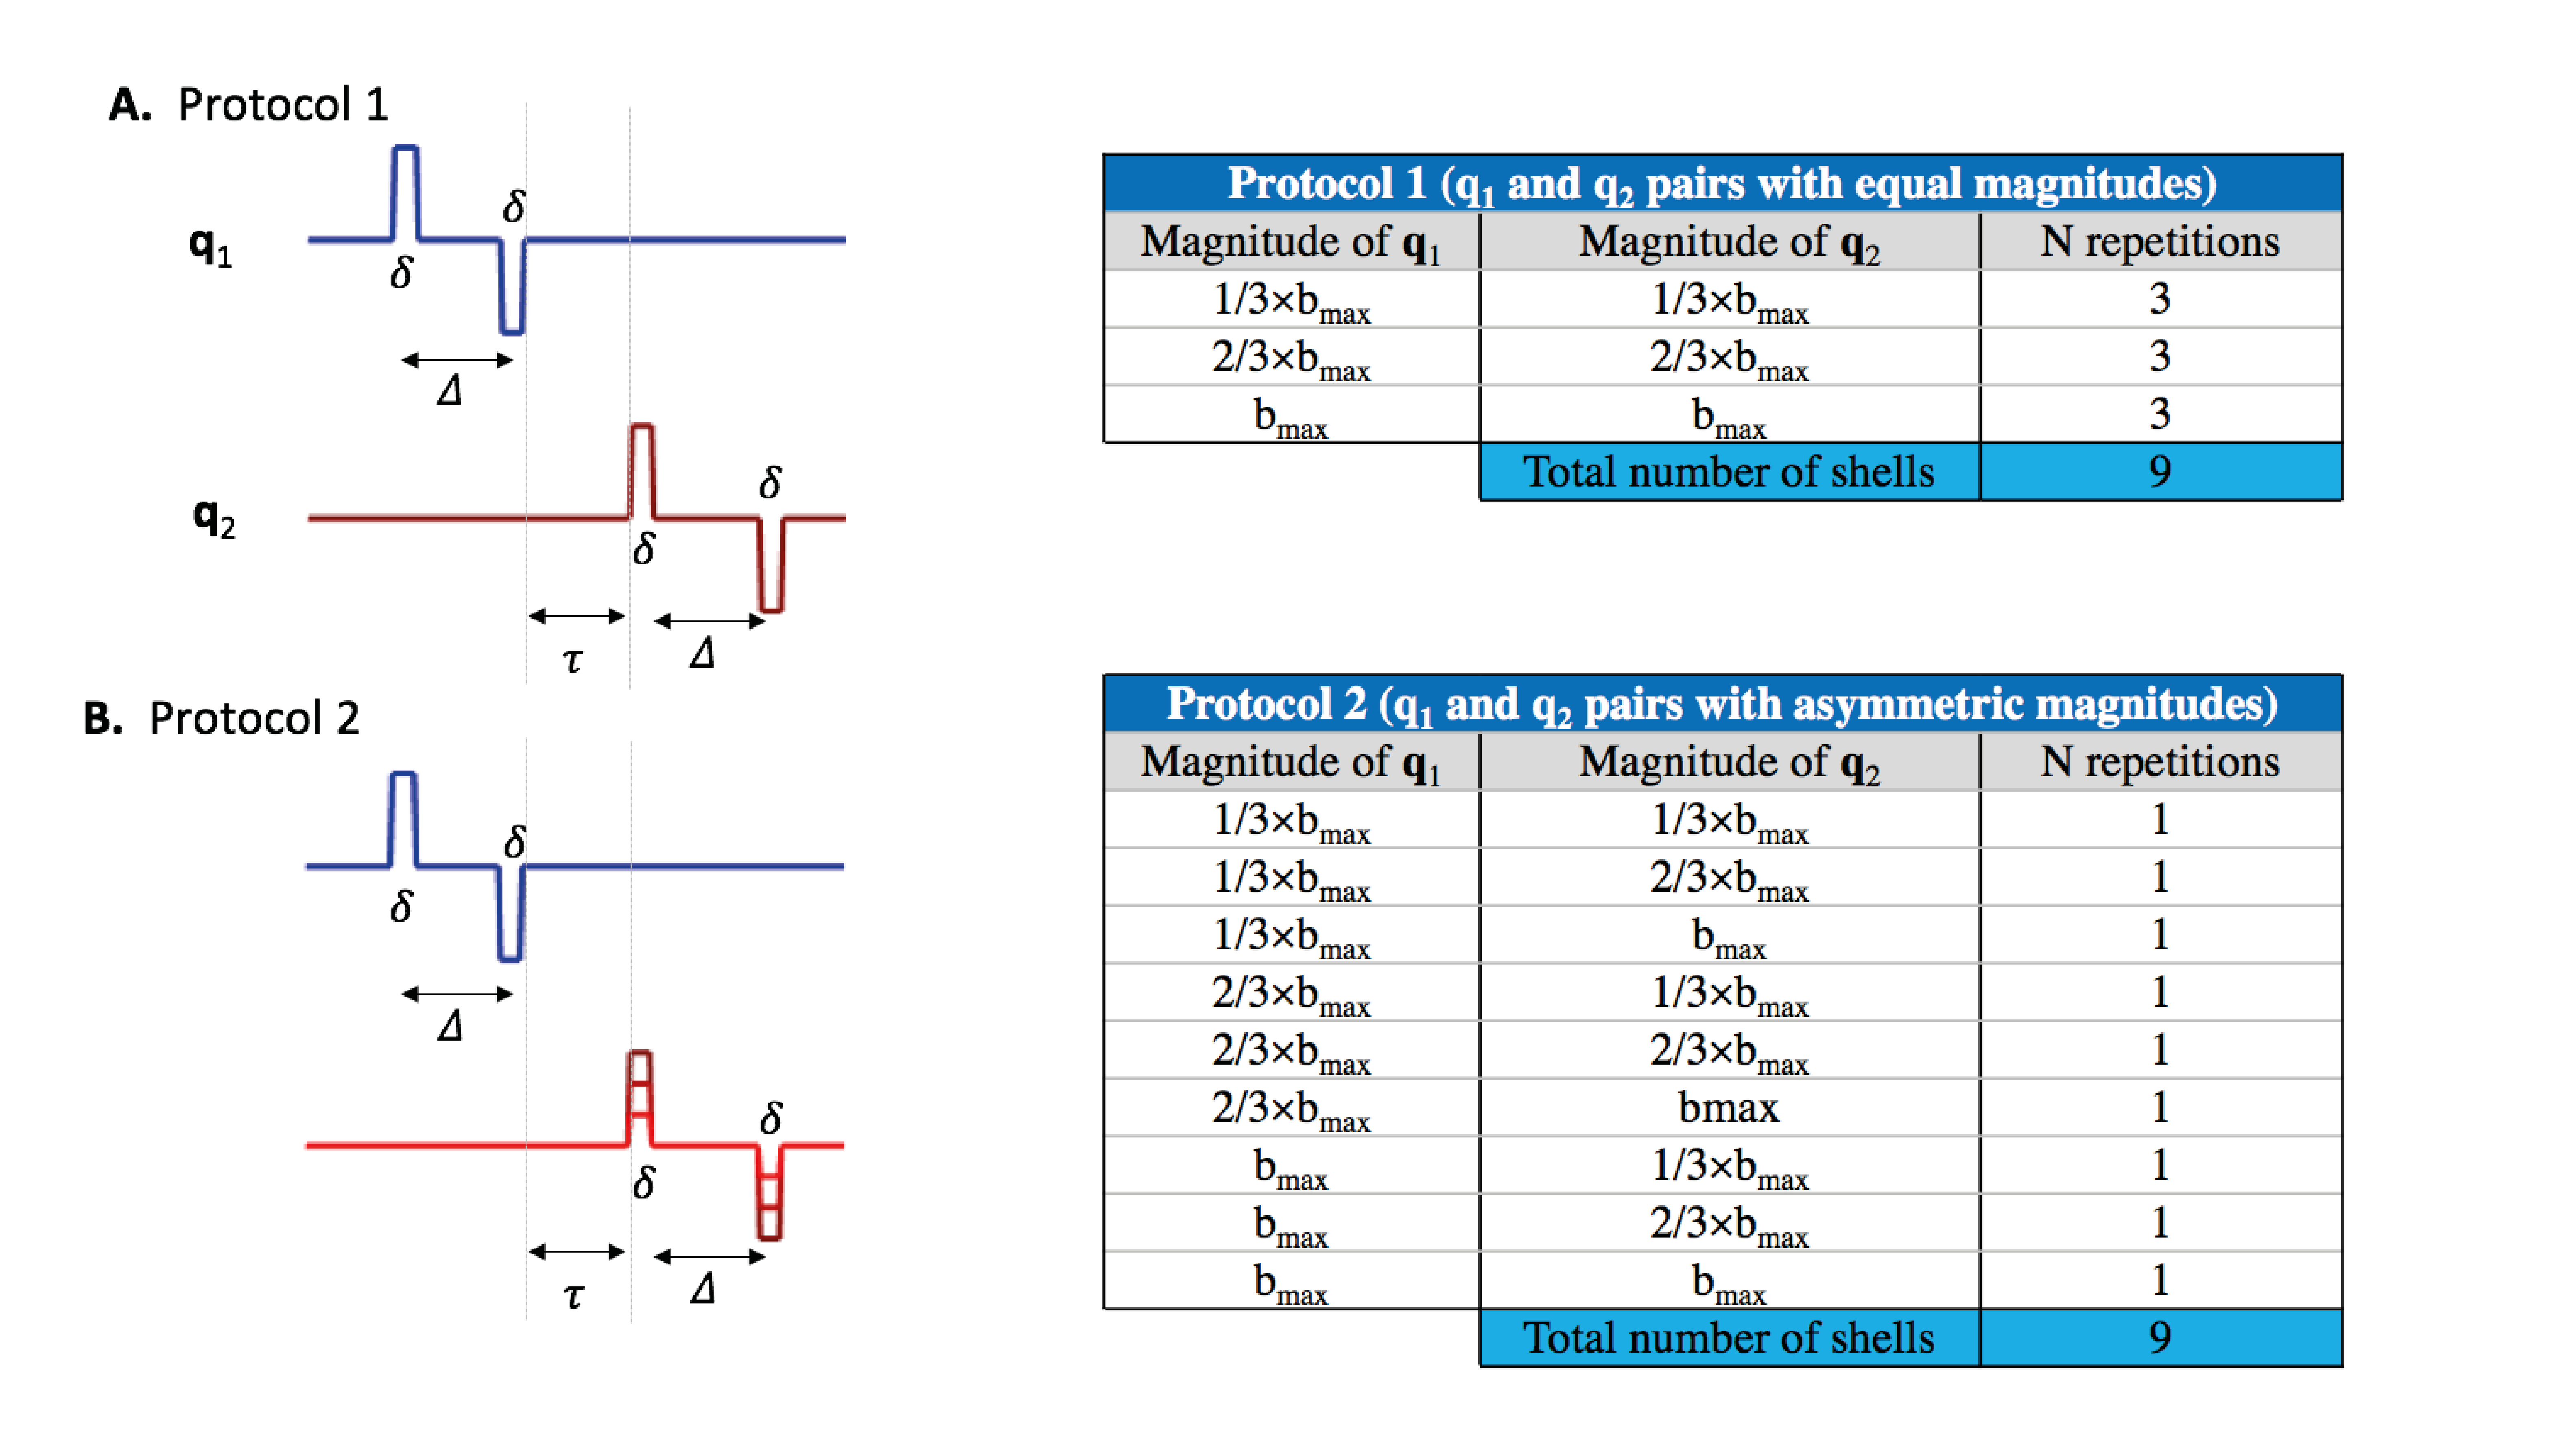
Simulations: Synthetic data were generated using the MISST package12 for two scenarios: 1) two Gaussian diffusion components representing intra- and extra-cellular spaces; 2) restricted infinite cylinders with radius=2.5μm and a Gaussian diffusion representing restricted intra-cellular space and hindered extra-cellular space. To assess the CTI acquisition parameters requirements, simulations were also produced for two protocols of $$$\boldsymbol{q}_1$$$ and $$$\boldsymbol{q}_2$$$ pairs of vectors: 1) with equal magnitude (16 b-value combinations used, Fig.1a); and 2) with asymmetric magnitudes (16 b-value combinations used, Fig.1b). For each b-value combination, 5-design directions7 were taken in addition to 45 parallel $$$\boldsymbol{q}_1$$$ and $$$\boldsymbol{q}_2$$$ directions. To assess higher order term effects, simulations were repeated using different $$$b_{max}$$$ values. Other protocol parameters were as follows: Δ=τ/δ=15/1.5ms. Simulations were produced noise-free to assess the technique’s full potential.
MRI experiments: Animal experiments were pre-approved by the institutional and national authorities (according to European Directive 2010/63). An adult mouse brain (N=1) was transcardially perfused and immersed in 4% PFA for 24h, and then washed in PBS for at least 48h prior to scanning. Data was acquired using a 16.4 T Aeon Ascend Bruker scanner equipped with a Micro5 probe with gradient coils capable of producing up to 3000 mT/m in all directions, and for the two protocols with $$$b_{max}=1.5$$$ms/μm2. Other acquisition parameters were as follows: TR/TE=2500/52.1ms, voxel resolution 0.175×0.175×0.9mm.
Results and Discussion
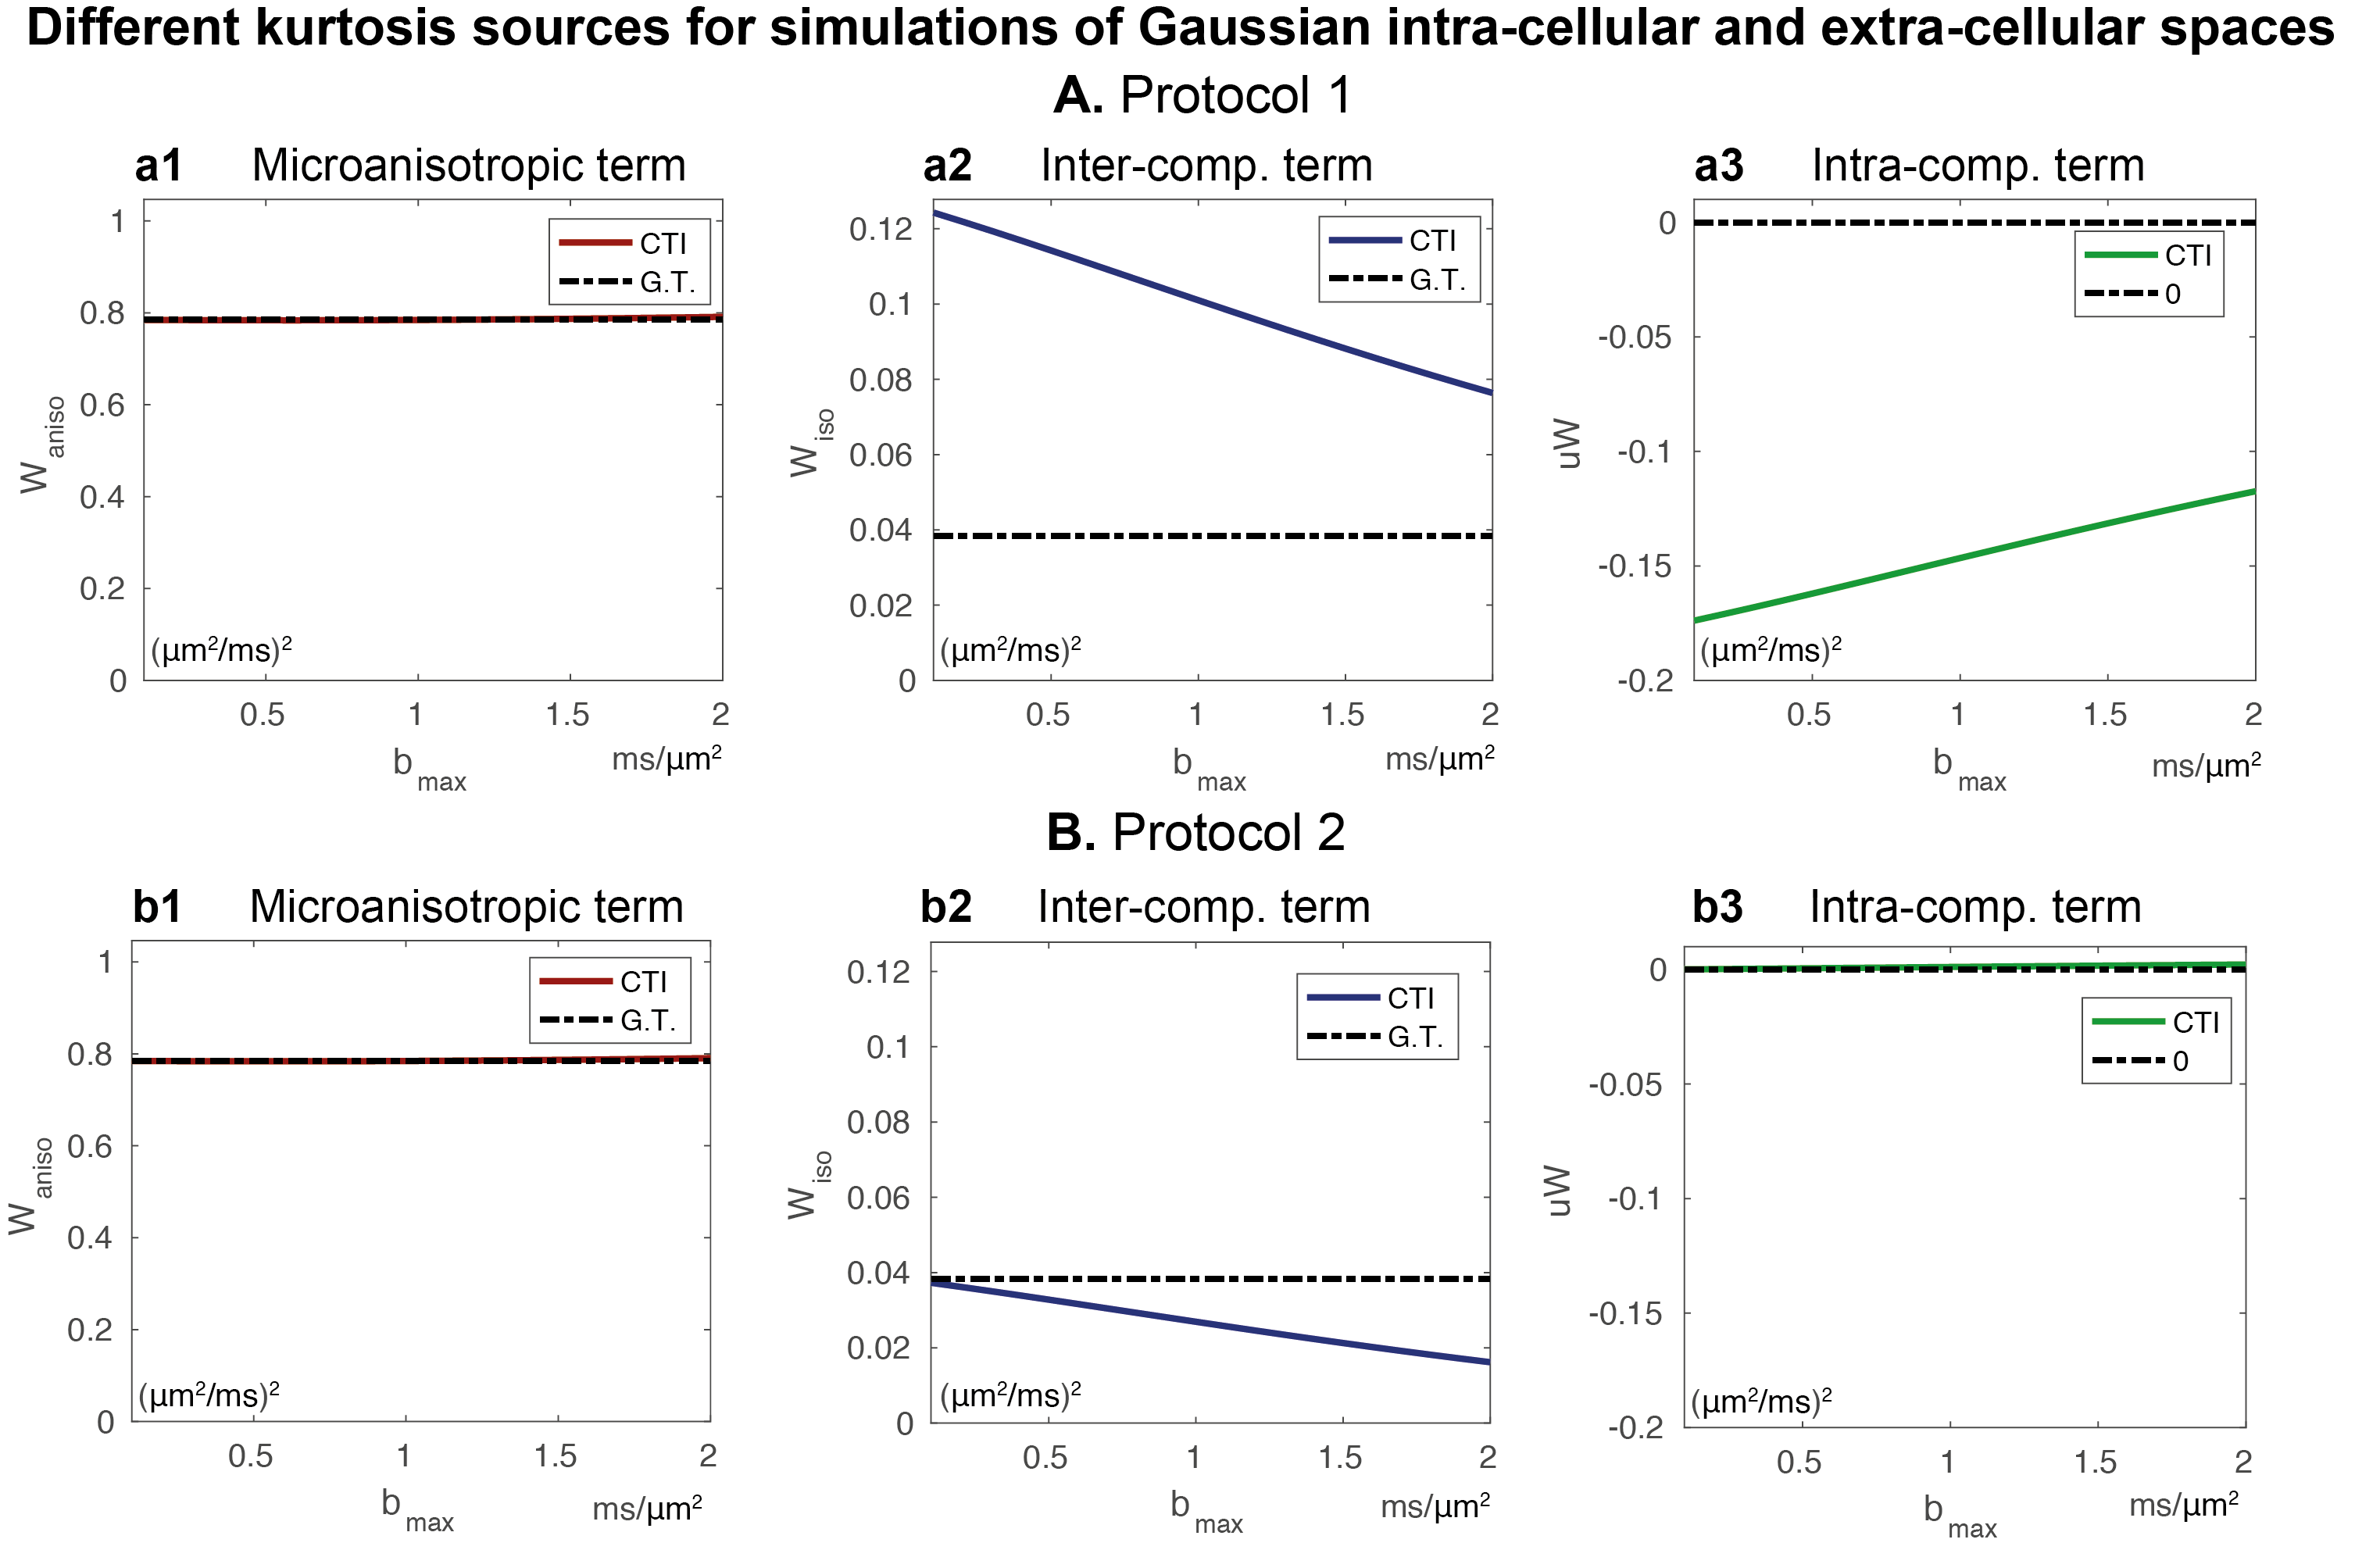
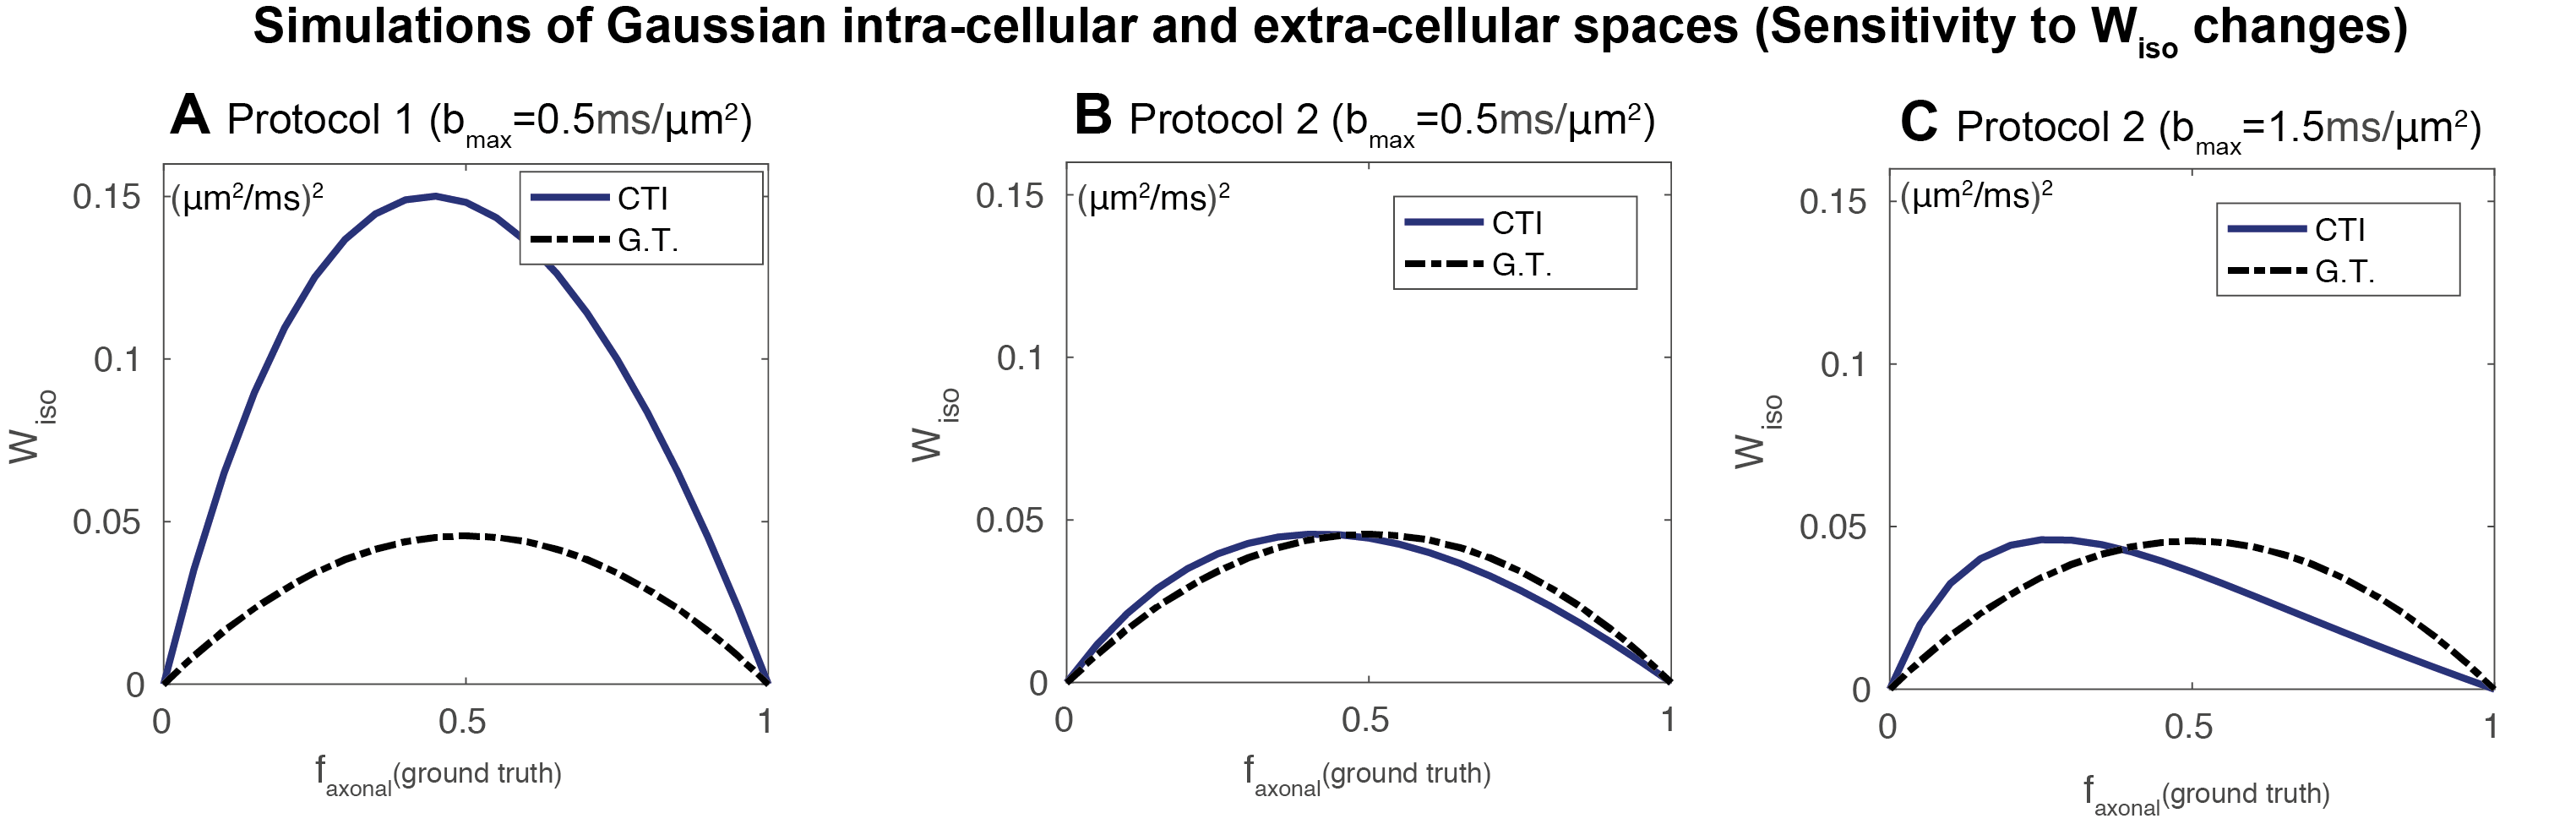
CTI simulations: CTI produced accurate $$$W_{aniso}$$$ estimates for both encoding protocols (Fig.2a1/Fig.2b1). However, CTI produced inflated $$$W_{iso}$$$ estimates for protocol 1 (Fig. 2a2). $$$W_{iso}$$$ estimates were stabilised when asymmetric magnitudes of diffusion encoding pairs were used (Fig. 2b2). However, these only approached the ground-truth for small $$$b_{max}$$$ values due to higher order effects (Fig.2b2). m$$$W$$$ estimates were only close to the zero ground truth for protocol 2 (Fig.2a3/Fig.2b3). Although $$$W_{iso}$$$ is biased by high order terms, CTI $$$W_{iso}$$$ estimates are still sensitive to their increases and decreases(Fig.3).
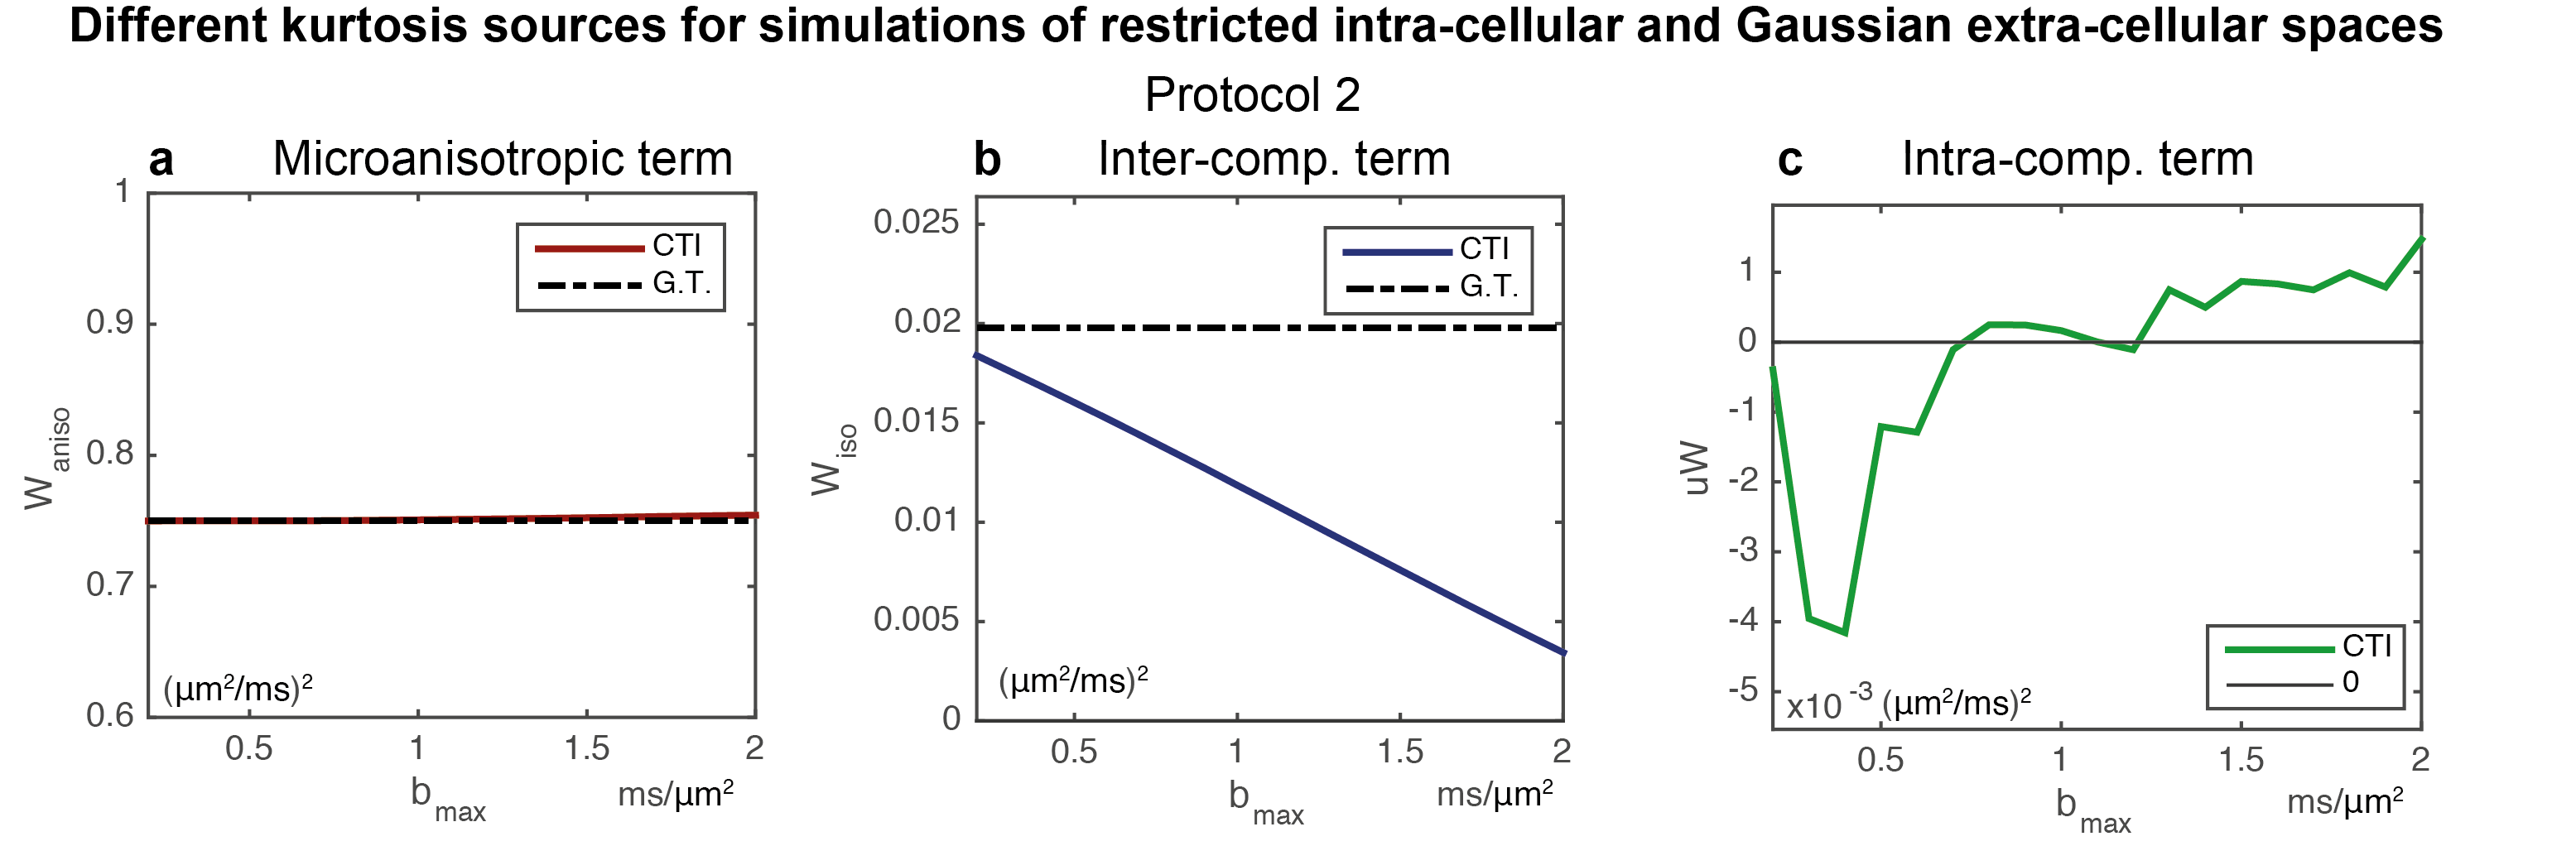
Sensitivity to μ$$$W$$$: Simulations considering intra-comparmtal kurtosis effects are shown in Fig.4. $$$W_{aniso}$$$ and $$$W_{iso}$$$ are similar to those considering the Gaussian assumption (Figs.4a/Fig.4b). μ$$$W$$$ reveals the expected negative kurtosis in simulations for $$$b_{max}$$$ lower than 0.7ms/μm2 (Fig.4c).
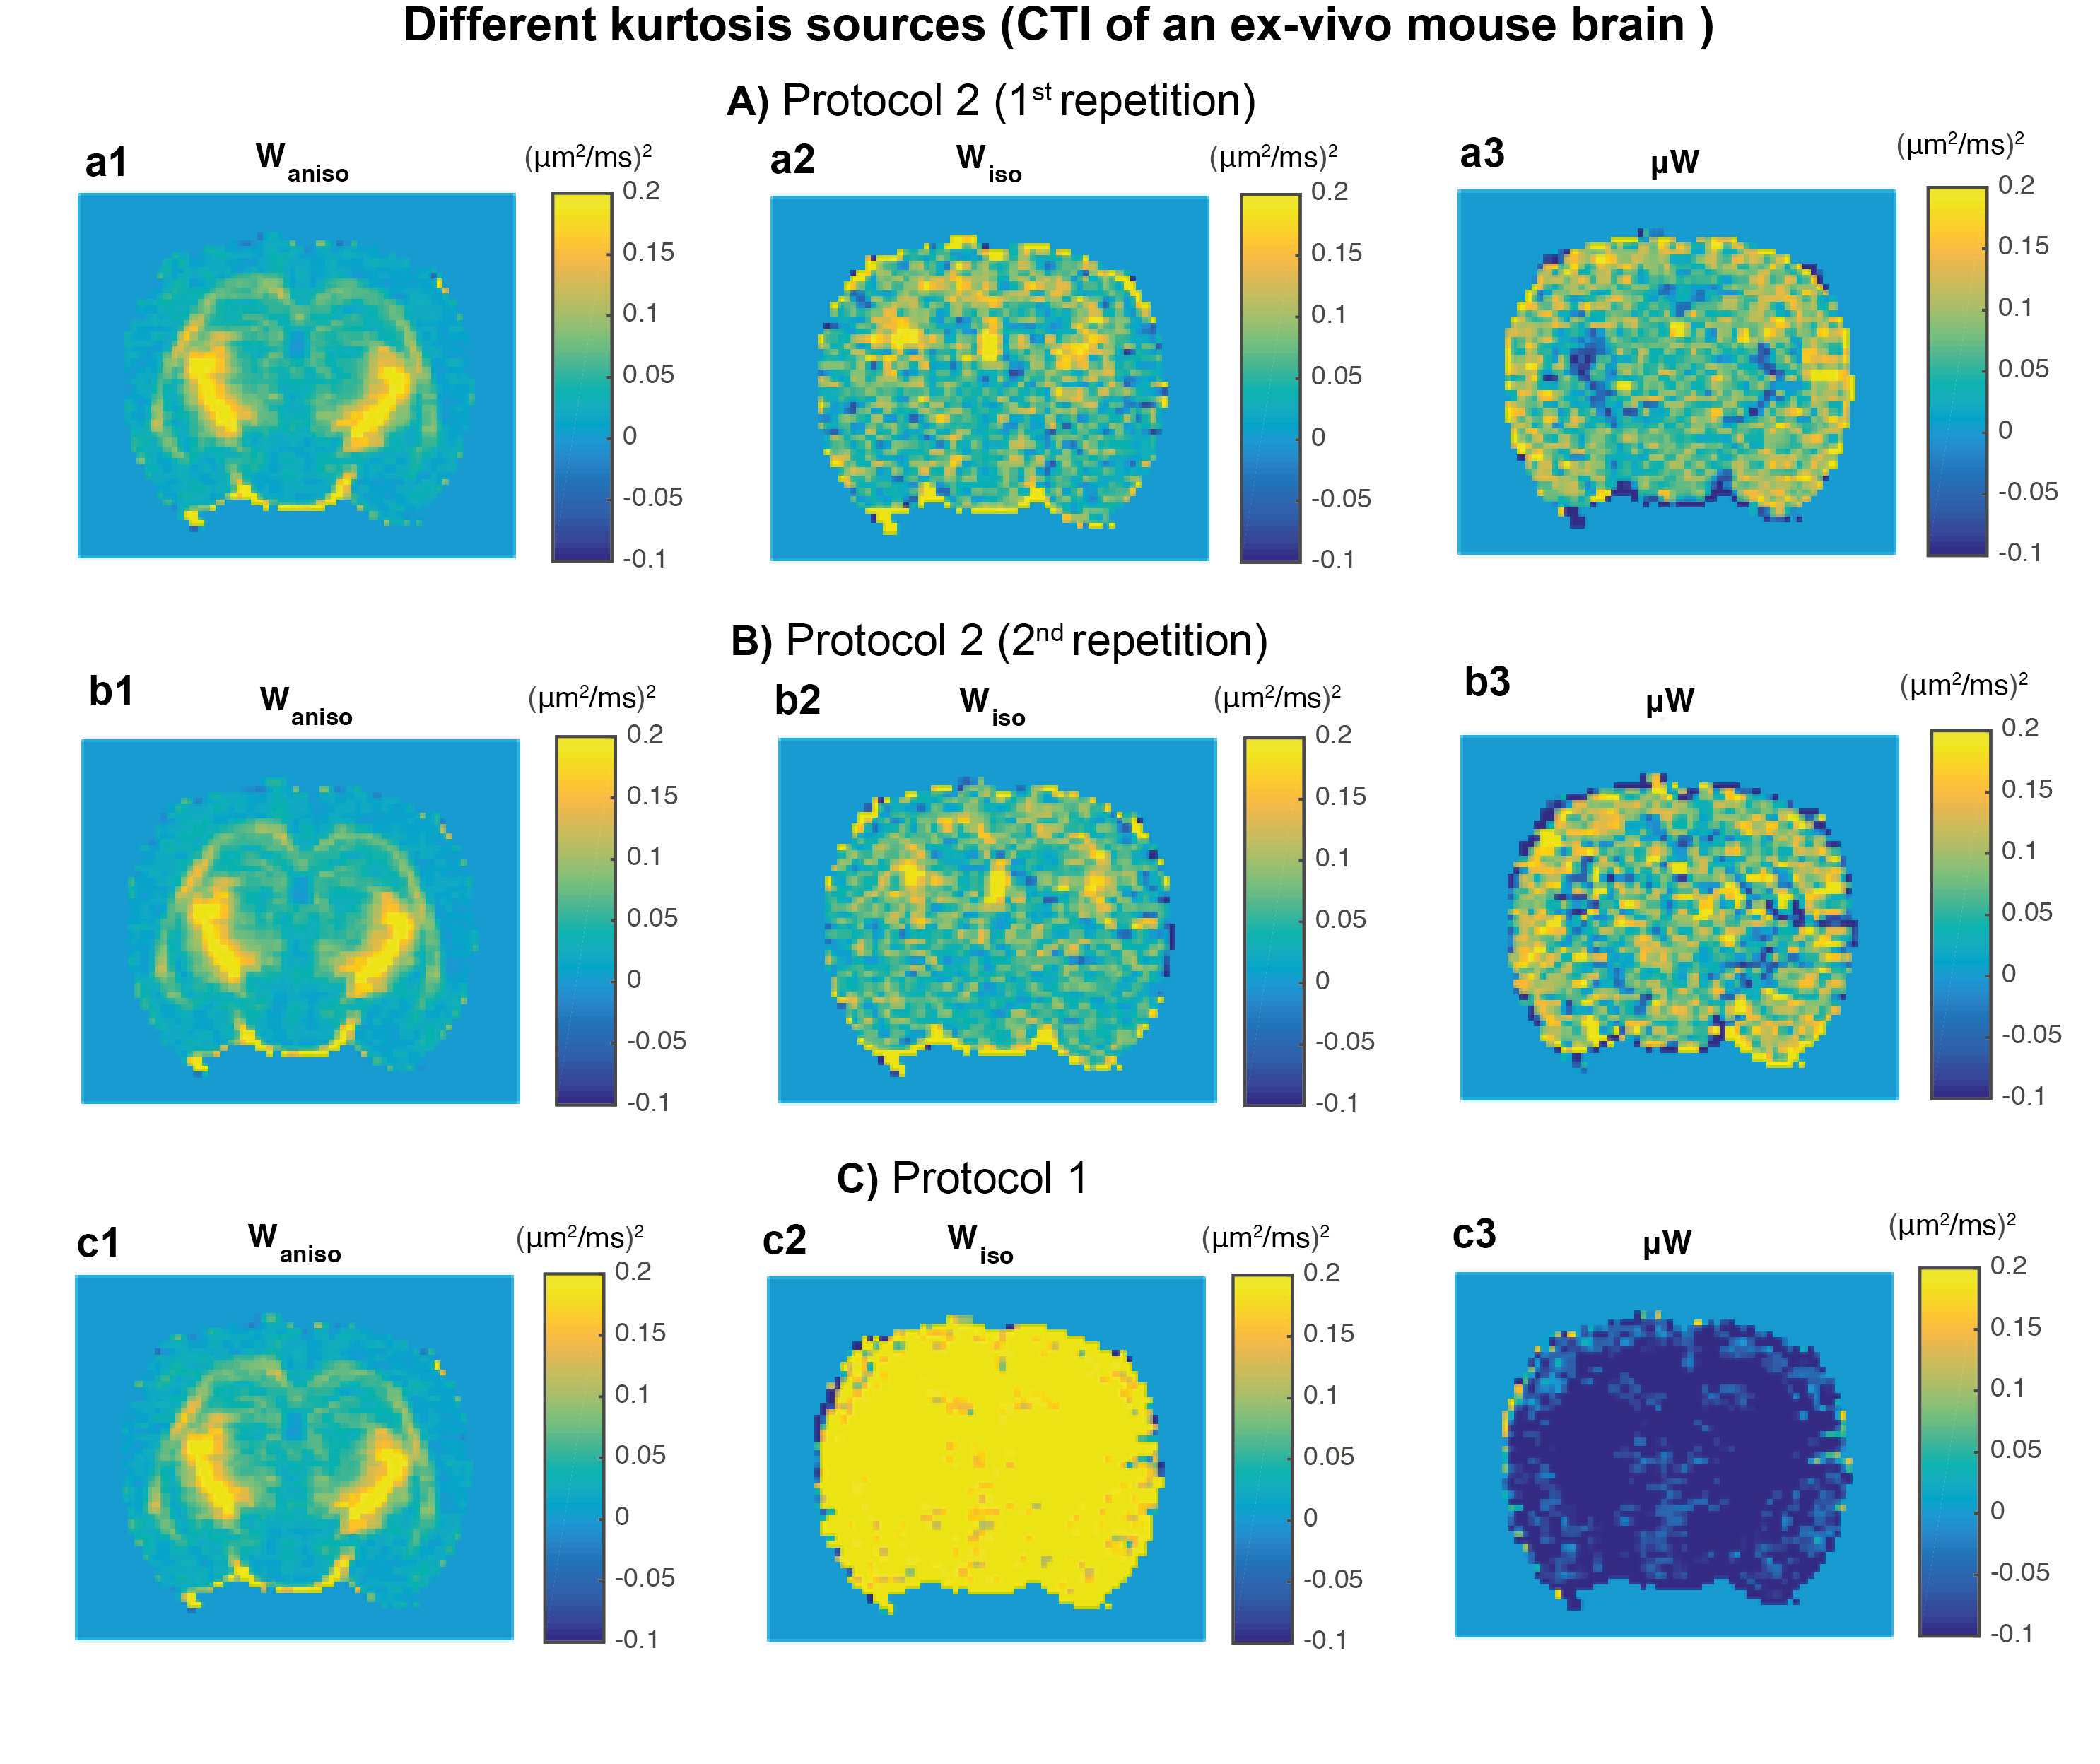
MRI experiments: As predicted by the simulations, $$$W_{aniso}$$$ maps are robust and independent of acquisitions protocol (Fig.5a1/Fig.5b1/Fig.5c1). The overestimation $$$W_{iso}$$$ for protocol 1 (Fig.5c2) is consistent to the prediction in from Fig.2a2. Consistent with simulations, negative m$$$W$$$ values are present in white matter regions. This is in contrast with two recent studies that attempted to measure intra-compartmental kurtosis13,14. We ascribe the discrepancy to conflating effects of orientation dispersion.
Conclusion
CTI is a novel framework for resolving the underlying sources of kurtosis and better characterisation of tissue microstructure. The use of asymmetric DDE increased the robustness of CTI. In future studies, further investigations on the optimal protocol for CTI will be preformed, particularly to increase estimate precision and decrease higher order effects.Acknowledgements
This study was funded by the European Research Council (ERC) (agreement No. 679058). The authors acknowledge Dr. Daniel Nunes and Ms. Teresa Duarte for the assistance in the preparation of the Mouse Brain Sample, and Mr. Leevi Kerkelä for insightful discussions.References
1. Jensen JH, Helpern JA, Ramani A, et al. Diffusional Kurtosis Imaging: The Quantification of Non-Gaussian Water Diffusion by Means of Magnetic Resonance Imaging, Magn. Reson. Med. 2005; 53: 1432–1440.
2. Mulkern RV, Gudbjartsson H, Westin CF, et al. Multi-component apparent diffusion coefficients in human brain. NMR Biomed. 1999; 12: 51–62.
3. Sukstanskii AL, Yablonskiy DA. Effects of Restricted Diffusion on MR Signal Formation. J. Magn. Reson. 2002; 157: 92-105. doi: 10.1016/j.jmr.2002.2582
4. Jensen JH, Helpern JA. MRI quantification of non-Gaussian water diffusion by kurtosis analysis. NMR Biomed. 2010; 23(7): 698-710. doi: 10.1002/nbm.1518.
5. Mitra PP. Multiple wave-vector extensions of the NMR pulsed-field-gradient spin-echo diffusion measurement. Phys. Rev. B. Condens. Matter. 1995;51(21): 15074-15078.
6. Jespersen SN. Equivalence of double and single wave vector diffusion contrast at low diffusion weighting. NMR in Biomed. 2011; 25(6), 813-818. doi:10.1002/nbm.1808.
7. Jespersen SN, Lundell H, Sønderby CK, Dyrby TB. Orientationally invariant metrics of apparent compartment eccentricity from double pulsed field gradient diffusion experiments. NMR Biomed. 2013; 26(12):1647-62. doi: 10.1002/nbm.2999.
8. Jensen JH, Hui ES, Helpern JA. Double-pulsed diffusion kurtosis imaging. NMR Biomed. 2014; 27(4):363-70. doi:10.1002/nbm.3030.
9. Hui ES, Jensen JH. Double‐pulsed diffusional kurtosis imaging for thein vivo assessment of human brain microstructure. Neuroimage. 2015;120: 371‐381. doi: 10.1016/j.neuroimage.2015.07.013
10. Westin CF, Knutsson H, Pasternak O, et al. Q-space trajectory imaging for multidimensional diffusion MRI of the human brain. Neuroimage. 2016;135: 345-362.
11. Topgaard D. Multidimensional diffusion MRI. J Magn Reson. 2017; 275:98-113. doi: 10.1016/j.jmr.2016.12.007
12. Drobnjak I, Zhang H, Hall MG, Alexander DC. The matrix formalism for generalised gradients with time-varying orientation in diffusion NMR. J Magn Reson. 2011; 210(1): 151-157. doi: 10.1016/j.jmr.2011.02.022.
13. Paulsen JL, Özarslan E, Komlosh ME, Basser PJ, Song YQ. Detecting compartmental non‐Gaussian diffusion with symmetrized double‐PFG MRI. NMR Biomed. 2015;28:1550‐1556.
14. Ji Y, Pailsen J, Zhou IY, et al. In vivo microscopic diffusional kurtosis imaging with symmetrized double diffusion encoding EPI. Magn Reson Med. 2018 (In press). doi: 10.1002/mrm.27419.
Figures