3463
Diffusion Dispersion Imaging: Mapping OGSE Frequency Dependence in the In Vivo Human Brain1Centre for Functional and Metabolic Mapping, Robarts research institute, Western university, London, ON, Canada
Synopsis
Oscillating gradient spin-echo (OGSE) diffusion MRI allows measurement of the frequency dependence of the apparent diffusion coefficient (ADC), which gives insight into tissue microstructure. OGSE has been utilized in numerous animal models, but its application in the in vivo human brain is challenging. Further, a parameterization that allows visualization of maps of the frequency dependence of ADC throughout the human brain has thus-far not been demonstrated. In this work, we report on an efficient method to generate maps of diffusion dispersion (DD), which characterizes the frequency dependence of the ADC, and demonstrate full-brain DD mapping in vivo at 7T.
Introduction
Measurement of MRI signal attenuation due to water diffusion (dMRI) is a powerful MRI contrast mechanism that gives insight into the microstructural characteristics of tissue. The apparent diffusion coefficient (ADC) measured by dMRI generally depends on the diffusion time. Traditional dMRI methods employ pulsed gradient spin-echo (PGSE) diffusion encoding with long diffusion times (> 20ms in human MRI systems). Oscillating gradient spin-echo (OGSE) diffusion encoding enables access to shorter diffusion times1, where diffusion time scales inversely with the frequency of gradient oscillations. OGSE frequency dependence has been reported in animal models of stroke2,3, multiple sclerosis4, and cancer5. The exploration of frequency dependence of ADC in the human brain could provide new biomarkers for disease and potentially provide a better understanding of mechanisms behind pathologies. However, in vivo OGSE is challenging and human reports of it have been limited6–8. In these previous studies, low b-values (≤ 300 s/mm2) were used as a trade-off to access higher OGSE frequencies, leading to reduced contrast-to-noise ratios (for b>0 versus b=0) compared to standard dMRI. Accordingly, scan times were long and ADC frequency dependence was explored only in large regions of interest. Further, given the low b-values, these studies were potentially impacted by perfusion9,10. In this work, we report on an efficient method to generate maps of the frequency dependence of ADC, the “diffusion dispersion”, that is robust against perfusion and Gibbs ringing and demonstrate it in vivo at 7 T.Theory
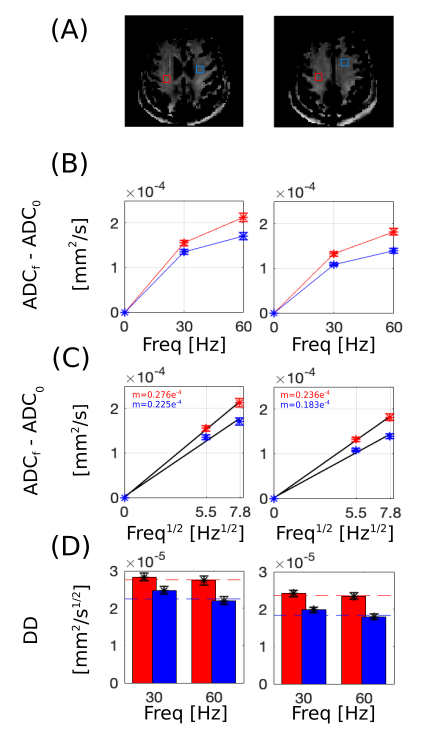
To develop images reflecting ADC change with frequency, we define the diffusion dispersion (DD):$$DD=\frac{ADC_{f}-ADC_{f0}}{\sqrt{f}}$$$$=\frac{-\ln(\frac{S_{f}}{S_{0}})+\ln(\frac{S_{f0}}{S_{0}})}{b\sqrt{f}}$$$$=\frac{\ln(\frac{S_{f_{0}}}{S_{f}})}{b\sqrt{f}}$$where S0 is the b0 image, and Sf and Sf0 are the diffusion weighted images at frequency f>0 and f=0, respectively. The $$$\sqrt{f}$$$-dependence was assumed due to theoretical predictions11 and animal findings9. Notably, b=0 images are not required for DD computation, which has several advantages: (1) DD has a lower sensitivity to perfusion than ADC9,10. (2) CSF signal changes drastically between b=0 and b>0 scans, creating large errors from Gibbs ringing12. However, CSF signal is much more consistent between different frequencies, mitigating this effect for DD. (3) Reduced scan times, improving potential for clinical translation.Methods
OGSE diffusion encoding with single shot EPI was implemented in a healthy volunteer on a 7T head-only system (80 mT/m strength and 350 T/m/s slew rate). PGSE (diffusion time 55 ms) and cosine-modulated trapezoidal OGSE waveforms6 with frequencies of 30Hz and 60Hz were implemented (b=565 s/mm2, 4 direction tetrahedral encoding8 with 10 averages each, 15 b0 acquisitions, TE/TR=111/5500 ms, FOV=200x200 mm2, 2.5 mm isotropic in-plane resolution, 32 slices (3 mm), scan time 15 min). Registration between diffusion directions and frequencies was performed using FSL eddy.Results
Sample PGSE and OGSE ADC maps and DD maps are shown in Fig. 1, where uniform DD values are observed throughout the brain tissue. As expected, DD maps have much lower Gibbs ringing than ADC maps (Fig. 2), and ADC increases approximately linearly with $$$\sqrt{f}$$$ (Fig. 3a-c). Accordingly, DD measurements at both 30Hz and 60Hz are comparable to the result from regression across all frequencies (Fig. 3d).Discussion
Maps of diffusion dispersion (DD) were demonstrated for the first time in the in vivo human brain, with b=565 s/mm2 at the peak frequency of 60Hz. New clinical systems come equipped with 80mT/m gradients, and SNR advantages of 7T were modest at TE=111ms; accordingly, similar quality DD maps may be feasible on clinical systems. Notably, the scan time to create the 60Hz DD maps would have been only 7 minutes with no b=0 or 30Hz acquisitions. For DD to be insensitive to perfusion, the perfusion signal must be much less than the tissue signal at both frequencies used in Eq. 1. In mice, no dependence on perfusion was observed up to 200Hz for b>300 s/mm2 9; accordingly, this assumption was likely satisfied for our b-value of 565 s/mm2 and maximum frequency of 60Hz. The obtained results demonstrate the feasibility of robust, time-efficient acquisition of parameter maps characterizing OGSE frequency dependence of ADC.Acknowledgements
Canada First Research Excellence Fund to BrainsCANReferences
1. Schachter, M., Does, M. D., Anderson, A. W. & Gore, J. C. Measurements of restricted diffusion using an oscillating gradient spin-echo sequence. J. Magn. Reson. 147, 232–237 (2000).
2. Wu, D., Martin, L. J., Northington, F. J. & Zhang, J. Oscillating gradient diffusion MRI reveals unique microstructural information in normal and hypoxia-ischemia injured mouse brains. Magn. Reson. Med. 72, 1366–1374 (2014).
3. Does, M. D., Parsons, E. C. & Gore, J. C. Oscillating gradient measurements of water diffusion in normal and globally ischemic rat brain. Magn. Reson. Med. 49, 206–215 (2003).
4. Aggarwal, M., Jones, M. V., Calabresi, P. A., Mori, S. & Zhang, J. Probing mouse brain microstructure using oscillating gradient diffusion MRI. Magn. Reson. Med. 67, 98–109 (2012).
5. Colvin, D. C. et al. New insights into tumor microstructure using temporal diffusion spectroscopy. Cancer Res. 68, 5941–5947 (2008).
6. Baron, C. A. & Beaulieu, C. Oscillating gradient spin-echo (OGSE) diffusion tensor imaging of the human brain. Magn. Reson. Med. 72, 726–736 (2014).
7. Baron, C. A. et al. Reduction of Diffusion-Weighted Imaging Contrast of Acute Ischemic Stroke at Short Diffusion Times. Stroke 46, 2136–2141 (2015).
8. Van, A. T., Holdsworth, S. J. & Bammer, R. In vivo investigation of restricted diffusion in the human brain with optimized oscillating diffusion gradient encoding. Magn. Reson. Med. 71, 83–94 (2014).
9. Wu, D. & Zhang, J. The Effect of Microcirculatory Flow on Oscillating Gradient Diffusion MRI and Diffusion Encoding with Dual-Frequency Orthogonal Gradients (DEFOG). Magn. Reson. Med. 77, 1583–1592 (2017).
10. Le Bihan, D. et al. Separation of diffusion and perfusion in intravoxel incoherent motion MR imaging. Radiology 168, 497–505 (1988).
11. Novikov, D. S., Jensen, J. H., Helpern, J. A. & Fieremans, E. Revealing mesoscopic structural universality with diffusion. Proc. Natl. Acad. Sci. U. S. A. 111, 5088–5093 (2014).
12. Veraart, J., Fieremans, E., Jelescu, I. O., Knoll, F. & Novikov, D. S. Gibbs ringing in diffusion MRI. Magn. Reson. Med. 76, 301–314 (2016).
Figures