3461
Assessment of microstructural changes during intervertebral disc degeneration by diffusion kurtosis imaging1Radiological Department, Tongji Hospital, Tongji Medical College, HUST, Wuhan, China, 21.Radiology Dept., 2. Bioengineering Dept., College of Medicine, University of Illinois at Chicago, Chicago, IL, United States
Synopsis
To assess the microstructural changes of intervertebral disc degeneration, 18 rats were punctured percutaneously at the intervertebral disc, and the rats’ tail was imaged with T2WI, DWI and DKI sequences. The diffusion parameters changes were consistent with the histological changes at the different time points and showed significant differences between the different groups. And, DKI parameters were better markers to detect the change of microstructure of the degenerated discs than conventional DWI. Therefore, DKI is a noninvasive technique to test the changes of the microstructure of the intervertebral discs.
Assessment of microstructural changes during intervertebral disc degeneration by diffusion kurtosis imaging
INTRODUCTION: Degenerative disc disease (DDD) is considered to be one of the major causes of low back pain. The microstructure, biochemistry and biomechanics of the intervertebral discs undergo a series of complex and continuous changes, leading to the loss of the disc function [1]. Diffusion-weighted image (DWI) has been used to show the loss of water content in degenerated disc, but lacks microstructural insight [2], while diffusion kurtosis imaging (DKI) has been widely used for detection of microstructural tissue changes [3]. In a previous study, we have found that DKI can show differences in the microstructure of the intervertebral disc between sexes and between grade 1 and 2 degeneration during the normal development in healthy rats [4]. The aim in this study was to assess the microstructural changes of intervertebral disc degeneration induced by annulus needle puncture [5] in rats by DKI.
METHODS: 18 rats were punctured percutaneously in the nucleus pulposus of the intervertebral discs between C6/7, C7/8 (C-coccygeal vertebrae) with a 21G needle. The rats were divided into six groups according to the time after the puncture: 3 hours, 48 hours, 3 days, 7 days, 10 days and 14 days. Rats in the control group (n=3) were not punctured. The rats’ tail was imaged at a 3T MRI scanner by T2-weighted image (T2WI), DWI and DKI sequences. The discs were categorized using a five-grade degeneration system based on the T2 images [6]. The multiparametric analysis included the following: height of the discs from T2WI, apparent diffusion coefficient (ADC) from DWI, fractional anisotropy (FA), mean diffusivity (MD), axial diffusivity (Da), radial diffusivity (Dr), mean kurtosis (MK), axial kurtosis (Ka) and radial kurtosis (Kr) from DKI. All parameters were compared between the groups at different time points by ANOVA test with a post hoc test. Histological H&E slices were also obtained from the corresponding imaged discs.
RESULTS: The histological study revealed that the discs in the rat of the punctured groups were degenerated (Figure 1). In particular, histology showed edema in the discs, fibers inner loop getting loose and the nucleus pulposus cell density decreasing in the first 3 days. After edema was reabsorbed, fibrotic tissue started to form in the discs. No significant change in the disc height from T2WI was reported before 10 days after the puncture. ADC was significantly increased at 48hrs, reaching a plateau at 3 days. MD, Da and Dr instead showed significant variation compared to the control group already at 3 hours and progressively increased until 3 days, after which decreased significantly. FA, MK, Ka and Kr conversely decreased after the puncture and recovered after 3 days (Figure 2).
DISCUSSION AND CONCLUSION: The diffusion parameters changes were consistent with the histological changes. The development of edema, the cellular loss in the nucleus pulposus and the extracellular matrix increase were reflected in increased ADC, MD, Da, Dr and decrease of MK, Ka, Kr, FA. DKI parameters showed better sensitivity than DWI, leading to an earlier detection of the changes (3 hours vs 48 hours). Moreover, the edema reabsorption and the fibrosis process, starting after 3 days, were detected by the inversion of the DKI parameters changes. In conclusion, DKI was proven to be a noninvasive and quantitative technique that can detect changes in the intervertebral discs microstructure. Multi-parameters DKI analysis has shown to be sensitive to the microstructural changes in degenerated discs, providing more information than conventional DWI.
Acknowledgements
No acknowledgement found.References
1. Issy AC, Castania V, Castania M, et al. Experimental model of intervertebral disc degeneration by needle puncture in Wistar rats. Braz J Med Biol Res. 2013. 46(3): 235-44.
2. Li LY, Wu XL, Roman RJ, Fan F, Qiu CS, Chen BH. Diffusion-weighted 7.0T Magnetic Resonance Imaging in Assessment of Intervertebral Disc Degeneration in Rats. Chin Med J (Engl). 2018. 131(1): 63-68
3. Wang WT, Yang L, Yang ZX, et al. Assessment of Microvascular Invasion of Hepatocellular Carcinoma with Diffusion Kurtosis Imaging. Radiology. 2018. 286(2): 571-580.
4. Li L, Zhu W, Chen W, Fang J, Li J. The study of the intervertebral disc microstructure in matured rats with diffusion kurtosis imaging. Magn Reson Imaging. 2017. 42: 101-106.
5. Hsieh AH, Hwang D, Ryan DA, Freeman AK, Kim H. Degenerative anular changes induced by puncture are associated with insufficiency of disc biomechanical function. Spine (Phila Pa 1976). 2009. 34(10): 998-1005.
6. Pfirrmann CW, Metzdorf A, Zanetti M, Hodler J, Boos N. Magnetic resonance classification of lumbar intervertebral disc degeneration. Spine (Phila Pa 1976). 2001. 26(17): 1873-8.
Figures
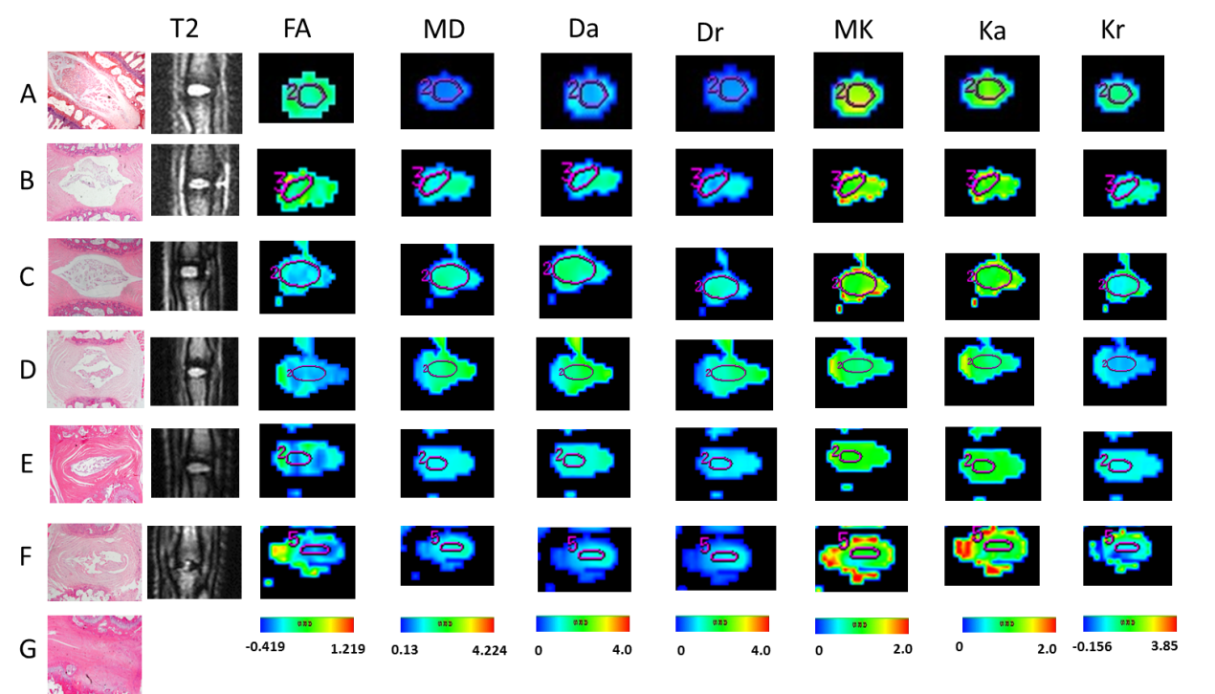
Figure 1. Histological (H&E) staining, T2 images and DKI multi-parameter maps at different time points. From up to down: A. baseline; B. 3 hours after the puncture; C. 48 hours after the puncture; D. 3 days after the puncture; E. 7 days after the puncture; F. 10 days after the puncture; G. 14 days after the puncture. (Because the signal intensity of the intervertebral discs at 14 days was extremely weak in the T2-weighted, DWI and DKI sagittal sections, there is no map.)
The purple circles were the ROI of different parameters.
From left to right: Histology, FA, MD, Da, Dr, MK, Ka, and Kr.
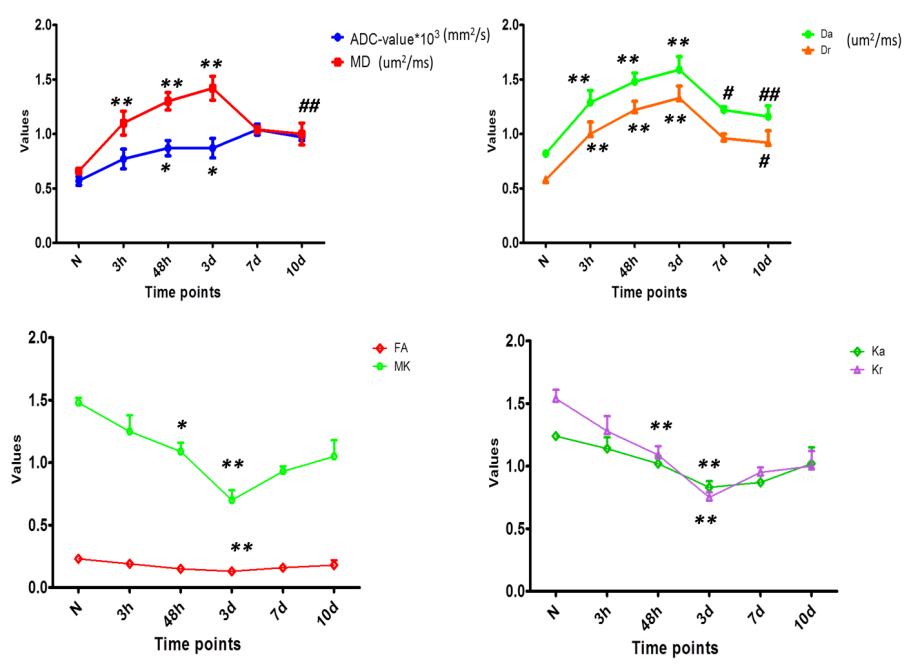
Figure 2. Comparisons of ADC value, DKI parameters (FA, MD, Da, Dr, MK, Ka, Kr) among the groups at different time points. From left to right: N: Normal,3h: 3 hours after puncture; 48h: 48 hours after puncture; 3d: 3 days after puncture; 7d: 7 days after puncture; 10d: 10 days after puncture. When significant differences compared to normal group are present: *P<0.05;** P<0.025;
When significant differences compared to 3 days after puncture group are present: # P<0.05; ## P<0.025.