3460
Evaluation the staging of liver fibrosis using diffusion kurtosis imaging: a pilot study1The Second Hospital of Dalian Medical University, Dalian, China, 2The First People’s Hospital of Dalian Jinzhou, Dalian, China, 3GE Healthcare, China, Beijing, China
Synopsis
To investigate the diagnostic value of the quantitative diffusion kurtosis imaging(DKI)parameters in the staging diagnosis of liver fibrosis in rabbits’ model. Twenty-nine successful rabbit models were scanned by a 3T MR scanner (Discovery MR750W, GE,Healthcare, USA). GE AW4.6 Workstation and statistical software helps to evaluate the correlation between quantitative analysis of DKI and METAVIR staging. It is concluded that DKI related parameters might have important diagnostic value for the staging of liver fibrosis.
Introduction
The staging diagnosis of liver fibrosis is valuable for clinicians to judge whether patients can recover their health after anti-fibrosis treatment and avoid the development of liver cirrhosis; Some researches showed DKI may provide a basis for the staging of liver fibrosis with non-invasive. Therefore, this study is to investigate the associations of magnetic resonance DKI related parameters with histological stage of liver fibrosis in rabbits’ model.Material and Methods
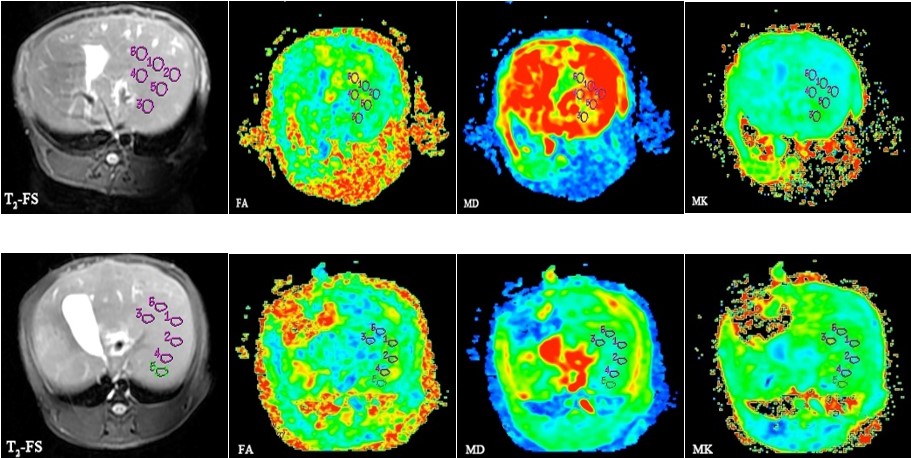
Ethical approval was obtained prior to this study. Thirty-five healthy male rabbits weighing 2.5 to 3 kg were divided into control group (n=5) and experimental group (n=30) by subcutaneous injection of 50% CCL4 in olive oil for 4, 5, 6, and 10 weeks. All the subjects underwent MR examinations on a 3.0T whole body MR scanner equipped with an 8-channel knee coil. DKI was performed for all rabbits which were injected with 10% chloral hydrate through the ear edge vein. The diffusion setting for DKI was performed with 3 b-value (0, 500, 1000 s/ mm2) and 15 directions. Mean diffusion (MD), mean kurtosis (MK), and fractional anisotropy (FA) values were calculated using vendor supplied software. The fibrosis stage was judged by the METAVIR scoring system. Maps were displayed in Figure 1 and Figure 2. Data analysis was performed on SPSS 21.0. The relationship between DKI related parameters and the staging of liver fibrosis were measured by the Spearman’s rank correlation test and variance test. Additionally, receiver operating characteristic (ROC) analysis and the area under the curve (AUC) statistics were applied to evaluate diagnostic performance of DKI related parameters in the staging of liver fibrosis. All tests were two-sided, and P < 0.05 was considered statistically significant.Results
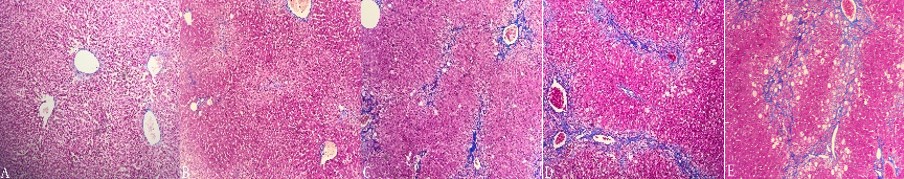
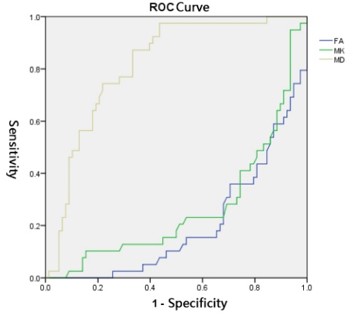
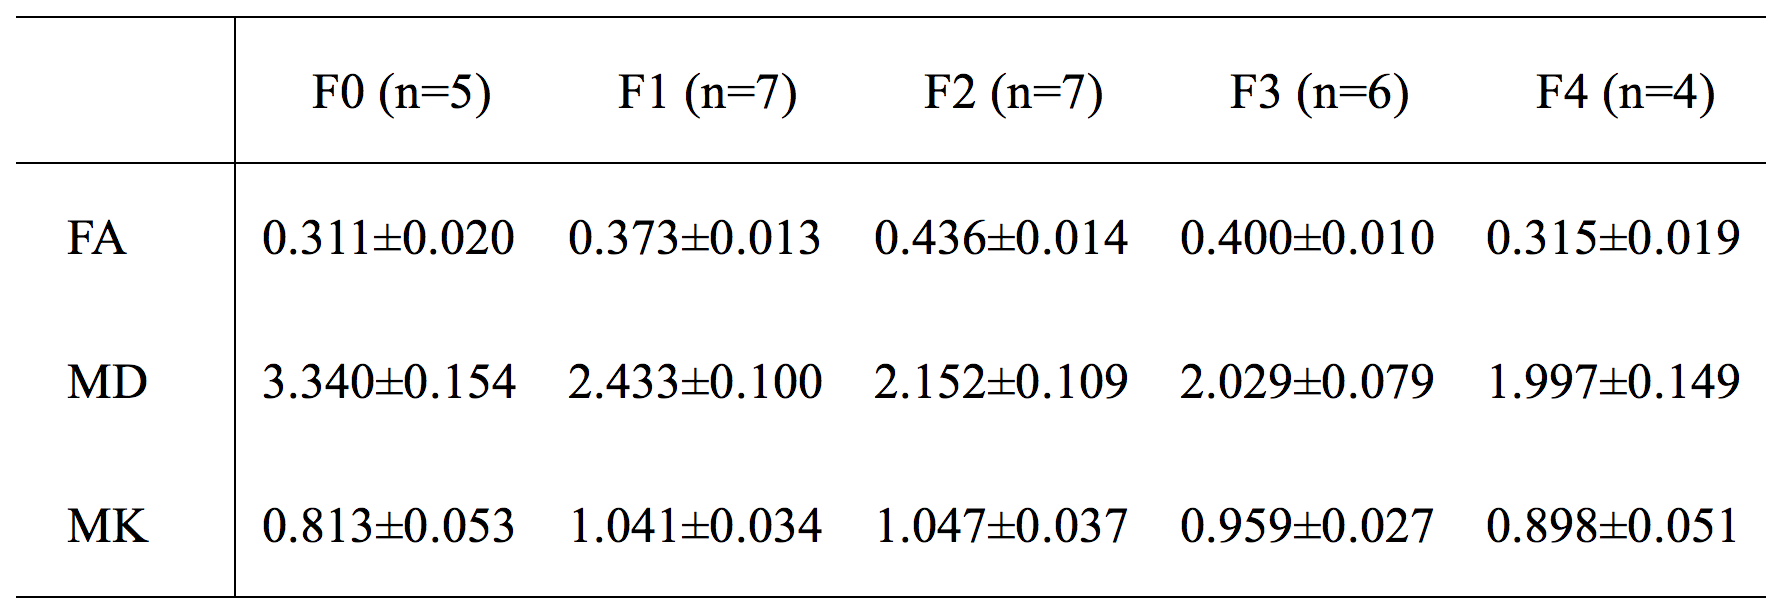
Six rabbits died in experimental group. The procedures were successfully performed in 29 rabbits,called liver fibrosis group. 5, 7, 7, 6, 4 rabbits were diagnosed as F0–F4 by histopathology respectively. Representative images of parametric maps from DKI are shown in Figure 1 for F3 and F4. Figure 2 shows the histology results from different fibrosis stages. As shown in Table 1, with increasing stage of liver fibrosis, MD value decreased (r =-0.306, P<0.01). However, no significant difference in FA and MK values for all groups were observed (all P > 0.05). FA, MD and MK values may distinguish F0 from F2; FA value may distinguish F0 from F3, F1 from F2 and F2 from F4; MD value could distinguish F0 from F1, F0 from F3, F0 from F4 and F1 from F3; MK value could distinguish F0 from F1 (all P < 0.05). In addition, it also discovered that as shown in Figure 3, MD value showed best performance for distinguishing F0 from F1, F0 from F2 and F0 from F3 with AUC of 0.805, 0.815, 0.759 (all P < 0.05), respectively, with AUC of liver DKI parameters.Discussion
Liver fibrosis can lead to excessive deposition of extracellular matrix dominated by collagen in liver tissues and limit the diffusion of water molecules. Diffusion tensor imaging and diffusion kurtosis imaging both reflect the level of diffusion restriction, and DKI may further characterize the non-Gaussian behavior of water diffusion in vivo. It was also observed that FA, MK values in the liver fibrosis group were significantly higher than those in the control group; no correlation was observed between FA, MK values and the severity of liver fibrosis. On the other hand, significant difference was seen between the fibrosis group and the healthy control group: with increasing stage of liver fibrosis, MD value in liver fibrosis group was obviously reduced, and MD values negatively correlated to the severity of liver fibrosis (r= 0.306, P < 0.01). Hence DKI showed better diagnosis efficacy in staging of liver fibrosis.Conclusions
DKI related parameters may hold promise for staging of liver fibrosis; MD is showed best performance for distinguishing F0 from F1, F0 from F2 and F0 from F3.Acknowledgements
No acknowledgement found.References
[1] Yoshimaru D, Miyati T, Suzuki Y, Hamada Y, Mogi N, Funaki A, et al. Diffusion kurtosis imaging with the breath-hold technique for staging hepatic fibrosis: A preliminary study.[J]. Magn Reson Imaging, 2018, 47:33-8.
[2] Sheng RF, Jin KP, Yang L, Wang HQ, Liu H, Ji Y, et al. Histogram Analysis of Diffusion Kurtosis Magnetic Resonance Imaging for Diagnosis of Hepatic Fibrosis.[J]. Korean J Radiol, 2018, 19(5):916-22.
[3] Sheng RF, Wang HQ, Yang L, Jin KP, Xie YH, Chen CZ, et al. Diffusion kurtosis imaging and diffusion-weighted imaging in assessment of liver fibrosis stage and necroinflammatory activity.[J]. Abdom Radiol (NY), 2017, 42(4):1176-82.
[4] Jensen JH, Helpern JA. MRI quantification of non-Gaussian water diffusion by kurtosis analysis.[J]. NMR Biomed, 2010, 23(7):698-710.
Figures