3455
Quantifying diffusion-weighted MRI parameters with cellular infiltration, tissue ingrowth, and angiogenesis to characterize collagen-sponge remodeling.1Athinoula A. Martinos Center for Biomedical Imaging, Massachusetts General Hospital and Harvard Medical School, Charlestown, MA, United States, 2Worcester Polytechnic Institute, Worcester, MA, United States
Synopsis
In vivo evaluation of biomaterial implant remodeling involves surgical removal of the implant for subsequent histological assessment, which is often destructive and limits the effective evaluation of these materials. Diffusion-weighted MRI has the potential to non-invasively monitor the remodeling of collagen scaffolds. This study investigated the role of apparent diffusion coefficient (ADC) from different diffusion regimes to evaluate the remodeling of implanted collagen scaffolds and correlated the findings to conventional histological techniques. Correlations between ADC and histological parameters demonstrated that MRI is sensitive to specific remodeling parameters which can aid in the design of robust biomaterial scaffolds for tissue regeneration.
Introduction
The in vivo evaluation of soft biomaterial implant remodeling routinely requires the surgical removal of the implant for subsequent histological assessment of tissue ingrowth and scaffold remodeling [1]. This invasive approach is often destructive, resource intensive, and limits the effective evaluation of these materials. MRI is a powerful tool that can non-invasively monitor the remodeling of collagen scaffolds, particularly the biodegradation, cellular infiltration, and extracellular matrix deposition within the scaffold [2-4]. Diffusion-weighted (DW) MRI, in particular, reflects restriction of water diffusion and corresponds to parameters such as cell density and spacing between cells [5]. The choice of b-values used in DW-MRI can affect the calculated apparent diffusion coefficient (ADC) as either being in the intravoxel incoherent motion (IVIM) regime [6] (b<200 s/mm2), traditional ADC (calculated using b=0 and 1000 s/mm2) regime, or in the kurtosis regime [7] (b>1000 s/mm2). This study investigated the role of ADC from the aforementioned diffusion regimes to evaluate the remodeling of implanted collagen scaffolds and correlated the findings to conventional histological techniques.Methods
Sponges were fabricated using scaffolds prepared from insoluble bovine collagen as described in [8]: 1) the first type was crosslinked with 1-ethyl-3-(3-dimethyl aminopropyl) carbodiimide (EDC) to increase resistance to biodegradation; 2) the second type, chondroitin 6-sulphate (CS), was used with EDC (EDC+CS) to increase the biocompatibility of the sponge, and; 3) the third type was hydrated in MES buffer only and designated as uncrosslinked (UnX). Two of each sponge type was implanted in dorsal subcutaneous pockets of Sprague-Dawley rats (Fig. 1A, n=7). Two days after surgery and then weekly for up to 6 weeks, MRI was performed at 2.0T to image the sponges. DW-MRI was performed using a spin-echo, echo-planar imaging pulse sequence with diffusion-sensitive gradient pulses (b = 23, 92, 207, 828, 1126, and 1471 s/mm2) applied along three different gradient axes with gradient separation Δ=35ms and gradient duration δ=4ms. Other parameters were: TR/TE=2000ms/53ms, matrix=64×64, slice thickness=2mm, NEX=2. Three different ADC maps were generated (illustrated in Fig. 3B): 1) ADChigh maps using b = 23 and 92 s/mm2 (reflecting the IVIM regime); 2) ADCmid maps using b = 207 and 828 s/mm2 (reflecting the traditional ADC), and; 3) ADClow maps using b = 1126 and 1471 s/mm2 (reflecting the kurtosis regime). Animals were euthanized and sponges were harvested at each of the imaging time points. Histology was performed using Heamotoxylin & Eosin (H&E) and Masson’s trichrome. The cellular density, void area fraction, and blood vessel density of each scaffold was quantified to determine cellular infiltration, overall tissue growth, and angiogenesis into the scaffolds, respectively. Spearman’s correlation was computed for different combinations of MRI and histology parameters from all time points to check for significant relationships.Results and Discussion
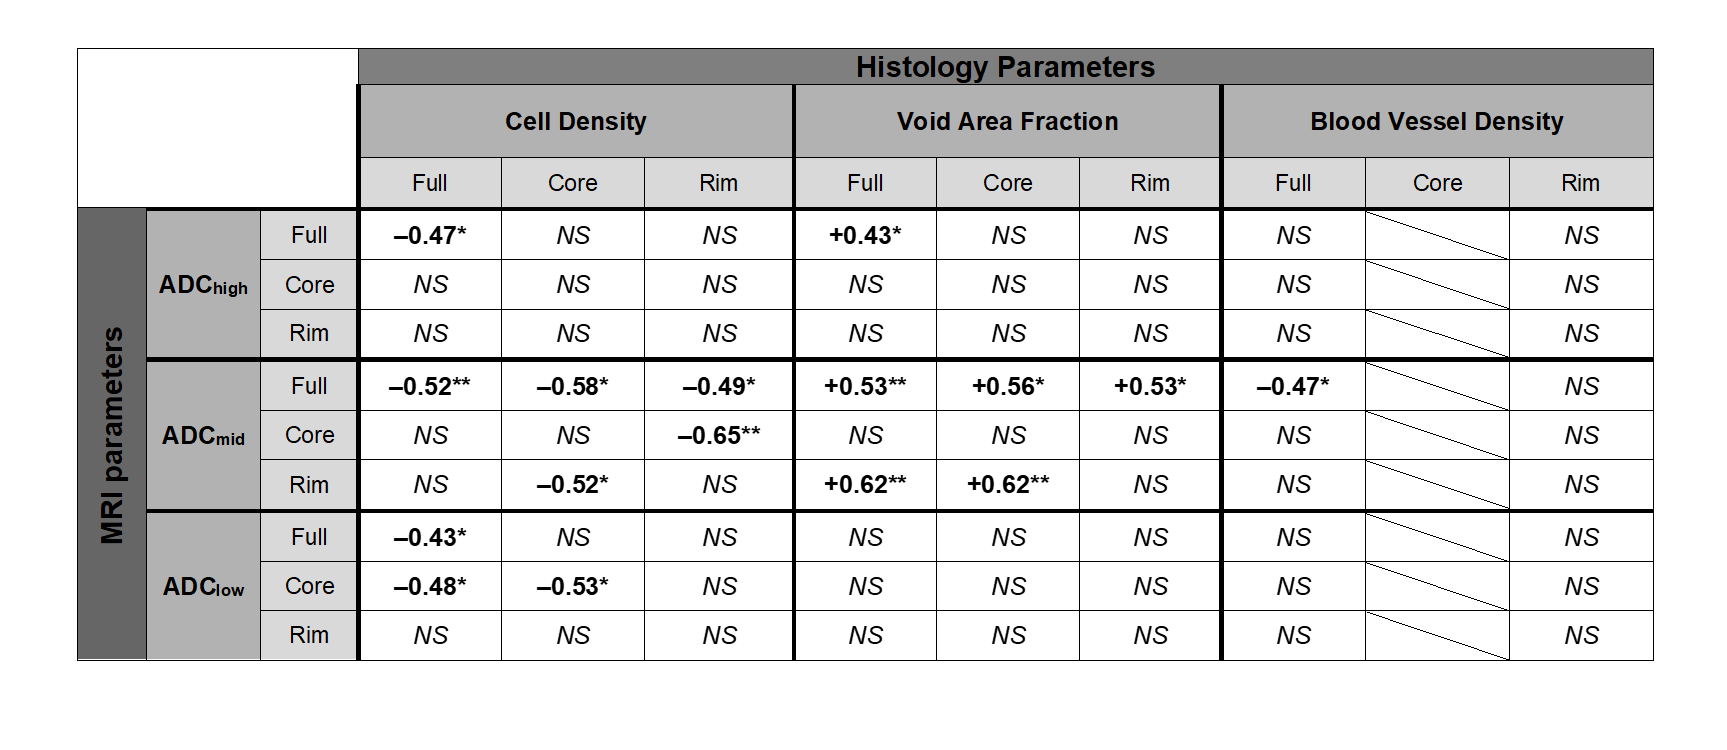
The initial H&E section from the sponges showed lattice-like matrix appearing to form a highly porous interconnecting network with a rim comprised of a thin layer of infiltrated cells (EDC in Fig. 1B). With time, the rim showed a higher degree of cellular infiltration and the core showed little remaining porous structure, which progressively became more homogeneous with complete cellular infiltration and integration with surrounding tissues. The cell density, blood vessel density, and void area fraction were quantified for each type of sponge from the histology (Fig. 2). In general, the cell density of the sponges increased with time more so along the rim region compared to the core (Fig. 2A‒C), which is clearly reflected in all ADC maps (EDC in Fig. 3C) as a decrease in ADC signal up to day 14 (EDC in Fig. 4D‒F). The ADCmid and ADClow measurements more closely reflect this change at the later time-points reflecting the restriction of water due to presence of cells (Fig. 4E‒F). The crosslinked scaffolds showed an increase in blood vessel density at the later time-points (Fig. 2D‒F). The ADChigh map at day 35 captures this increase with an increase in ADC signal indicating presence of free water in blood vessels (Figs. 3C & 4D). The void area fraction steadily decreased with time for all scaffolds (Fig. 2G‒I), which is best reflected by ADCmid measurements (Fig. 4E).Conclusion
Correlations in Fig. 5 show statistically significant relationships between cellular density and void area, and the three ADC measurements demonstrating that each diffusion regime of ADC is sensitive to the specific remodeling parameters. Understanding the relationship between histology and DW-MRI parameters can help guide the interpretation of MRI data as well as to reliably detect changes within implants using MRI data alone, reducing the need for scaffold harvesting and destructive testing.Acknowledgements
No acknowledgement found.References
1. Peptan IA, Hong L, Xu H et al. MR assessment of osteogenic differentiation in tissue-engineered constructs. Tissue Eng. 2016;12:843-851.
2. Packer KJ. The dynamics of water in heterogeneous systems. Phil Trans R Soc Lond. 1977;278:59-87.
3. Traoré AS, Woerly S, Doan VD et al. In vivo magnetic resonance imaging and relaxometry study of a porous hydrogel implanted in the trapezius muscle of rabbits. Tissue Eng. 2000;6:265-278.
4. Märtson M1, Viljanto J, Laippala P et al. Cranio-caudal differences in granulation tissue formation: an experimental study in the rat. Wound Repair Regen. 1999;7:119-126;
5. Padhani AR, Liu G, Koh DM et al. Diffusion-weighted magnetic resonance imaging as a cancer biomarker: consensus and recommendations. Neoplasia. 2009;11(2):102-25.
6. Le Bihan D, Breton E, Lallemand D et al. MR imaging of intravoxel incoherent motions: applications to diffusion and perfusion in neurologic disorders. Radiology. 1986;161:401-407.
7. Jensen JH, Helpern JA, Ramani A et al. Diffusional kurtosis imaging: the quantification of non-Gaussian water diffusion by means of magnetic resonance imaging. Magn Reson Med. 2005;53:1432-1440.
8. Pieper JS, van Wachem PB, van Luyn MJA et al. Attachment of glycosaminoglycans to collagenous matrices modulates the tissue response in rats. Biomater. 2000;21:1689-1699.
Figures