3454
Histogram analysis of diffusion kurtosis imaging in prostate cancer: comparison with pathology using in-bore transrectal MR-guided biopsy1Beijing Hospital, Beijing, China, 2Philips Healthcare, Beijing, China
Synopsis
Our purpose was to verify the use of DKI histogram analysis for differential diagnosis of prostate cancer and noncancerous foci (benign prostatic hyperplasia and prostatitis). Twenty-three patients underwent MRI subsequently using in-bore transrectal MR-guided biopsy as the pathological reference. Our results showed DKI histogram analysis has favorable effective function and good repeatability for the differential diagnosis. DKI histogram analysis may contribute to improve the diagnostic accuracy.
Introduction
Prostate cancer is one of the most common reasons leading to cancer deaths in men. Previous studies have proved diffusion kurtosis imaging (DKI) may contribute to the differential diagnosis of prostate cancer, prostatitis and benign prostatic hyperplasia (BPH).1-3 But little research has been done in histogram analysis of prostate cancer.4 And the present studies are limited by the performance with a region of interest (ROI) which can perfectly match the pathology. The purpose of this study was to explore the diagnostic performance of DKI histogram analysis approach for differential diagnosis of prostate cancer and noncancerous foci (BPH and prostatitis), by using in-bore transrectal MR-guided biopsy as the pathological reference.Methods
Twenty-three patients were enrolled in this study. All patients underwent magnetic resonance imaging (MRI) examination between March 2017 and April 2018 in our hospital. DKI has been acquired with 9 b values (0, 20, 50, 100, 200, 500, 1000, 1500, 2000 s/mm2). The pathologies were confirmed by subsequently in-bore MR-guided biopsy. Ten patients of them punctured two positions, the rest punctured one position, totally including 16 prostate cancer (5 in peripheral zone, 11 in transition zone) and 17 noncancerous foci (2 in peripheral zone, 15 in transition zone). ROIs were placed on areas of cancerous foci and noncancerous foci in the position of puncture point by two experienced radiologists. One of the two radiologists measured again two weeks later. All the lesions were measured the values of D、K and their histogram parameters. The values of the these parameters in cancer and noncancerous foci were compared using independent-samples T test by SPSS 22.0 statistical analysis software. The Spearman test was used to evaluate the correlation of these parameters and Gleason scores of prostate cancer. Moreover, receiver operating characteristics (ROC) curves were used to test the sensitivity and specificity of these parameters for diagnosing prostate cancer. Areas under the ROC curve (AUC) were calculated. Assess intra- and inter-observer agreement used intraclass correlation (ICC).Results
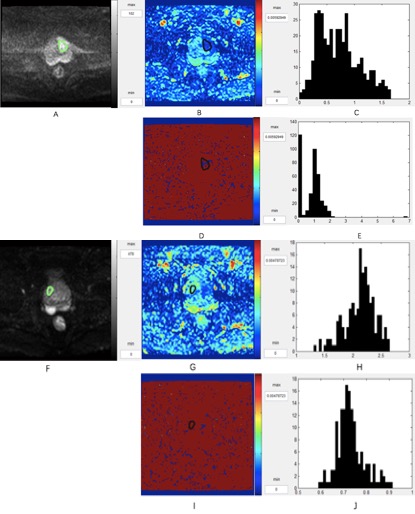
Representative images of a patient are shown in Figure 1. The histogram parameters 10%th, 25%th, 50%th, 75%th, 90%th of D value were significantly lower in prostate cancer than noncancerous foci (p < 0.01). The histogram parameters 50%th, 75%th, 90%th of K value were significantly higher in prostate cancer than noncancerous foci (p < 0.05). There was no significant correlation between these parameters and Gleason scores (p > 0.05). The AUC of 10%th, 25%th, 50%th, 75%th, 90%th of D value were 0.860, 0.904, 0.904, 0.901 and 0.886. The AUC of 50%th, 75%th, 90%th of K value were 0.893, 0.897 and 0.908, and there is no significant difference between these parameters (p > 0.05). The ICC for D value of cancer intra- and inter-observer agreement were 0.935 and 0.974 respectively, for D value of noncancerous foci were 0.977 and 0.934, for K value of cancer were 0.966 and 0.553, for K value of noncancerous foci were 0.904 and 0.838.Discussion
A histogram analysis approach has been shown a promising way in discriminating tumor grade and assessing therapeutic effect of cancer.4-6 We first used DKI histogram in differentiating prostate cancer and noncancerous foci. Our results showed 10%th, 25%th, 50%th, 75%th, 90%th of D value, 75%th, 90%th of K value can provide more information to differentiate prostate cancer and noncancerous foci. But there was no significant correlation between these parameters and Gleason scores. One possible reason is that Gleason scores of all these lesions were more than 6, lacking of low-grade prostate cancer. Another possible reason is lack of samples. The high intraclass correlation coefficients in the inter- and intra-observer analysis suggest that DKI histogram analysis is sufficiently reproducible. We found that the inter-observer agreement for K value of cancer was lower than others. We thought the main reason seems to be that K is associated with tissue complexity and prostate cancer is heterogeneous, and the standard deviation was large. Thus this may cause the uncertainty of the measurements.Conclusion
DKI histogram analysisis credible and reliable, and these parameters may contribute to differential diagnosis of prostate cancer and noncancerous foci.Acknowledgements
No acknowledgement found.References
1. Tamura C, Shinmoto H, Soga S, et al. Diffusion kurtosis imaging study of prostate cancer: preliminary findings. J Magn Reson Imaging. 2014;40(3):723-729.
2. Roethke MC, Kuder TA, Kuru TH, et al. Evaluation of Diffusion Kurtosis Imaging Versus Standard Diffusion Imaging for Detection and Grading of Peripheral Zone Prostate Cancer. Invest Radiol. 2015;50(8):483-489.
3. Suo S, Chen X, Wu L, et al. Non-Gaussian water diffusion kurtosis imaging of prostate cancer. Magnetic Resonance Imaging. 2014;32(5):421-427.
4. Wang Q, Li H, Yan X, et al.Histogram analysis of diffusion kurtosis magnetic resonance imaging in differentiation of pathologic Gleason grade of prostate cancer. Urol Oncol. 2015;33(8):337 e15-24.
5. Kim HS, Suh CH, Kim N, et al. Histogram analysis of intravoxel incoherent motion for differentiating recurrent tumor from treatment effect in patients with glioblastoma: initial clinical experience. AJNR Am J Neuroradiol. 2014;35(3):490-497.
6. Kang Y, Choi SH, Kim YJ, et al. Gliomas: Histogram analysis of apparent diffusion coefficient maps with standard- or high-b-value diffusion-weighted MR imaging--correlation with tumor grade. Radiology. 2011;261(3):882-890.
Figures