3451
Predicting Renal Glomerular Filtration Rate of Children with Account of Kidney Compensation Using Multiple b Values Diffusion-Weighted Imaging1Radiology Department, Wuhan Children's Hospital, Tongji Medical College,Huazhong University of Science&Technology, Wuhan, China, 2Department of Nephrology, Wuhan Children's Hospital, Tongji Medical College,Huazhong University of Science&Technology, Wuhan, China, 3FITPU Healthcare Ltd, Singapore., Singapore
Synopsis
GFR would fail to tell the functional status of each kidney for CKD cases,so we try to use machine learning methods to predict GFR of pediatric kidneys based on the IVIM diffusion parameters. The results is that,With account of kidney compensation, averaged correlation between predicted and measured GFR up to 0.9 (p < 0.05) was obtained for the combination of perfusion-fraction f and pseudo-flow fD*. For comparison, if not taking into account kidney compensation, the best predictor attained the correlation of 0.3. We conclude that a noninvasive method can predict well the GFR of children with kidney diseases using multiple b values DWI. The best predictions involved the use of perfusion-fraction f and pseudo-flow fD* which are closely related to renal blood perfusion.
Introduction
Congenital renal disorders including congenital anomalies of the kidney and urinary tract (CAKUT) and hereditary nephropathies accounts for about 60% of all pediatric chronic kidney disease (CKD) cases in developed countries 1. The accurate evaluation of bilateral renal function to these patients is essential for the diagnosis and management of these diseases. especially independent assessment of each kidney in early stage. GFR estimated from blood or urine creatinine would fail to tell the functional status of each kidney for CKD cases. ADC and IVIM parameters have been found to show moderate correlation with GFR estimated from serum creatinine 2-7 urine creatinine 8 or dynamic renal scintigraphy 9-11 measurements. We try to use machine learning methods K-NN and SVM to predict GFR values based on diffusion parameter values obtained from post-processing DW images of diseased children kidneys.But there are several avenues to improve our current study: (1) More patient data especially with GFR below 60 ml/min/1.73m2 (currently only 11 patients) would improve our prediction in the low GFR range; (2) More accurate estimation of GFR for children less than 1 year old, as the NIH recommended “Bedside Schwartz” formula based on serum creatinine and height is not validated for this age group; (3) Determination of single kidney GFR or function by dynamic renal scintigraphy or positron-emission-tomography imaging would be helpful in the further validation of our method; and (4) Though the proposed method with account of kidney compensation has been shown to be effective in GFR prediction, it should be noted that the real mechanism of kidney compensation is much more complicated. More precise modeling of kidney compensation could be a potential research direction in developing more advanced methods for renal function assessment using functional imaging approach.Methods
77 patients (mean age 5.1 years) underwent DWI of the kidneys. Intravoxel incoherent motion (IVIM) diffusion parameters were measured from parenchyma of both kidneys. An optimization algorithm was developed to select left, right or combined kidney parameter values as features for the prediction of estimated GFR (eGFR) using K-nearest neighbors (K-NN) or support vector regression (SVR) machine learning methods.Results
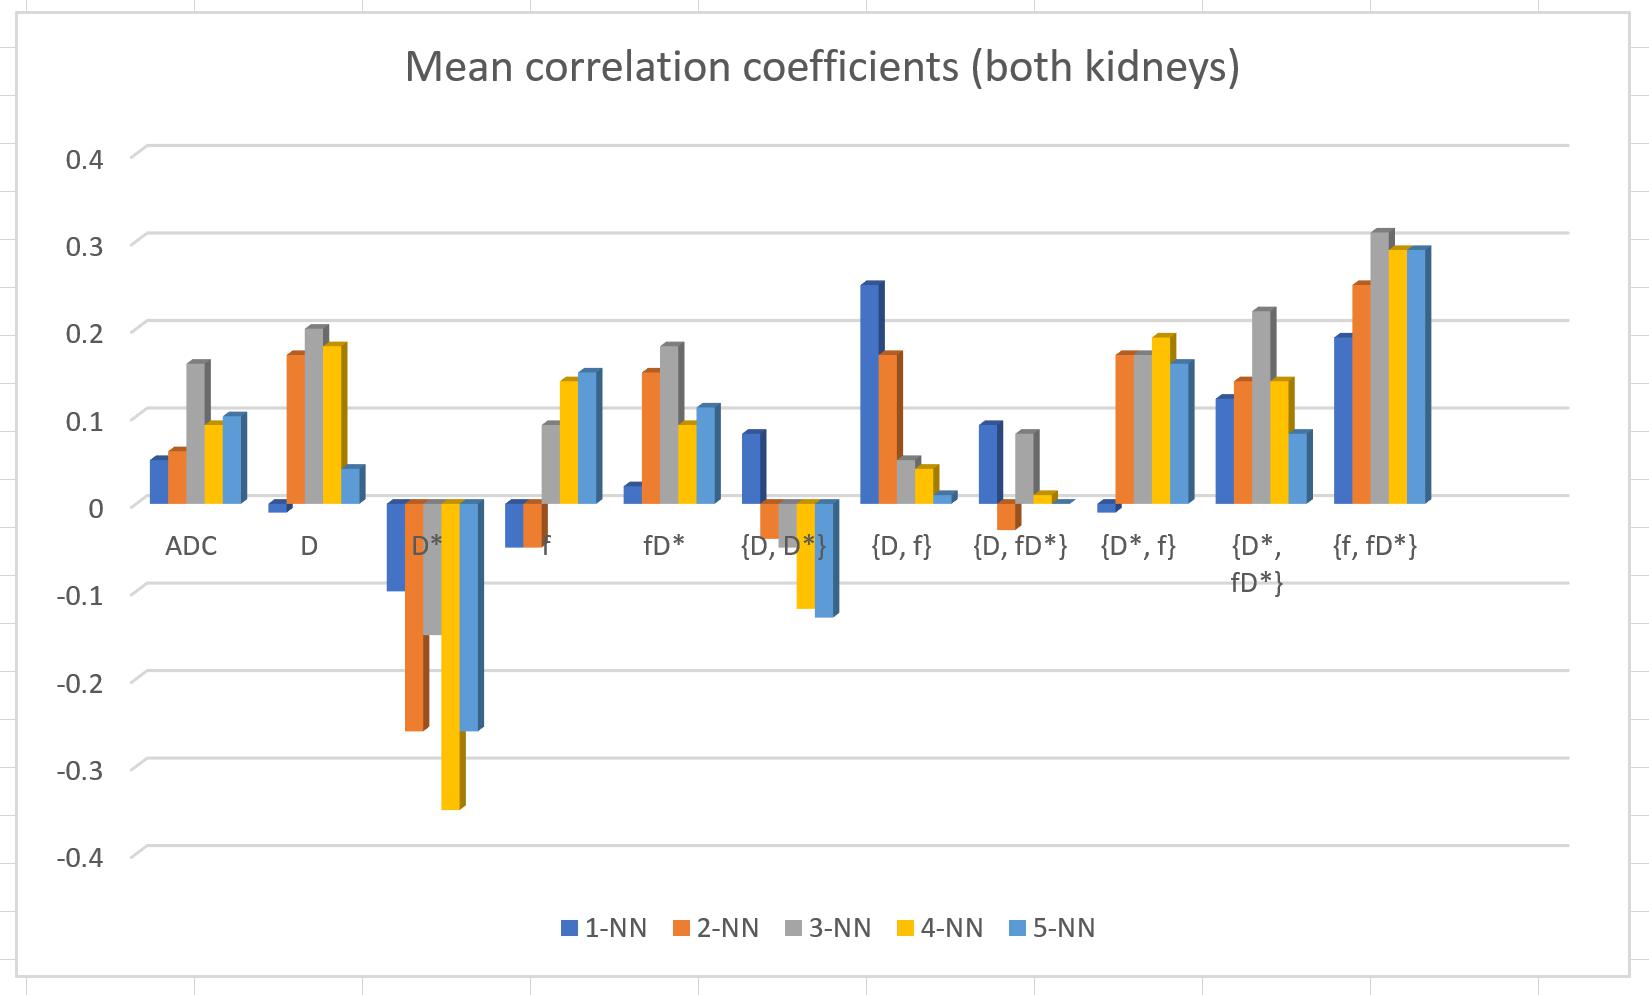
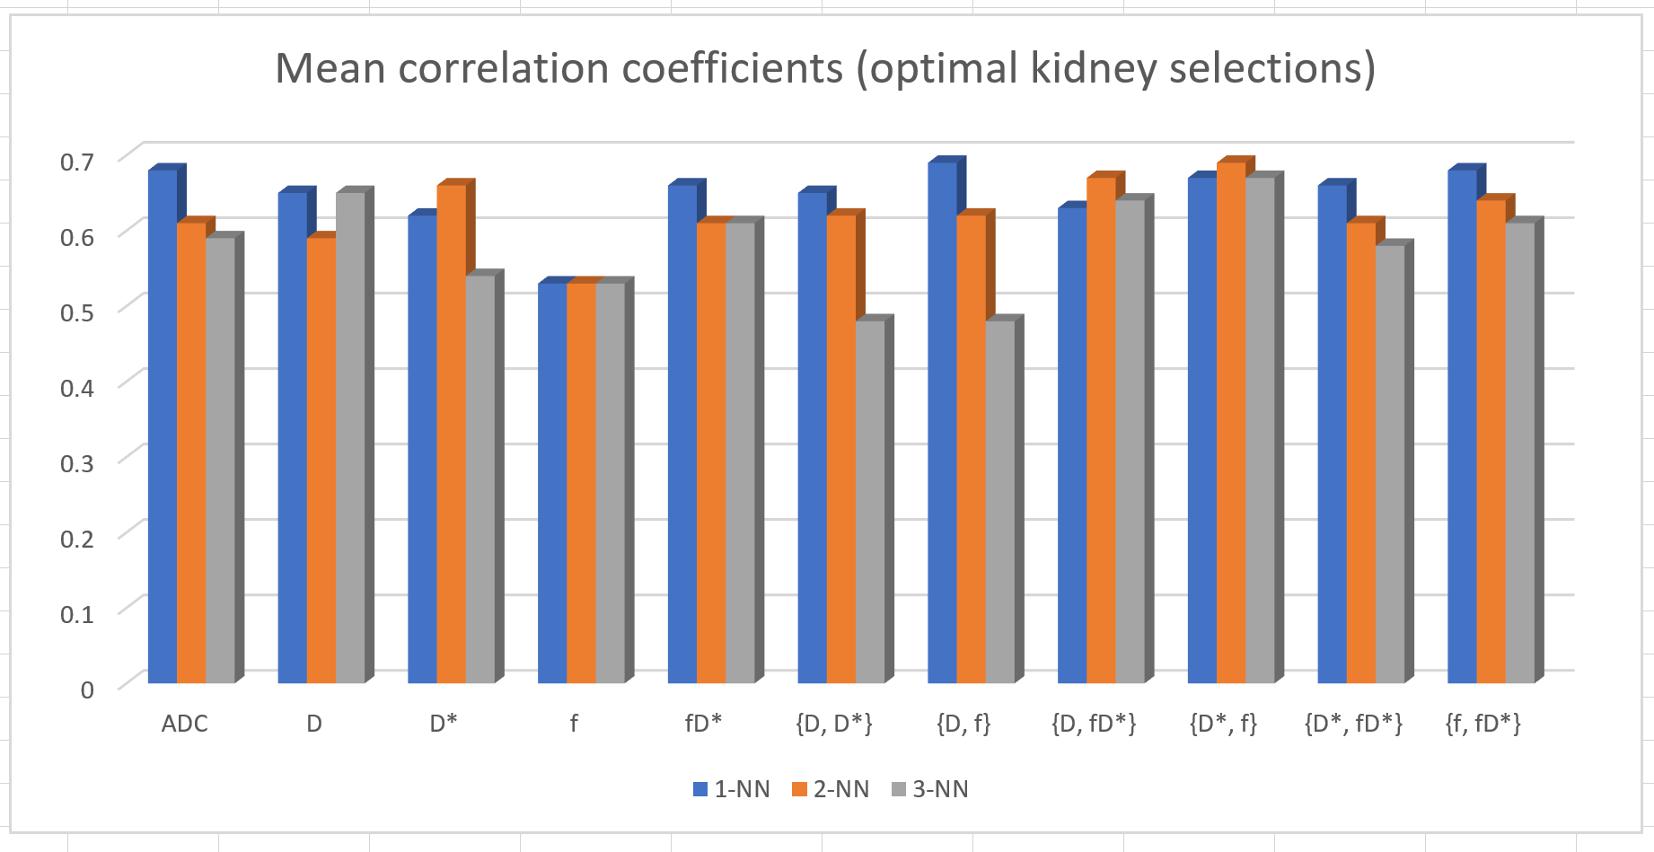
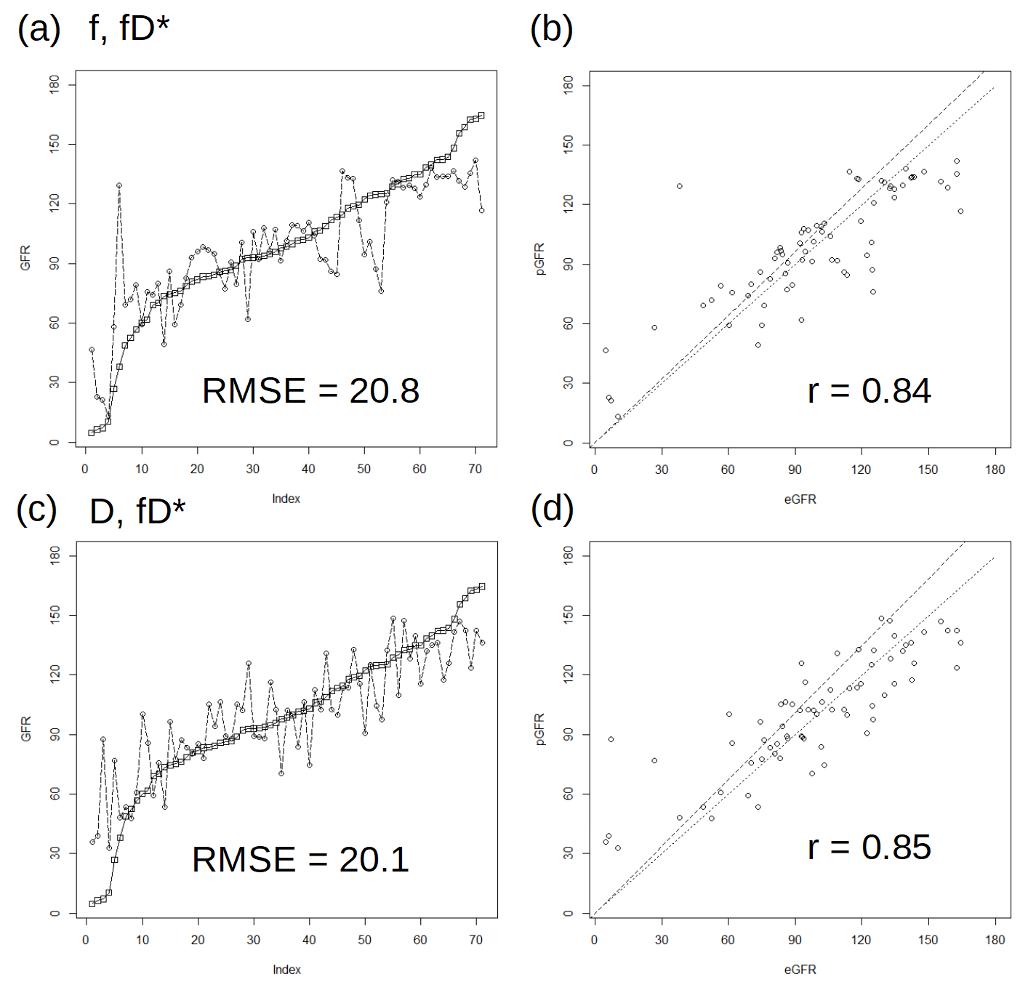
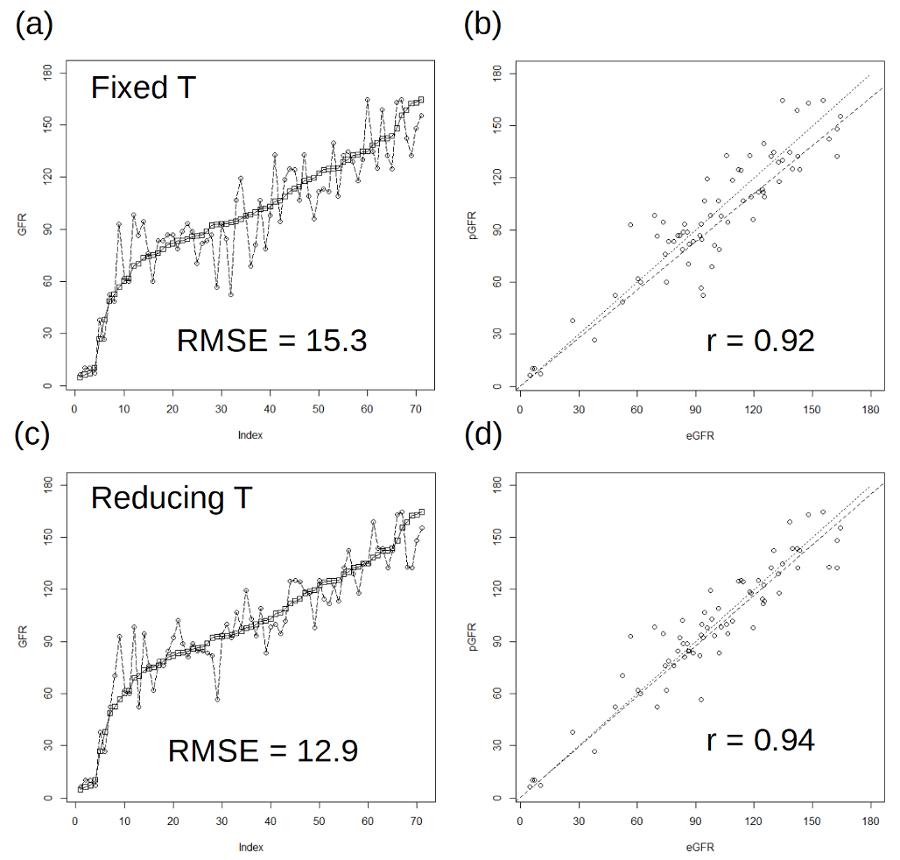
With account of kidney compensation, averaged correlation between predicted and measured eGFR of up to 0.83 (p < 0.05) was obtained for single DWI parameters with 1-NN and fixed simulated annealing ‘temperature’ parameter. When parameters are used in combinations, the perfusion-fraction f and pseudo-flow fD* pair produced the highest correlation of 0.86. Furthermore, by step-wise reducing the ‘temperature’, the average correlation for {f, fD*} with 1-NN increased to 0.9. For comparison, if not taking into account kidney compensation, the best predictor attained the correlation of 0.3.Discussion
In IVIM model, water molecular movement in the tissue to be detected is classfied into two types; one is the diffusion process mostly occurred in the vascular space, and the other is the movement associated with blood perfusion within the vascular space, which is usually named as pseudo-diffusion in IVIM model. Parameter f may be related to renal blood volume in perfused capillaries 7 or micro-circulation of blood and movement in renal tubules12 and was found to correlate with allograft perfusion 13 .The parameter fD* may be interpreted as a ‘pseudoflow’ of blood in the perfused capillaries 14 .Hence, f and fD* may reflect the microcirculation in kidneys. our study showed that the combination of f and fD* attained the most discriminating power of the machine learning method. As the basic function of kidney is to filter blood, a normal kidney could consist of a million of nephrons, each of which contains a cluster of capillaries that most of the water and the substances that are essential to the body are reabsorbed into the blood. Therefore, the vascularity in kidney and its proper function is crutial for renal function, which is highly consistent with the finding in this study.Conclusions
A noninvasive method with account of kidney compensation can predict well the GFR of children with kidney diseases using multiple b values diffusion-weighted imaging. The best predictions involved the use of perfusion-fraction f and pseudo-flow fD* which are closely related to renal blood perfusion.Acknowledgements
References
1. Harambat J, van Stralen KJ, Kim JJ, Tizard EJ: Epidemiology of chronic kidney disease in children. Pediatr Nephrol 2012; 27:363–373.2. Yamada K, Shinmoto H, Oshio K, Ito S, Kumagai H, Kaji T: Diffusion-weighted MR imaging for the assessment of renal function: Analysis using statistical models based on truncated gaussian and gamma distributions. Magn Reson Med Sci 2016; 15:237–245.3. Zhao J, Wang ZJ, Liu M, et al.: Assessment of renal fibrosis in chronic kidney disease using diffusion-weighted MRI. Clin Radiol 2014; 69:1117–1122.4. Ren T, Wen C-L, Chen L-H, et al.: Evaluation of renal allografts function early after transplantation using intravoxel incoherent motion and arterial spin labeling MRI. Magn Reson Imaging 2016; 34:908–914.5. Park SY, Kim CK, Park BK, Kim SJ, Lee S, Huh W: Assessment of early renal allograft dysfunction with blood oxygenation level-dependent MRI and diffusion-weighted imaging. Eur J Radiol 2014; 83:2114–2121.6. Mao W, Zhou J, Zeng M, et al.: Chronic kidney disease: Pathological and functional evaluation with intravoxel incoherent motion diffusion-weighted imaging. J Magn Reson Imaging 2018; 47:1251–1259.7. Schneider MJ, Dietrich O, Ingrisch M, et al.: Intravoxel incoherent motion magnetic resonance imaging in partially nephrectomized kidneys. Invest Radiol 2016; 51:323–330.8. Çakmak P, Yağci AB, Dursun B, Herek D, Fenkçi SM: Renal diffusion-weighted imaging in diabetic nephropathy: Correlation with clinical stages of disease. Diagn Interv Radiol 2014; 20:374–378.9. Lin F, Li Z, Gan Y, et al.: Relationship between renal apparent diffusion coefficient values and glomerular filtration rate in infants with congenital hydronephrosis. BioSci Trends 2014; 8:274–279.10. Toyoshima S, Noguchi K, Seto H, Shimizu M, Watanabe N: Functional evaluation of hydronephrosis by diffusion-weighted MR imaging. Relationship between apparent diffusion coefficient and split glomerular filtration rate. Acta Radiologica 2000; 41:642–646.11. Xu Y, Wang X, Jiang X: Relationship between the renal apparent diffusion coefficient and glomerular filtration rate: Preliminary experience. J Magn Reson Imaging 2007; 26:678–681.12. Eisenberger U, Thoeny HC, Binser T, et al.: Evaluation of renal allograft function early after transplantation with diffusion-weighted MR imaging. Eur Radiol 2010; 20:1374–1383.13. Heusch P, Wittsack H-J, Heusner T, et al.: Correlation of biexponential diffusion parameters with arterial spin-labeling perfusion MRI: results in transplanted kidneys. Invest Radiol 2013; 48:140–144.14. Le Bihan D, Turner R: The capillary network: a link between ivim and classical perfusion. Magn Reson Med 1992; 27:171–178.Figures