3450
Diffusion time-dependence of diffusivity and kurtosis in locally advanced head and neck squamous cell carcinoma before and after chemo-radiation therapy1Radiology, NYU School of Medicine, New York, NY, United States, 2Radiation Oncology, NYU Langone Health, New York, NY, United States
Synopsis
Synopsis: The effect of chemo-radiation therapy on advanced head & neck squamous cell carcinoma was evaluated via diffusion and kurtosis time-dependence. We found opposing diffusion limiting regimes pre and post therapy, where prior to therapy the tissue was well described by the long-time limit (Karger Model applies), and where after therapy the tissue was well described by the short-time S/V limit. This reversal of imaging regimes can serve as a signature of the minimal effective dose required for treatment.
Introduction
Diffusion and Kurtosis have been proposed as imaging markers to assess cell viability to evaluate the early treatment response.1-5 However, most of previous studies were conducted with short diffusion times (30-100 ms), thereby limiting the sensitivity of these measurements to relatively short length scales $$$l=\sqrt{6Dt}=10-25\,\mu m$$$, and have not explore the full potential of diffusion MRI to measure specific tissue microstructural properties. In this abstract, we evaluate diffusion and kurtosis time-dependence for head and neck squamous cell carcinoma (HNSCC) before and after therapy over a wider interval for longer diffusion times (100-700 ms).Methods
Data Acquisition: HNSCC patients (n=6) were imaged on a Siemens 3T PRISMA system using a 20-channel head/neck coil. An in-house developed stimulated echo acquisition mode (STEAM) EPI sequence was used to acquire 5 diffusion times, [t=100,200,300,500,700 ms], over 4 b-shells [b=500,1000,2000,3000 s/mm2] with 3 diffusion directions along x, y, and z axes. The mixing time, tm, was [80,180,280,480,680] ms varying with t. Other parameters include, TR=5000 ms, TE=66 ms, resolution=1.5x1.5x4.0 mm3, FOV=190 mm, partial Fourier 6/8, and GRAPPA with R=2. Each patient was imaged twice: once before initiating chemo-radiation therapy and then 4-weeks later after starting the therapy.
Analysis: Each set of images was denoised6, de-Gibbsed7, and affine registered8 over all b and t. The estimated noise-level9 was then used to correct the signal for Rician bias. Following post-processing, diffusion and kurtosis maps were generated via a weighted linear least square fit method10. Due to the proximity of to the Rician floor, b=3000 was discarded in the final analysis.
Modeling D(t) & K(t): In the solid part of HNSCC prior to therapy with small cell size (radius ~4 $$$\mu m$$$), a dynamic range of t about 10 ms, would be required to quantify these length scales. For the range of t in this experiment ($$$>100\,ms$$$), diffusion in the extracellular space can be considered Gaussian (i.e, long-time diffusion limit)11, where D(t) remains constant. In this regime, D is sensitive towards exchanging volume fractions, ve, whose water exchange time12 could be determined by modeling K(t) using the Karger model:$$D=(1-v_e)D_e+v_eD_i=\text{const}$$$$K(t)=K_\infty+K_0\frac{2\tau_{ex}}{t}\bigg[1-\frac{\tau_{ex}}{t}\bigg(1-e^{-t/\tau_{ex}}\bigg)\bigg]\,\,[1]$$
where$$$\,K_\infty\,$$$marks the floor of diffusion kurtosis pertaining to the intrinsic tissue heterogeneity.
Chemo-radiation is a radical and destructive process that can results in a dramatic increase of diffusivities2. This drastic increase in diffusivity due to the break down of cell walls indicates a change in volume fraction and length scale, where membrane-like debris serve as the occasional restriction. After successful therapy, D(t) is no longer in the long-time limit, but may move towards the short time limit,13,14 which is characterized by t1/2: $$D(t)=D_0\bigg(1-\frac{4}{3d\sqrt{\pi}}\frac{S}{V}\sqrt{D_0t}\bigg)\,\,[2]$$where the tissue length scale would be determined by a=6/(S/V), since d=3. In this regime, K(t) is expected to be constant.
Results
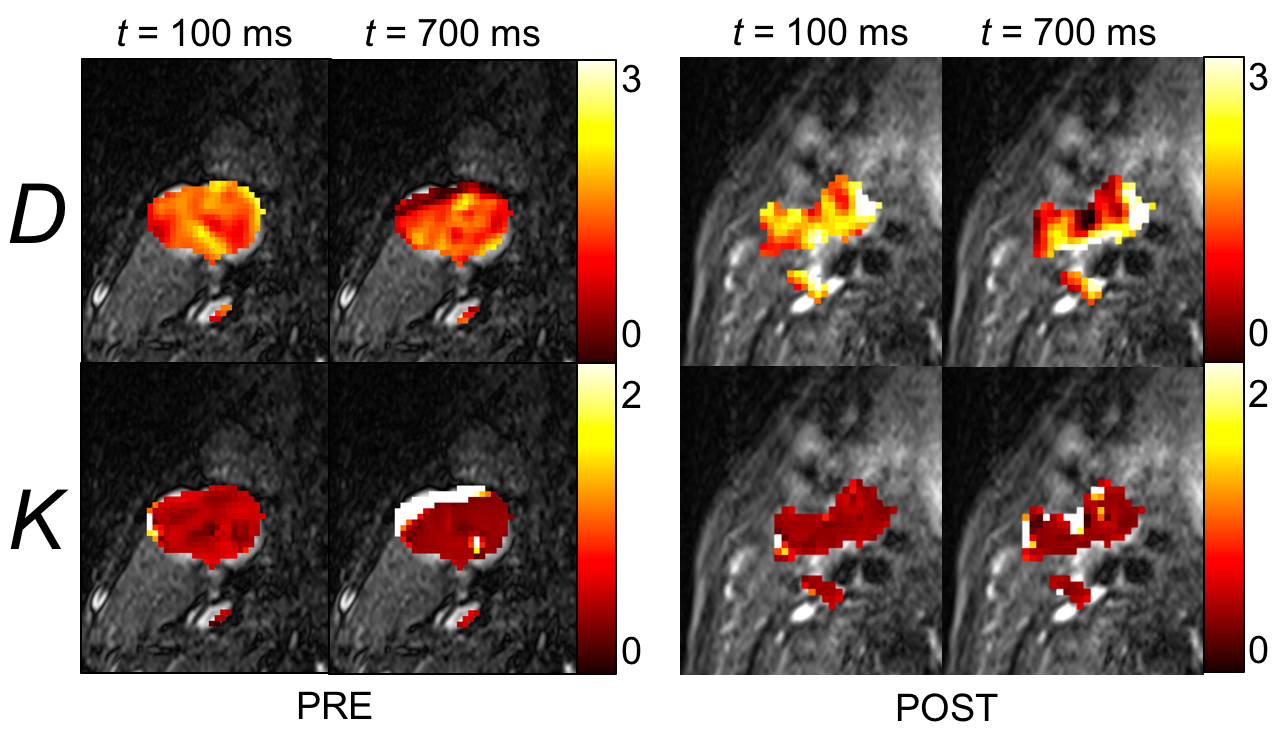
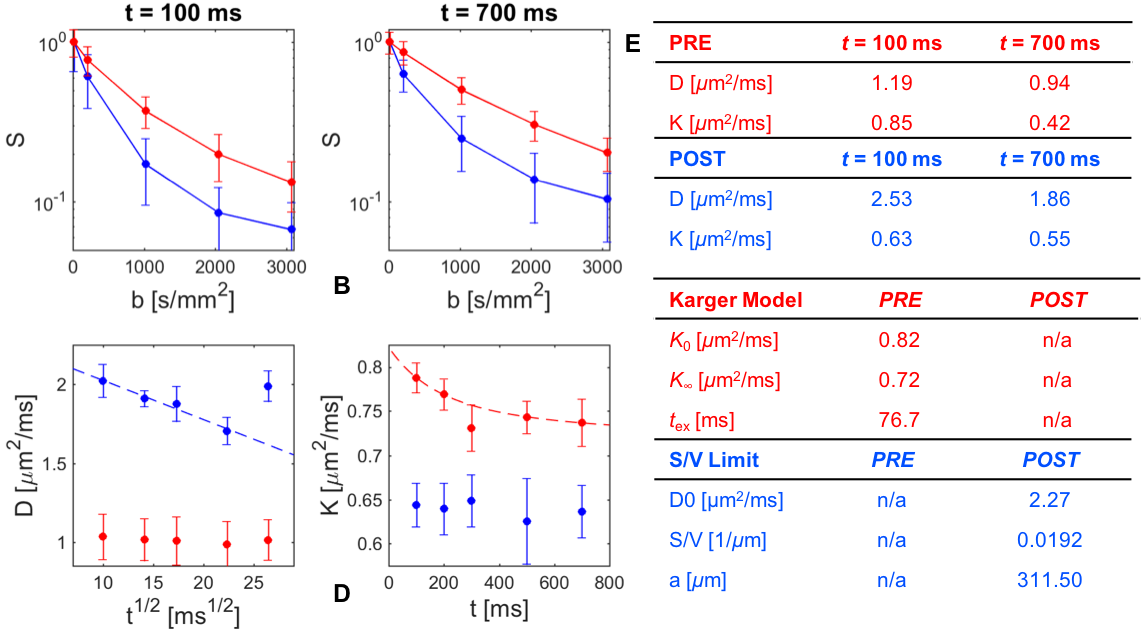
Between the shortest and longest t used in this study, we observed the degree of the time-dependence of D and K change substantially before and after therapy [Fig.1,Fig2(A,B)]. For the preliminary analysis, D(t) and K(t) were calculated from the tumor voxels pooled from all six subjects in Figure 2.
Prior to therapy, D(t) does not show notable change (coefficient of variation, CV=std(D(t))/mean(D(t))=0.016). However, after the therapy, D(t) shows remarkable time-dependency [Fig.2(C)] (CV(D)=0.065) and becomes highly linear as function of t1/2, with Pearson’s$$$\,\rho\,$$$(when excluding the outlier at t = 700 ms) [Fig.2(C)]. Hence, Eq.[2] was fit to D(t), which provided a length scale of a=311.50 $$$\mu m$$$. On the other hand, K(t) shows an opposite trend [Fig.2(D)]. K(t) varies noticeably (CV(K)=0.032) prior to therapy, but remains largely constant after therapy (CV(K)=0.014). Hence, the Karger Model (Eq.[1]) was applied only to the pre-therapy K(t) data, which estimated an exchange time of 76 ms.
Discussion & Conclusion
The trends of empirical D(t) and K(t) observed in this study indicate a qualitative microstructural change from the long-time to the short-time limit following chemo-radiation. Further study is warranted to assess whether the shift between Karger and S/V limits can serve as indicators of whether chemo-radiation therapy has been successful and to which degree the dose can be reduced such that the patient toxicity is minimized.Acknowledgements
No acknowledgement found.References
1. Padhani AR and others. Diffusion-weighted magnetic resonance imaging as a cancer biomarker: consensus and recommendations. Neoplasia 2009;11(2):102-125.
2. Kim S and others. Diffusion-weighted magnetic resonance imaging for predicting and detecting early response to chemoradiation therapy of squamous cell carcinomas of the head and neck. Clinical cancer research : an official journal of the American Association for Cancer Research 2009;15(3):986-994. 3. Thoeny HC and others. Predicting and Monitoring Cancer Treatment Response with Diffusion-Weighted MRI. Journal of Magnetic Resonance Imaging 2010;32(1):2-16.
4. Jansen JF and others. Non-gaussian analysis of diffusion-weighted MR imaging in head and neck squamous cell carcinoma: A feasibility study. AJNR American journal of neuroradiology 2010;31(4):741-748.
5. Goshima S and others. Diffusion kurtosis imaging to assess response to treatment in hypervascular hepatocellular carcinoma. AJR American journal of roentgenology 2015;204(5):W543-549.
6. Veraart J and others. Denoising of diffusion MRI using random matrix theory. Neuroimage 2016;142:394-406.
7. Kellner E and others. Gibbs-ringing artifact removal based on local subvoxel-shifts. Magn Reson Med 2016;76(5):1574-1581.
8. Klein S and others. elastix: a toolbox for intensity-based medical image registration. IEEE Trans Med Imaging 2010;29(1):196-205.
9. Veraart J and others. Diffusion MRI noise mapping using random matrix theory. Magn Reson Med 2016;76(5):1582-1593.
10. Veraart J and others. Weighted linear least squares estimation of diffusion MRI parameters: strengths, limitations, and pitfalls. Neuroimage 2013;81:335-346.
11. Novikov DS and others. Quantifying brain microstructure with diffusion MRI: Theory and parameter estimation. ArXiv e-prints. Volume 16122016.
12. Fieremans E and others. Monte Carlo study of a two-compartment exchange model of diffusion. NMR Biomed 2010;23(7):711-724.
13. Lemberskiy G and others. Validation of surface-to-volume ratio measurements derived from oscillating gradient spin echo on a clinical scanner using anisotropic fiber phantoms. NMR Biomed 2017;30(5).
14. Mitra PP and others. Short-time behavior of the diffusion coefficient as a geometrical probe of porous media. Phys Rev B Condens Matter 1993;47(14):8565-8574.
Figures