3449
Reduced field-of-view Diffusion-weighted imaging at 3T for Evaluating Allograft Fibrosis After Kidney Transplantation: A Preliminary Study1Department of Medical Imaging, Jinling Hospital, Nanjing Clinical School, Southern Medical University, Nanjing, China, China, 2Department of Medical Imaging, Jinling Hospital, Medical School of Nanjing University, Nanjing, China, Nanjing, China, China, 3GE Healthcare, Advanced Application, Shangha, China, Shangha, China, China
Synopsis
The extent of renal allograft fibrosis is a
critical predictor of adverse allograft outcome.
This institutional review board approved study
included 109 renal transplantation recipients receiving 3 T multi-b reduced
field-of-view intravoxel incoherent motion diffusion-weighted imaging (rFOV
IVIM-DWI) examinations. The purpose of the present study is exploring the
diagnostic value of evaluating allograft fibrosis with IVIM-DWI. In the present
study, we have found that there is downward trend of ADCT and ADCD
with the development of kidney fibrosis and both of them had good diagnostic
efficiency in the distinguish fibrosis extent.
Introduction
Renal allograft fibrosis appears fibrous scars and distorts of the architecture of renal tissue, ultimately leads to the collapse of kidney parenchyma and shorting of graft lifespan or the graft loss1. It is important to investigate the extent of allograft fibrosis. IVIM-DWI has been used to evaluate allograft dysfunction and animal native renal fibrosis2,3. However, the studies on the analysis between the renal allograft fibrosis degree and diffusion parameters has not been reported yet. Therefore, this study aims to determine whether diffusion parameters identify renal allograft fibrosis extent and even stage the degree of allograft fibrosis.Materials and Methods
This clinical study was approved by the local Institution Review Board. Written informed consent was obtained from all subjects.
Subjects
One hundred and fifteen (90 males and 25 females; age range from 12 to 60 years) kidney transplantation patients with indication of renal allograft biopsy were enrolled in this study. The inclusion criterion was written informed consent. Exclusion criteria for our study were as follow: (1) declining consent, (2) claustrophobia or other MRI contraindications, and (3) substandard images due to marked motion artifacts. The subjects were grouped according to Banff criteria (ci0 (<5% of cortex occupied by fibrosis), ci1 (5%–25% cortex fibrotic), ci2 (26%–50% cortex fibrotic), and ci3 (>50% cortex fibrotic).
MRI sequence
All examinations were performed using a 3 T scanner (Discovery MR750; GE Healthcare, USA) with a 32-channel phase-array torso coil under respiratory gating. Ten b values (0,10, 30, 50, 100, 150, 200, 400, 600, 800, 1000 s/mm2) were fitted to separate microcirculations from diffusion contributions.
Image analysis
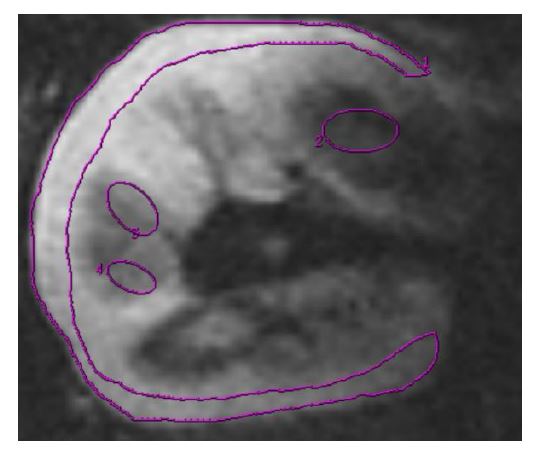
The diffusion parameters were calculated by Functool software 9.4.05 of Advantage Workstation Volume Share 5 (GE Healthcare) and averaged values within each ROI were calculated and recorded. The region of interest (ROI) was defined as Figure 1 shown. The IVIM diffusion parameters were measured with the following equation:
S/S0=(1-f)*exp (-bD)+f*exp (-bD*), (1)
S/S0= exp (-bD). (2)
Data analysis
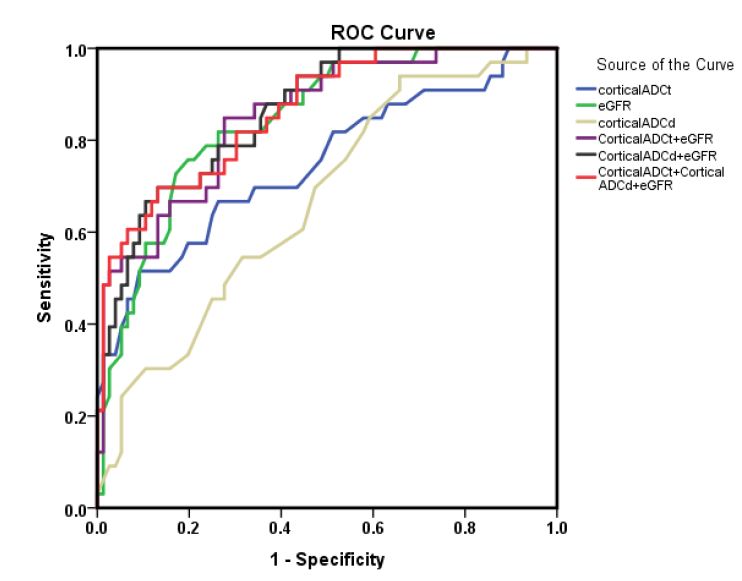
All statistical analyses were performed using IBM SPSS Statistics 20. All continuous variables are expressed as median [25 percentiles-75 percentiles]. For quantitative continuous variables, one-way analysis of variance (ANOVA) were performed if normally distributed among 4 groups. Otherwise, the Kruskal-Wallis H tests were performed. Independent-Samples t tests were performed if normally distributed among 2 groups. Otherwise, the the Mann-Whitney U were performed. The receiver operating characteristic curve (ROC) analysis was performed to assess the ability of diffusion parameters and eGFR to distinguish renal fibrosis extent from mild fibrosis and severe fibrosis. Correlation analyses were performed by using Spearman rank correlation analysis. p-values of less than 0.05 were considered statistically significant.
Results
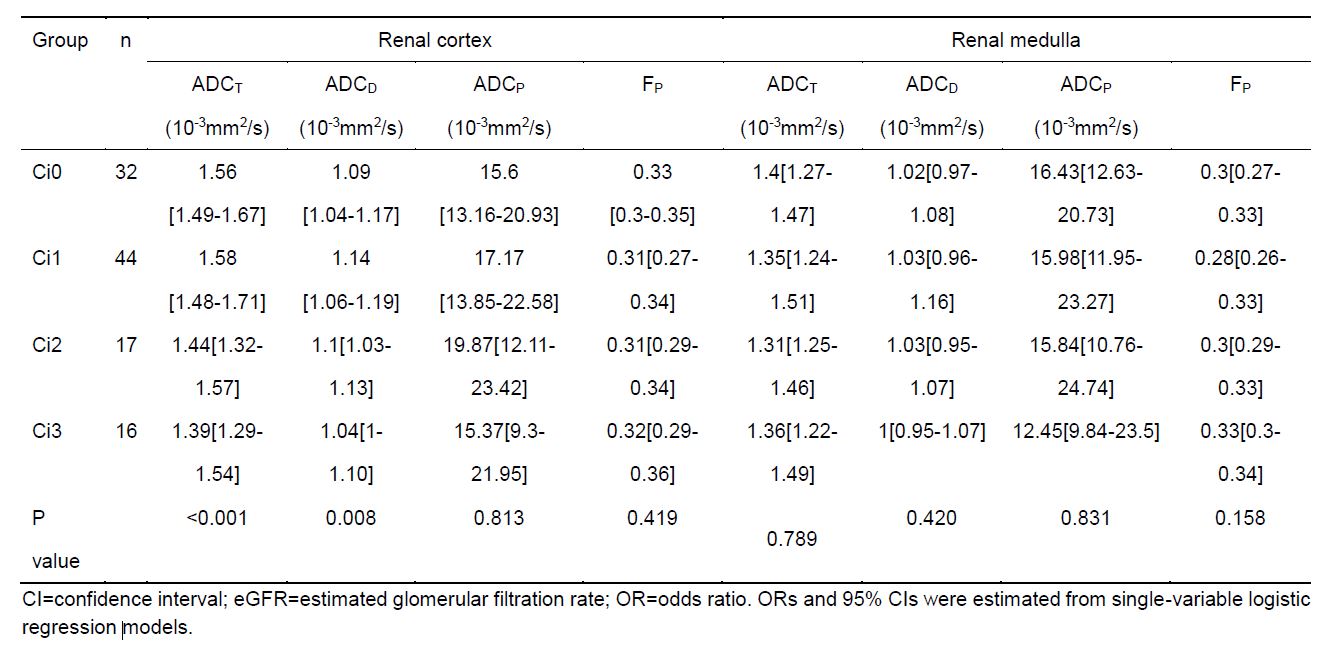
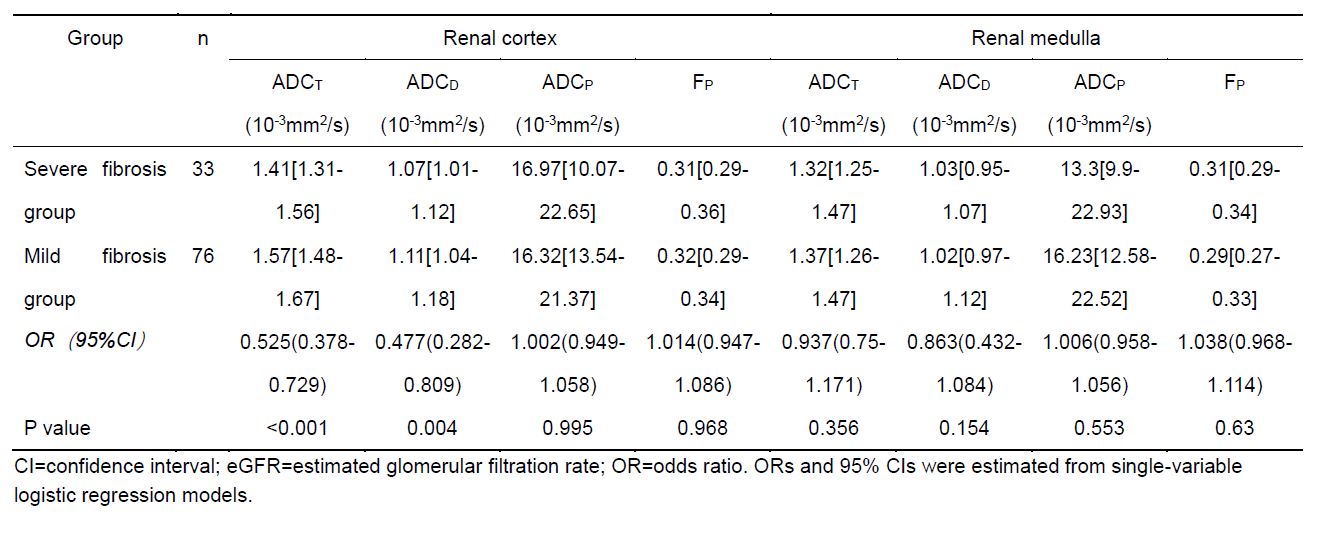
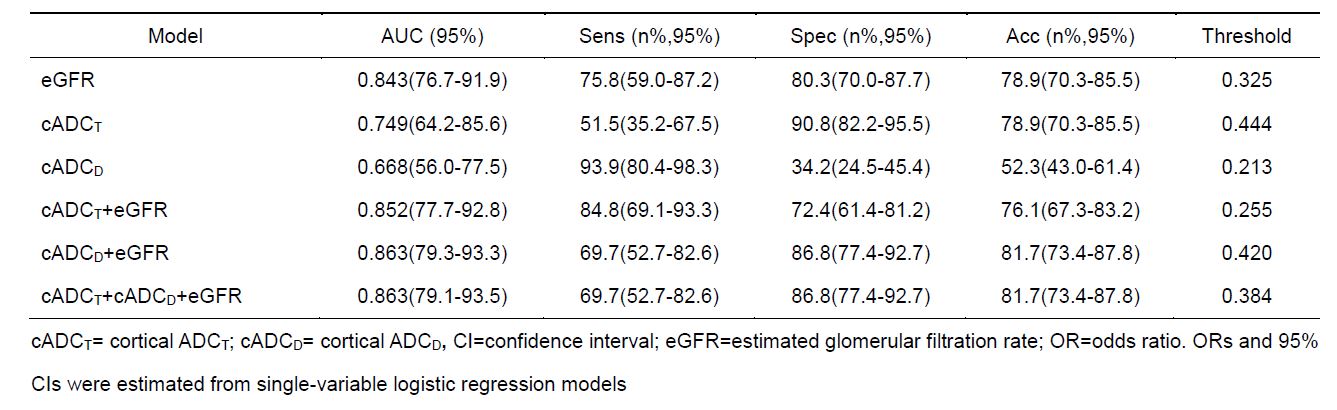
The renal cortical ADCT value in Ci 0 group was significantly higher than in Ci 2 (P<0.005) and Ci 3 group (P<0.005). The renal cortical ADCT value in Ci 1 group was significantly lower than in Ci 2 (P=0.001) and Ci 3 group (P<0.001). The renal cortical ADCT value in severe fibrosis group (Ci 2 and Ci 3) was significantly lower than in mild fibrosis group(Ci 0 and Ci 1) (Table 1,2). The renal cortical ADCT showed the largest AUC of 0.749. When using 0. 444 as the cutoff value, renal cortical ADCT had a sensitivity of 51.5% and a specificity of 90.8% for distinguishing mild and severe fibrosis (Fig2, table 3). Only cortical ADCT(r=-0.305) showed mildly negative correlation with Banff fibrosis score.Discussion and conclusion
We investigated the value of IVIM DWI in assessment of renal allograft fibrosis and we found that renal cortical ADCT was lower in severe fibrosis group than mild fibrosis group, whereas it can not distinguish the allograft fibrosis at each level. To the best of our knowledge, few relevant researches on renal allograft fibrosis were reported. Additionally, a mild negative correlation was observed between cortical ADCT and Banff fibrosis scores.
In conclusion, there is downward trend of ADCT and ADCD with the development of kidney fibrosis. The results in this work suggest that IVIM DWI plays a promising role for staging of renal fibrosis.
Acknowledgements
NoneReferences
1. Oberbauer R. Progression of Interstitial Fibrosis in Kidney Transplantation. Clin J Am Soc Nephrol. 2016;11(12):2110-2112.
2. Eisenberger U, Binser T, Thoeny HC, et al. Living renal allograft transplantation: diffusion-weighted MR imaging in longitudinal follow-up of the donated and the remaining kidney. Radiology 2014;270(3):800-808.
3.Togao O, Doi S, Kuro-o M, et al. Assessment of renal fibrosis with diffusion-weighted MR imaging: study with murine model of unilateral ureteral obstruction. Radiology 2010; 255:772-780.
Figures