3447
Whole-volume ADC Histogram and Texture Analyses of Parotid Glands as an Image Biomarker in Evaluating Disease Activity of Primary Sjögren's Syndrome1Radiology, Drum Tower Hospital, School of Medicine, Nanjing University, Nanjing, China, 2Philips Healthcare, Shanghai, China
Synopsis
Fifty-five patients with pSS underwent MRI including DWI to explore whether ADC histogram and texture analyses to evaluate the disease activity of pSS. According to the ESSDAI score, 35 patients were categorized into the low-activity group and 20 into the moderate-high-activity group. ROC analysis showed that the anti-SSB, lip biopsy, MRI morphology, ADC, ADCmean, and entropy values were able to categorize the disease into two groups, particularly the entropy values. The multivariate model, which included anti-SSB, MRI morphology and entropy, had an area under the ROC curve of 0.923. The parotid entropy value distinguished disease activity in patients with pSS.
INTRODUCTION
Diffusion weighted imaging (DWI) has proven to be sensitive for detecting early injury to the parotid gland in pSS (primary Sjögren's syndrome). Here, we explored the application of ADC histogram and texture analyses for evaluating the disease activity of pSS.METHODS
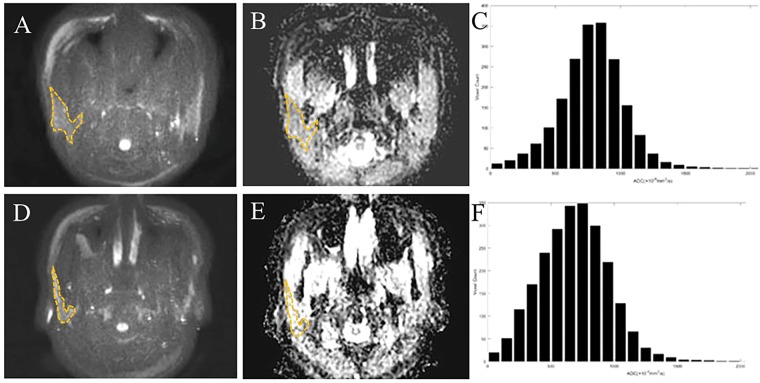
A total of 55 patients with pSS who met the classification criteria of the 2002 AECG criteria prospectively underwent 3.0-T magnetic resonance imaging (MRI) including DWI (b = 0 and 1000 s/mm2). According to the ESSDAI score, 35 patients were categorized into the low-activity group (ESSDAI < 5) and 20 into the moderate-high-activity group (ESSDAI ≥ 5). Via analysis of the whole-volume ADC histogram, the ADCmean, skewness, kurtosis, and entropy values of the bilateral parotid glands were determined. Multivariate analysis was used to identify independent risk factors for predicting disease activity. The diagnostic performance of the indexes was evaluated via receiver operating characteristic (ROC) analysis.RESULTS
Univariate analysis showed significant differences for the anti-SSB, lip biopsy, MRI morphology, ADC, ADCmean, and entropy values between the moderate-high-activity and low-activity group (all P < 0.05). ROC analysis showed that the anti-SSB, lip biopsy, MRI morphology, ADC, ADCmean, and entropy values performed well in differentiating the moderate–high-activity group from the low-activity group. Entropy values had the highest area under the ROC curve (AUC) of 0.853. The optimal combination included anti-SSB, MRI morphology and entropy and yielded a sensitivity of 95.0%, specificity of 77.1%, accuracy of 83.6%, and AUC of 0.927 (P < 0.001) (Table 3). In multivariate analysis, the p value of lip biopsy, ADC, and ADCmean were 0.069, 0.471 and 0.795, respectively. A McNeil test showed that the AUC of the combined indexes was significantly higher than that of any sole index (anti-SSB, lip biopsy, MRI morphology, ADC, ADCmean, and entropy, P = 0.0130,<0.0061, 0.0140, 0.0043, 0.0011, and 0.0268, respectively). Entropy was negatively correlated with muscular injury (r = 0.268, P = 0.018) and positively correlated with constitutional symptoms (r = 0.318, P = 0.048).DISCUSSION
The parotid ADC values from one ROI and ADCmean based on the whole-volume histogram and texture analyses were significantly lower in the moderate–high-activity group than in the low-activity group. Previous studies have reported that the parotid ADC value increased during the early stages of pSS due to oedema and the increased vascular permeability of parotid glands, but it decreased during the late stages of the disease due to fatty deposition and atrophy of the parotid glands. The decreased parotid ADC value in the moderate-high-activity group may also be involved in the decreased microvascular perfusion of the glands. We found that skewness and kurtosis correlated with some of the ESSDAI items. A lower skewness indicates a higher frequency of high ADC values, which may be due to inflammation and micro-necrosis. A lower kurtosis indicates high heterogeneity of the tissue, which may be due to cell proliferation and necrosis. The entropy value of the parotid glands was significantly higher in the moderate–high-activity group than in the low-activity group. It was speculated that the entropy value might be related to the inflammation characteristics of parotid injury. Texture analysis reflects inflammation disease activity based on the histological characteristics, including transmural inflammation, fissuring ulcers, and oedema1. Previous study found that entropy reflected Crohn’s disease activity according to the microenvironment heterogeneity and complexity, and our previous study confirmed that the parotid gland microenvironmental complexity increased with aggravation of the injury grade. Parotid entropy could distinguish pSS with moderate–high disease activity from pSS with low disease activity with an AUC of 0.853, which was higher than any other single index, including clinical, laboratory, and other imaging parameters. The multivariate model that included parotid entropy, anti-SSB, and MRI morphology yielded a higher value on the goodness-of-fit Hosmer-Lemeshow test. The disease activity of pSS could be reflected more comprehensively and accurately by combining the information on the parotid glands, serum biomarkers, and lip biopsy.CONCLUSION
The entropy value derived from whole-volume ADC histogram and texture analyses of the parotid glands shows great potential for predicting the disease activity of pSS. The diagnostic performance of whole-volume ADC histogram and texture analyses can serve as an imaging biomarker of pSS disease activity.Acknowledgements
No acknowledgement found.References
1. Makanyanga J, , Ganeshan B, Rodriguez-Justo M, et al. MRI texture analysis (MRTA) of T2-weighted images in Crohn’s disease may provide information on histological and MRI disease activity in patients undergoing ileal resection. Eur Radiol. 2017;27:589–597.
2. Xuan J, Shen L, Malyavantham K, et al. Temporal histological changes in lacrimal and major salivary glands in mouse models of Sjogren’s syndrome. BMC Oral Health. 2013;13:51.
3. Regier M, Ries T, Arndt C, et al. Sjogren’s syndrome of the parotid gland: value of diffusion-weighted echo-planar MRI for diagnosis at an early stage based on MR sialography grading in comparison with healthy volunteers. Rofo. 2009;181:242–248.
4. Chang HC, et al. Effects of gender, age, and body mass index on fat contents and apparent diffusion coefficients in healthy parotid glands: an MRI evaluation. Eur Radiol. 2014;24:2069–2076.
5. Chu C, Zhang H, Zhou N, et al. Diffusional kurtosis imaging of parotid glands in Sjogren’s syndrome: Initial findings. J Magn Reson Imaging. 2017;46:1409–1417.
Figures