3443
Application of Whole-Body Diffusion-Weighted MRI Imaging with Apparent Diffusion Coefficient Mapping for the Evaluation of Depth of Response to Therapy in Multiple Myeloma1The First Affiliated Hospital of Soochow University, Soochow, China
Synopsis
Whole-body diffusion-weighted magnetic resonance imaging (WB-DWI MRI) is an important imaging technique of great supplementary diagnostic value to the evaluation of treatment response in patients with multiple myeloma (MM). Conventional radiography which has been widely avaiable for the identification of myeloma-related bone lesions both at diagnosis and during disease course is of limited value to the assessment of response to therapy or disease relapse in MM, as lytic bone lesions rarely show signs of healing despite response to therapy. WB-DWI MRI with the measurement of apparent diffusion coefficient (ADC) value is an effective way for quantitatively comparing the differences in water diffusion among normal marrow, active pathologic marrow and that in remission. In this work, we report the preliminary results of the application of WB-DWI MRI in discriminating deep response to induction therapy for newly diagnosed MM patients.
Introduction
Multiple myeloma (MM) is the second most common hematologic malignancy characterized by the development of osteolytic bone lesions causing substantial bone pain, hypercalcemia, pathologic fractures and spinal cord compression. Over the past decade, the life expectancy and prognosis of MM patients have been significantly improved with the introduction of several novel therapeutic approaches with different treatment mechanisms. Therefore, the response criteria for multiple myeloma had been further refined since then, and the most recent criteration of the response criteria developed by the International Myeloma Working Group are mainly based on the determination of M-proteins and light chains levels in the serum and urine1. Yet, the standard hematologic laboratory parameters of serum or urine measurements is not always avaiable or reliable, for oligo-secretory and non-secretory MM, there is no sufficient M-component in serum and/or urine to monitor response. Meantime, the invasive and painful serial bone marrow biopsies may not be representative of the extent of disease2. Several studies have investigated the potential of WB-DWI MRI in the evaluation of response to chemotherapy in MM patients and the association between ADC levels and treatment response. Whereas there is few evidence on the correlation of ADC values with achieving deep response to induction therapy in MM. The purpose of this study was to evaluate ADC variations before and after induction chemotherapy in a series of newly diagnosed MM patients using WB-DWI MRI and invesigate its value in discriminating deep response to induction therapy.Methods
70 consecutive patients with MM (47 men and 23 women; mean age, 60.4 years; age range, 32–78 years) were prospectively enrolled at the time of diagnosis, all of them underwent WB-DWI MRI before and after 4 courses of induction chemotherapy. All patients enrolled in the study were classified as deep responders (complete response or very good partial response) and non–deep responders (partial response, minimal response, stable disease, or progressive disease) at the end of induction chemotherapy according to the standard criteria defined by the International Myeloma Working Group. Response were defined on the basis of serum paraproteins or light chains or bone marrow. On ADC maps, quantitative ADC estimates were measured at the site of the lesions before and after chemotherapy, and the ADC values percent variations were calculated and compared between deep responders and non–deep responders. The study was compliant with the guidelines of local research ethics committee.Results
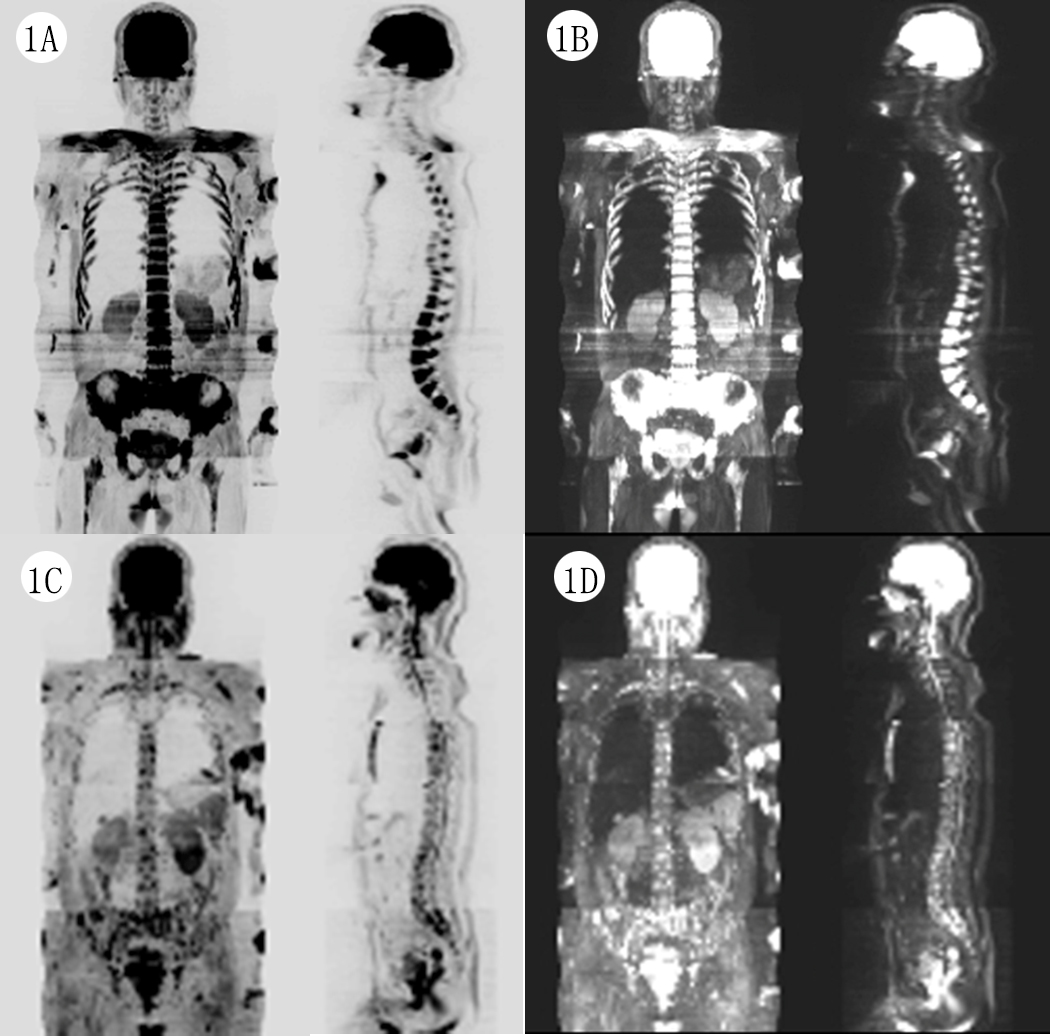
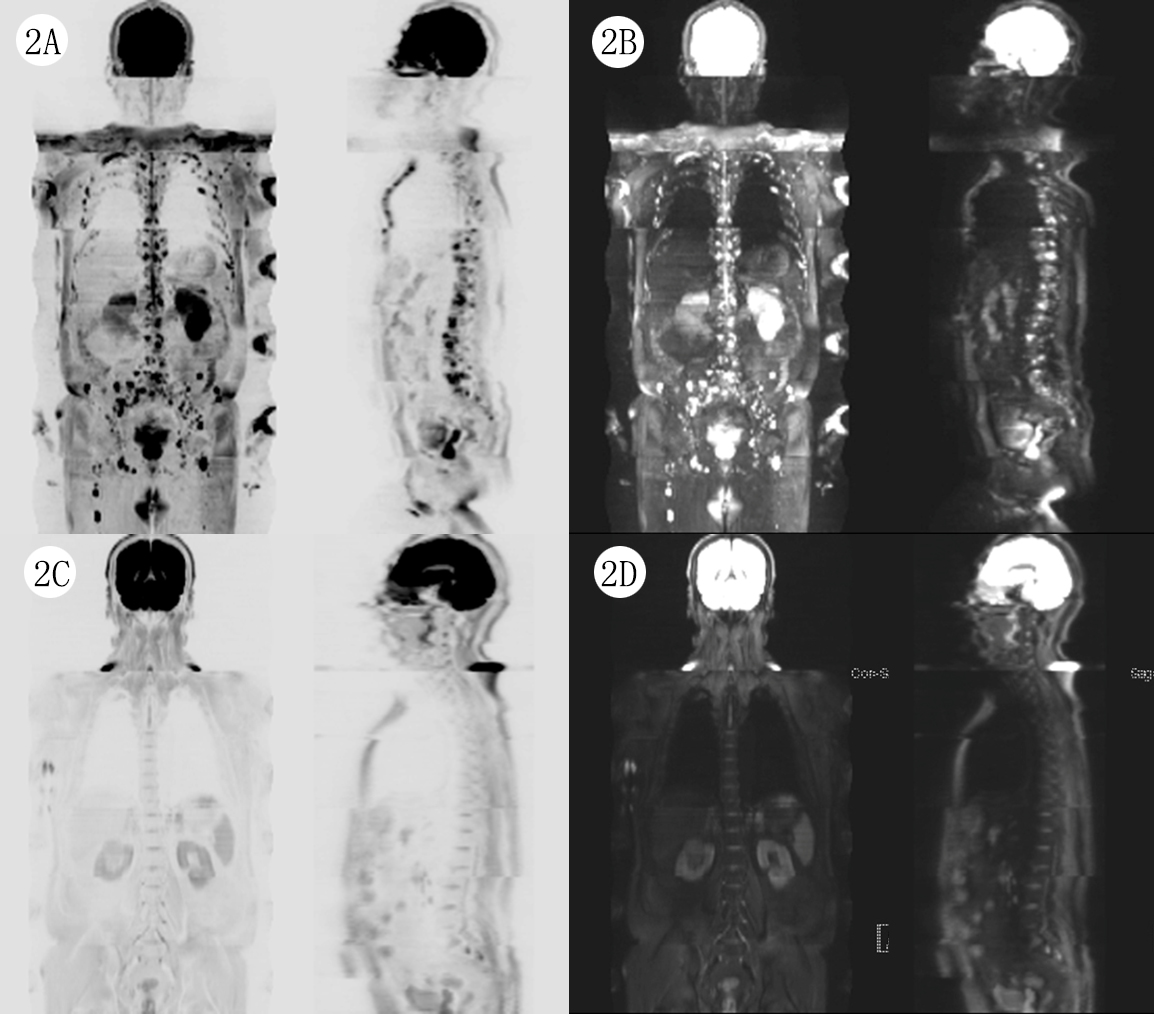
Of the 70 patients enrolled in the study, 45 patients were classified as deep-responders (21 had complete response, and 24 had very good partial response) and 25 as non-deep responders (19 had partial response, 4 had minimal response, and 2 had progressive disease) at the end of 4 courses of induction chemotherapy. The ADC changes from baseline of deep responders were significantly higher than non-deep responders. The ADC percent variations from baseline were significantly higher in deep responders compared to those in non-deep responders at the end of induction chemotherapy (101.63% vs 39.32%, P<0.01). The cut-off value of ADC percent variations for the diagnosis of deep response was 58.42%, the sensitivity and specificity was 91.4%, 89.5%, and the area under the ROC curve was 0.929. Figure 1 and Figure 2 show the representative maximun intensity projection (MIP) images of WB-DWI MRI before and after induction chemotherapy.Discussion
The preliminary findings from our study demonstrated that ADC variations from WB-DWI MRI in patients who attained deep response at the end of induction chemotherapy were significantly higher than those in patients who did not, which represented an effective diagnostic tool to discriminate deep response to treatment for patients with MM. Given that the survial of deep responders was reported to be remarkably longer than non-responders3, the depth of response to initial chemotherapy was closely associated with the prognosis in patients with MM, thus WB-DWI MRI may be conducive to the early evaluation of therapeutic effect and survival outcomes of MM patients.Conclusion
WB-DWI MRI is feasible and of clinical value to the discrimination of deep response to induction chemotherapy in MM patients by quantifying ADC estimates before and after the treatment, preliminary findings are promising for recommending the application of this noninvasive imaging approach as a complementary quantitative evaluation for better and earlier definition of deep response to chemotherapy and more personalized medication of patients with MM.Acknowledgements
Thanks are due to Daohai Xie for assistance with the study and to Xinxing Ma for valuable discussion.References
1.Criteria for the classification of monoclonal gammopathies, multiple myeloma and related disorders: a report of the International Myeloma Working Group. Br. J. Haematol. Jun 2003;121(5):749-757.
2. Hillengass J, Bauerle T, Bartl R, et al. Diffusion-weighted imaging for non-invasive and quantitative monitoring of bone marrow infiltration in patients with monoclonal plasma cell disease: a comparative study with histology. Br. J. Haematol. Jun 2011;153(6):721-728.
3. Liang ZY, Ren HY, Cen XN, et al. Bortezomib-based chemotherapy for patients with multiple myeloma: a single center experience. Chin J Hematol, 2014,(3):225-230
Figures