3440
DTI of Spinal Cord Lesions of Varying Severity Based on MRI in the Entire Pediatric Spinal Cord1Thomas Jefferson University, Philadelphia, PA, United States, 2University Medical Center Hamburg-Eppendorf, Hamburg, Germany, 3Johns Hopkins School of Medicine, Baltimore, MD, United States
Synopsis
To determine whether DTI at sites cephalad and caudal to the MRI lesion provides measures of cord abnormalities in different SCI groups (n=23) compared to TD (n=36) and any correlation between the varying severity of MRI abnormality and DTI abnormalities cephalad and caudal to the MRI lesion. to the MRI lesion. The five SCI groups included; 1= SCIWORA (n=6); 2=Syringohydromyelia (n=4); 3=Atrophy+Syringomyelia (n=7); 4=Atrophy+Myelomalacia (n=3); 5=Atrophy+Hemorrhage (n=3). Groups 1 to 5
Introduction
In patients with spinal cord injury (SCI), secondary injury may involve the development of necrosis, glial scarring and cavitation. These secondary injuries develop through a multi-factorial process, including infiltration of astrocytes, microglia, macrophages, fibroblasts1,2, chemokines and their receptors3 as well as chronic axonal injury such as Wallerian degeneration4. These processes interfere with spinal cord (SC) recovery by preventing axonal regeneration5. Examining the perilesional areas distant from the injury site may provide valuable insights into the full extent of injury. A recent DTI study has shown changes in the SC white matter regions remote from the lesion in chronic SCI children6. In this study, we classified the pediatric SCI subjects into five groups of varying severity based on the type of SC lesion seen on MRI. The purpose of this study was two-fold: a) to determine whether DTI at sites cephalad and caudal to the MRI lesion provides measures of cord abnormalities in different SCI groups (ranging from SCIWORA to focal atrophy with associated hemorrhage) compared to typically developing (TD); b) any correlation between the varying severity of MRI abnormality and DTI abnormalities cephalad and caudal to the MRI lesion.Methods
A total of 36 TD (mean age, 11.72±3.12years) without evidence of SCI or pathology and 23 subjects with chronic SCI (mean age, 11.91±3.03years) were included in the study. The lesion in subjects with SCIWORA was based on ISNCSCI examination. Written informed assent and consent was obtained and approved by IRB. Imaging: Subjects underwent scans using 3T Verio MR scanner. The protocol: T1, T2, axial DTI scans based on the iFOV7 to cover the cervical and thoracic SC8. The imaging parameters: 20 diffusion directions, 6 b0, b=800s/mm2, voxel=0.8x0.8x6mm3, axial slices=40, TR=7900ms, TE=110ms, TA=8:49min. Data analysis: After motion correction9 and tensor estimation8, ROIs were manually drawn, by a board-certified pediatric neuroradiologist to extract information from the whole cord along the entire SC. DTI metrics; FA, MD, AD and RD were quantified at each intervertebral disk level and at the mid-vertebral body level of the entire SC. The cord was separated into proximal, middle and distal thirds cephalad and caudal to the MRI lesion. The five SCI groups included; 1= SCIWORA (n=6); 2=Syringohydromyelia (n=4); 3=Atrophy+Syringomyelia (n=7); 4=Atrophy+Myelomalacia (n=3); 5=Atrophy+Hemorrhage (n=3). Groups 1 to 5 represent a progressive measure in cord abnormality. Among these groups, we looked at concordant DTI correlation which is defined as the expected change in DTI metrics with increasing cord severity. Statistical analysis: To detect differences in DTI metrics between TD and different SCI groups in the segments of the cord, a one-way analysis of variance with pooled t-test was performed, p<0.05.Results
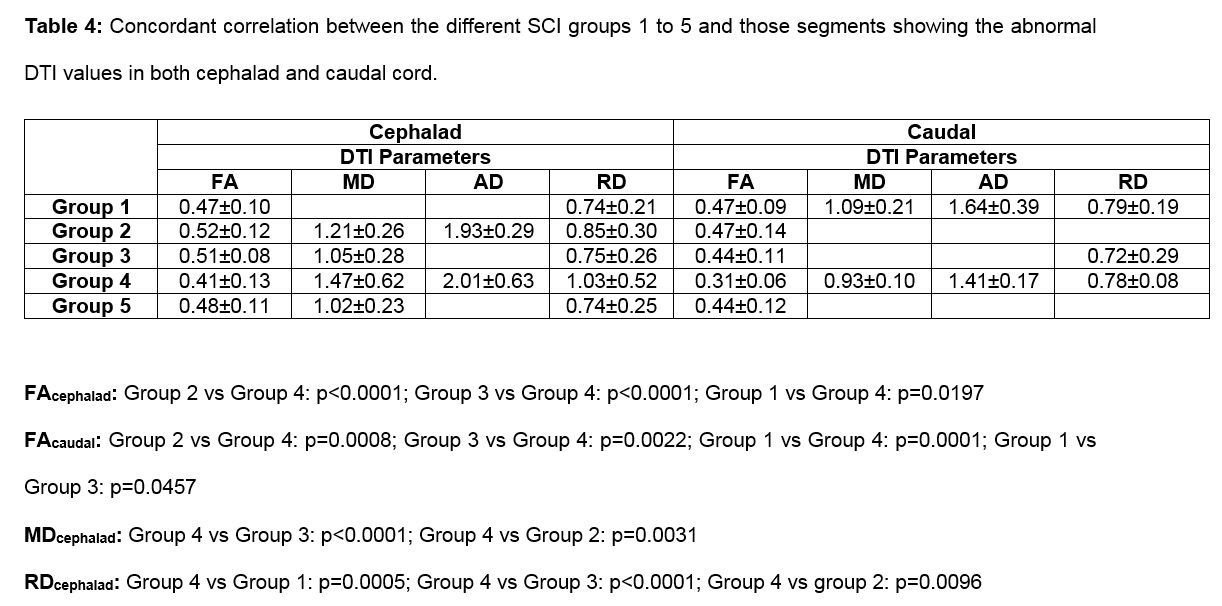
In group 1, FA showed a decrease and RD showed an increase in the middle segment of the cephalad cord, all the three segments of the caudal cord showed FA decrease and RD increase compared to TD (Tables 1 and 2). In group 3, FA was decreased in all three segments of the cephalad and caudal cord. Cephalad to the lesion, FA was decreased in distal and middle segments in group 2 and middle and proximal segments in group 4 respectively, however, FA was decreased in proximal segment of the caudal cord (Table 1). RD was increased in all segments of the cephalad (not distal) and caudal cord in group 3. In group 4, RD showed increase in middle and proximal segments of the cephalad cord and only in proximal segment of caudal cord (Table 2). For each SCI group 1 to 5, we also examined those segments showing statistically significant changes in DTI metrics compared to TD. For all groups 1 to 5, FA showed the greatest number of abnormal segments followed by RD, MD, AD (Table 3). A concordant correlation between abnormal DTI values and different SCI groups is shown in Table 4. Overall, FA showed the greatest concordant correlation among the groups 1 to 5 for both cephalad and caudal cord (Table 4).Discussion
In this study, SCIWORA showed DTI abnormality at segments of the cephalad and caudal cord with the caudal cord more affected consistent with the anterograde degeneration. FA showed the greatest total number of segments in the cephalad and caudal cord that showed abnormal DTI values comapred to the other DTI metrics. We also found that FA showed the most concordant correlation among the SCI groups 2 to 4 indicating a trend that may show a correlation between pathology and FA. Overall, FA appears to be the most sensitive and consistent DTI metric and a potential imaging biomarker in evaluating pediatric SCI patients. DTI might be useful in detection of various types of SC lesions which may establish a therapeutic strategy and prognosis.Acknowledgements
This work was supported by National Institute of Neurological Disorders of the National Institutes of Health under award number R01NS079635.References
1. Jones LL, Margolis RU, Tuszynski MH. The chondroitin sulfate proteoglycans neurocan, brevican, phosphacan, and versican are differentially regulated following spinal cord injury. Exp. Neurol. 2003;182:399–411. 2. Schultz SS. Adult stem cell application in spinal cord injury. Curr. Drug Targets 2005;6:63–73. 3. Knerlich-Lukoschus F, Held-Feindt J. Chemokine-ligands/receptors: multiplayers in traumatic spinal cord injury. Mediators Inflamm. 2015;2015:486758. 4. Cohen-Adad J, Leblond H, Delivet-Mongrain H, et al. Wallerian degeneration after spinal cord lesions in cats detected with diffusion tensor imaging. Neuroimage 2011;57:1068–1076. 5. Schwartz ED, Duda J, Shumsky JS, et al. Spinal cord diffusion tensor imaging and fiber tracking can identify white matter tract disruption and glial scar orientation following lateral funiculotomy. J. Neurotrauma 2005;22:1388–1398. 6. Saksena S, Mohamed FB, Middleton DM et al. Diffusion tensor imaging assessment of regional white matter changes in the cervical and thoracic spinal cord in pediatric subjects. J Neurotrauma 2018 Oct 3. [Epub ahead of print] 7. Finsterbusch J. Improving the performance of diffusion-weighted inner field-of-view echo-planar imaging based on 2D-selective radiofrequency excitations by tilting the excitation plane. J Magn Reson Imaging 2012;35:984–992. 8. Saksena S, Middleton DM, Krisa L et al. Diffusion tensor imaging of the normal cervical and thoracic pediatric spinal cord. AJNR Am J Neuroradiol 2016;37:2150-2157. 9. Middleton DM, Mohamed FB, Barakat N et al. An investigation of motion correction algorithms for pediatric spinal cord DTI in healthy subjects and patients with spinal cord injury. Magn Reson Imaging 2014;32:433-439.Figures