3439
Correlation between IVIM parameters and cT1 in HCV patients1Dept of Physics, Vision Lab, University of Antwerp, Antwerp, Belgium, 2Fondazione Toscana "G.Monasterio", Massa, Italy, 3Perspectum Diagnostics, Oxford, United Kingdom, 4Hepatology Unit, University Hospital of Pisa, Pisa, Italy, 5Dept Clinical and Experimental Medicine, University Of Pisa, Pisa, Italy, 6Dept of Information Engineering, University Of Pisa, Pisa, Italy
Synopsis
IVIM imaging has been investigated by several researchers to understand its clinical potential. However, the dependency from b-value distribution and the effect of confounding factors such as iron and steatosis make hard to draw conclusion. In this work, a multiparametric protocol was proposed to address those confounds and the correlation with iron-corrected T1 (cT1) was studied in a group of patients affected by hepatitis C. The vascular volume fraction F shows a statistically relevant correlation with cT1 (p<0.001).
INTRODUCTION
Even though Intra-Voxel Incoherent Motion (IVIM) parameters were investigated in several studies as potential biomarkers for the assessment of liver fibrosis stage, their feasibility remains a matter of debate1. IVIM parameters estimation is an ill-conditioned problem and the estimation depends on the chosen b-value distribution2. Furthermore, IVIM measurements may be influenced by confounders such as fat and iron3. In this work, a multiparametric acquisition protocol is used to study the correlation of the IVIM parameters and the apparent diffusion coefficient (ADC) with iron-corrected T1 (cT1), a promising biomarker able to distinguish liver fibrosis from early stages of disease4.METHODS
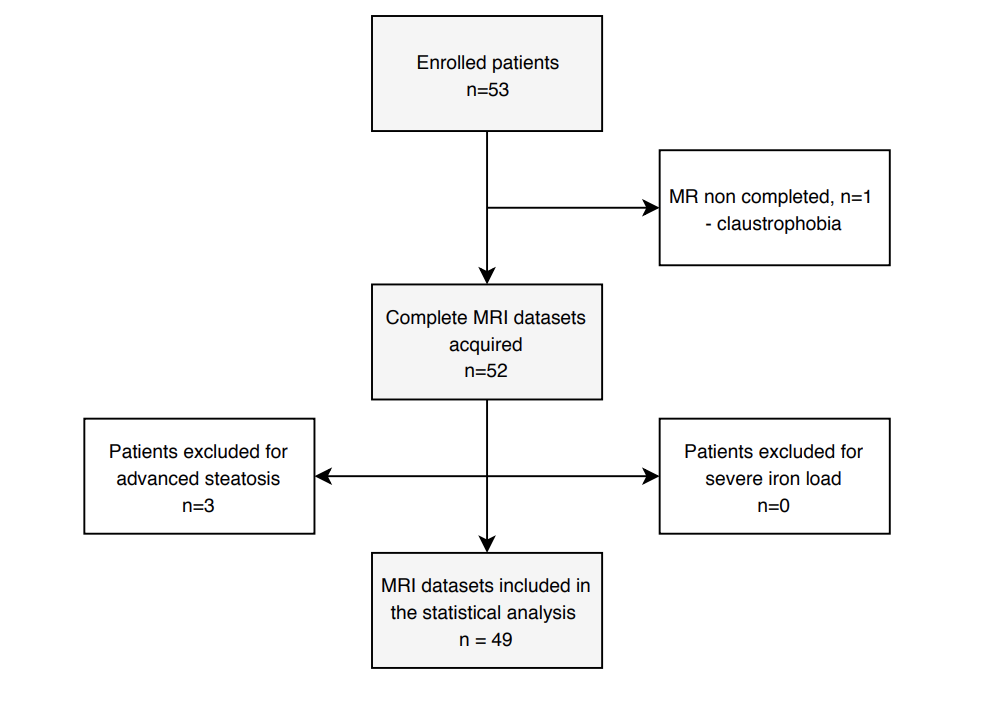
Study Design: A group of 53 patients affected by hepatitis C with different degrees of fibrosis were recruited [Fig.1]. The inclusion criterion was chronic infections of hepatitis C virus (HCV) documented by positivity of HCV-RNA. Fibrosis was documented by histology and/or Fibroscan5. Image acquisition was conducted using a 3 T Philips Ingenia scanner (Philips Healthcare, Best, The Netherlands) equipped with a 32-channel torso array coil.
LiverMultiScan Acquisition Protocol and Image Analysis: A detailed explanation of the relaxometry MRI acquisition protocol is provided in 4. Image data were analyzed using LiverMultiScan™ software6. In summary, T1, T2* and PDFF maps were calculated, then three circular regions of interest (ROIs) of 15 mm diameter were placed on each map within the liver by a trained operator, avoiding MRI artefacts. The ROI median T2* value was used for iron-correction of the T1 map to provide a cT1 map. ROI mean PDFF and cT1 values were calculated.
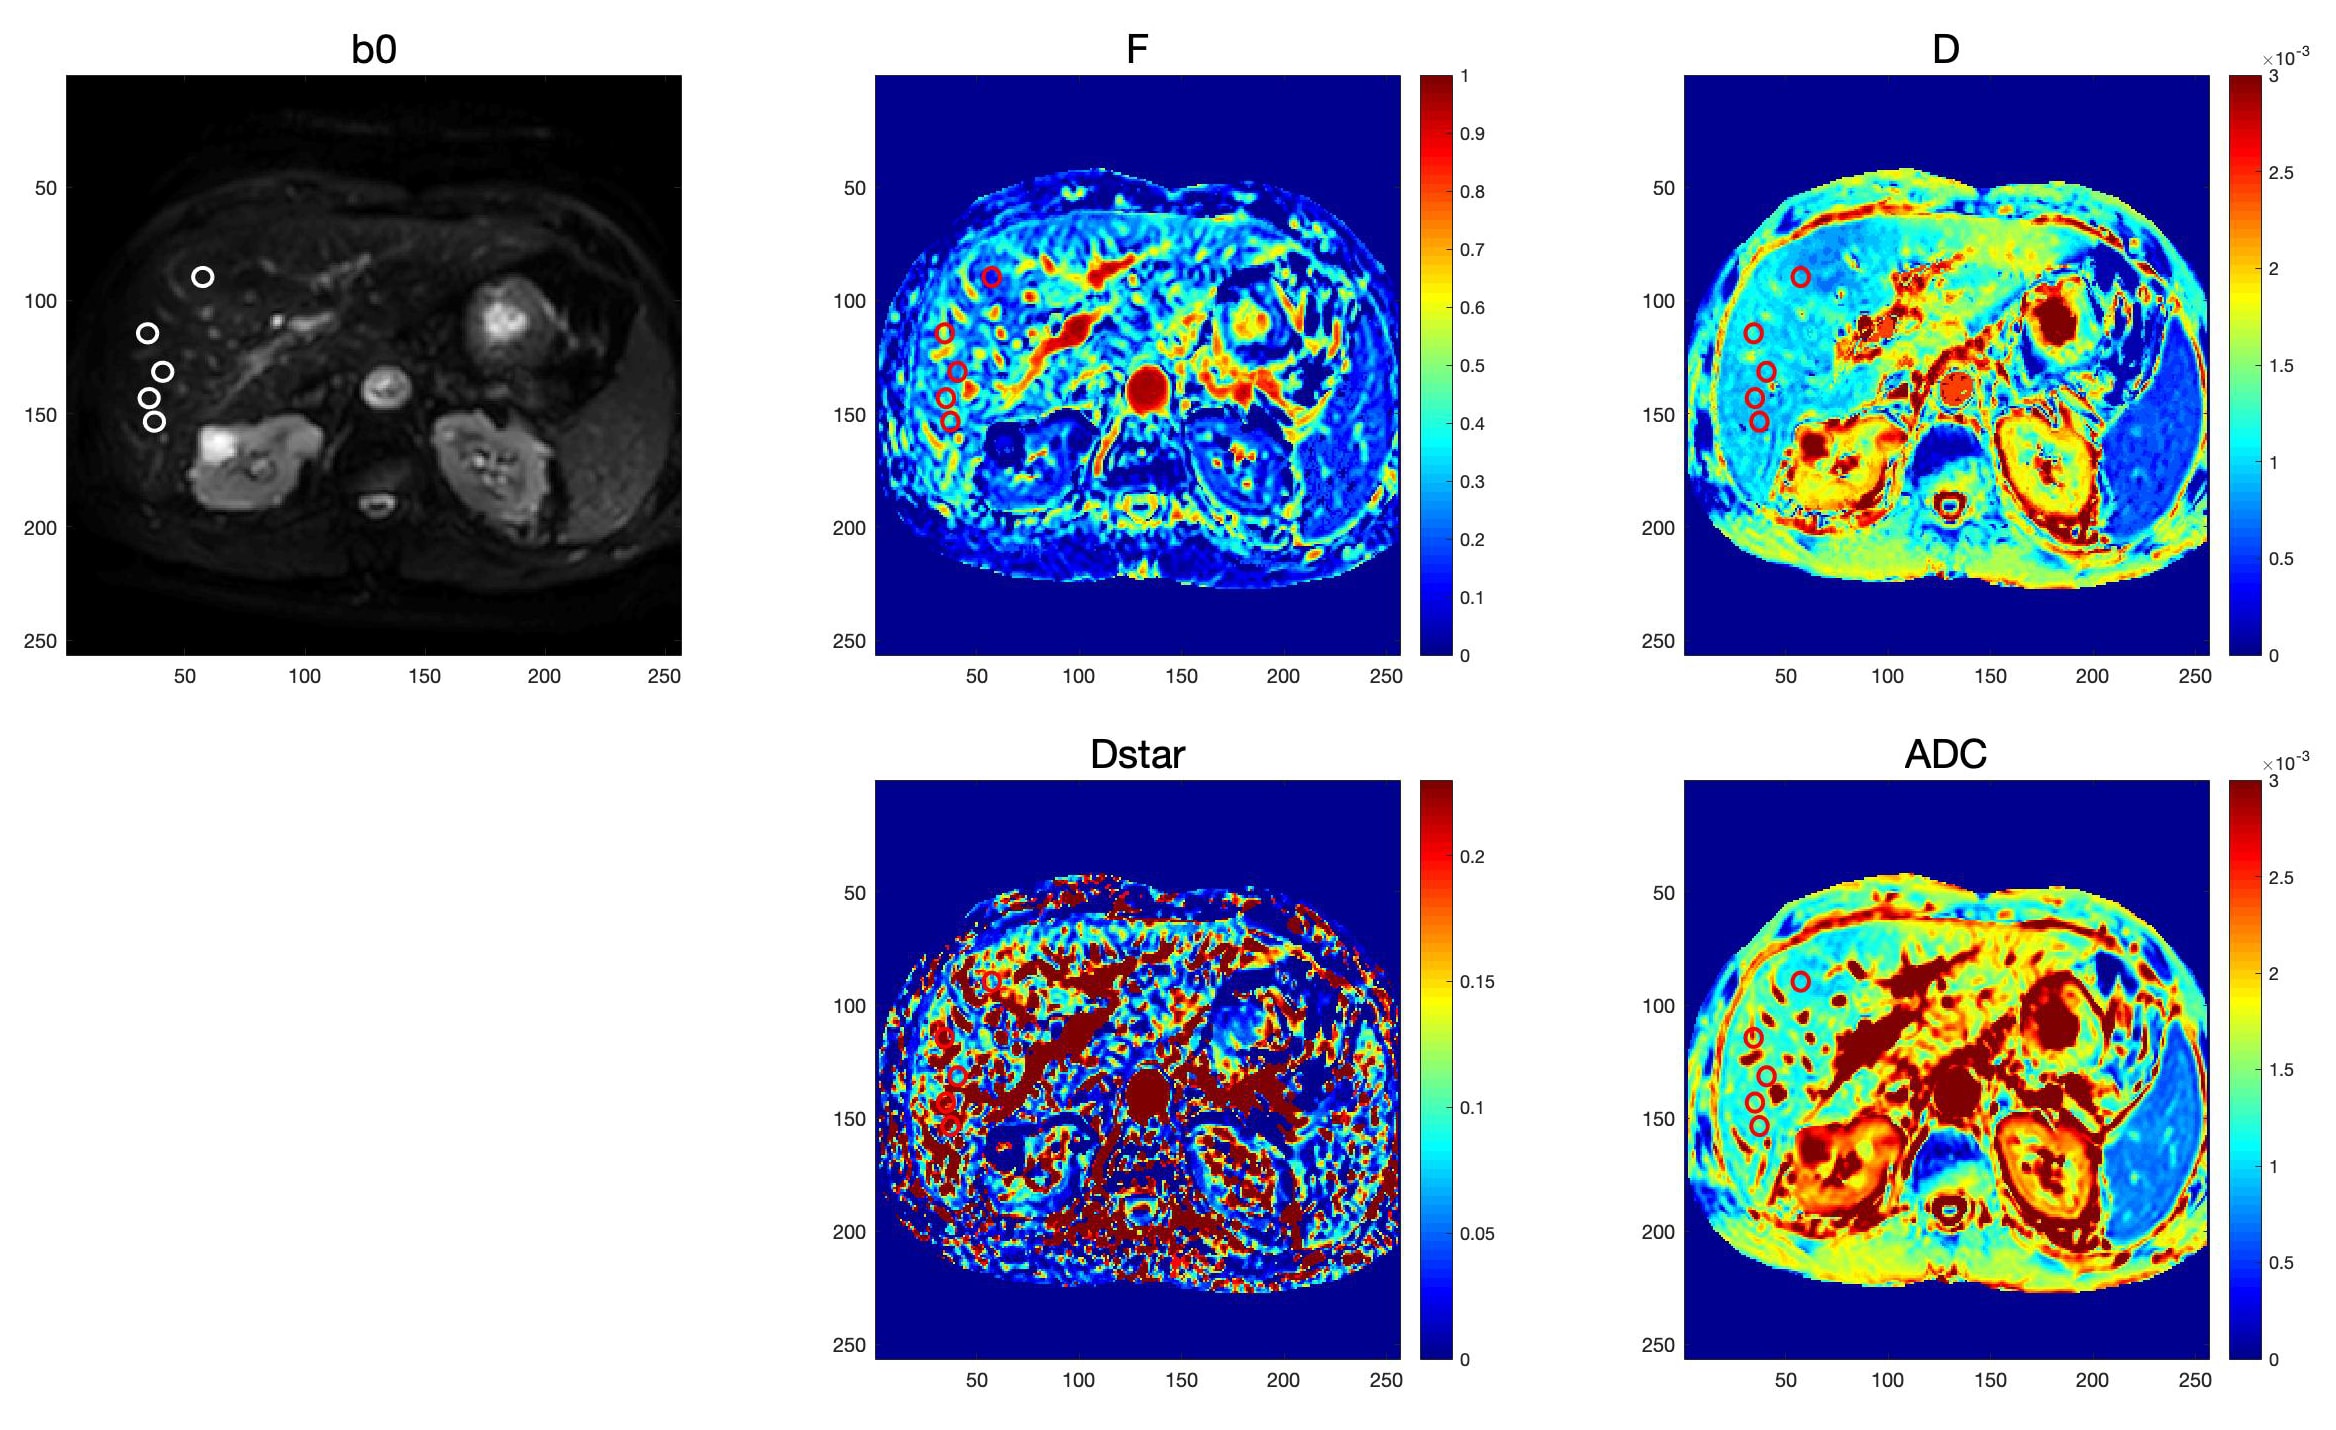
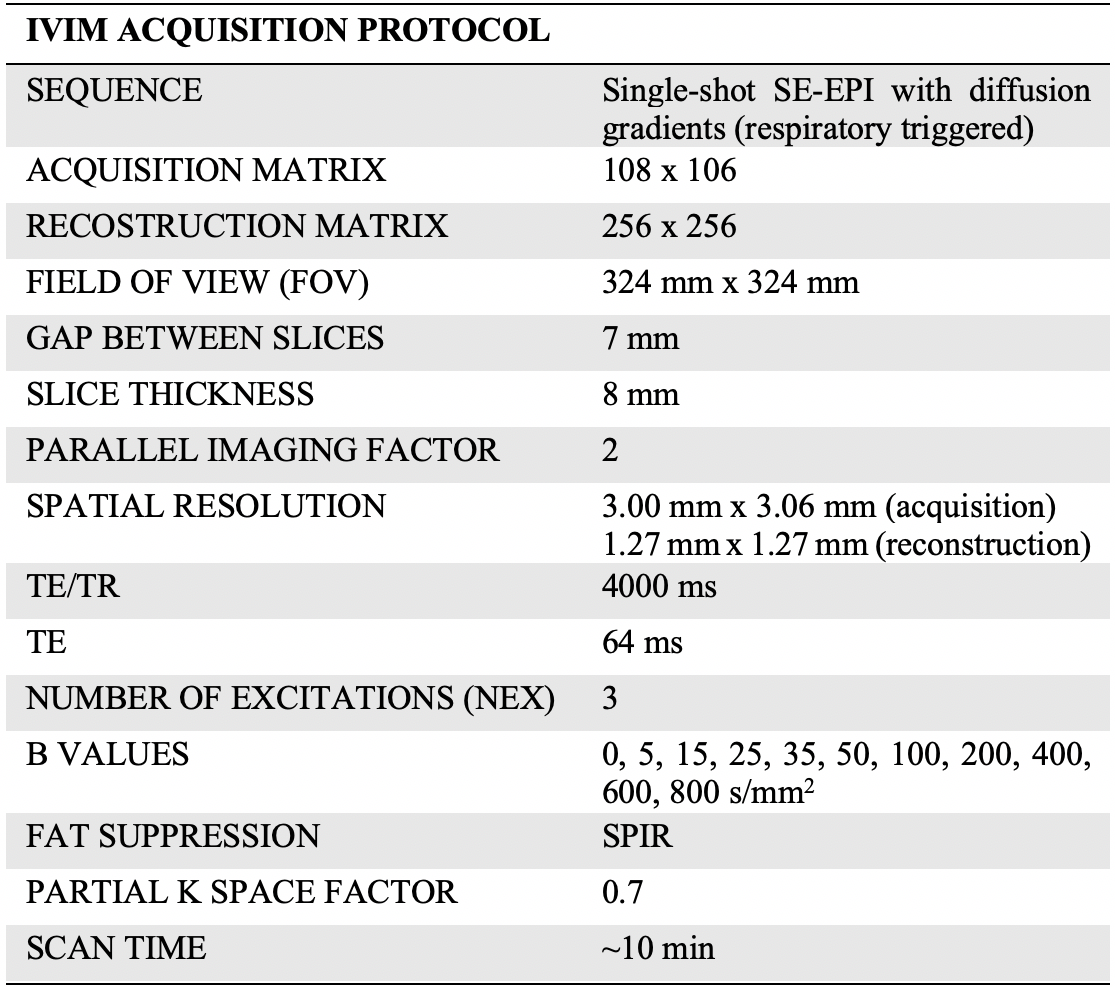
Diffusion Acquisition Protocol and Image Analysis: The diffusion acquisition protocol is described in Table 1. A Bayesian theory-based algorithm was applied for the IVIM maps estimation7. The method was implemented with a multiscale approach to reduce the computational burden of the posterior sampling. The joint posterior distribution was computed in two steps: first with a coarse sampling covering all the search space, to find an approximate solution, and then with a fine sampling, in a neighbourhood around the previous estimation. The ADC map was computed using a weighted least square fitting considering all the b-values. 5 circular ROIs of 10 mm diameter were manually placed in the right liver lobe on the b0 images for each diffusion parameter, avoiding MRI artifacts and large vessels [Fig.2]. ROI mean values were calculated.
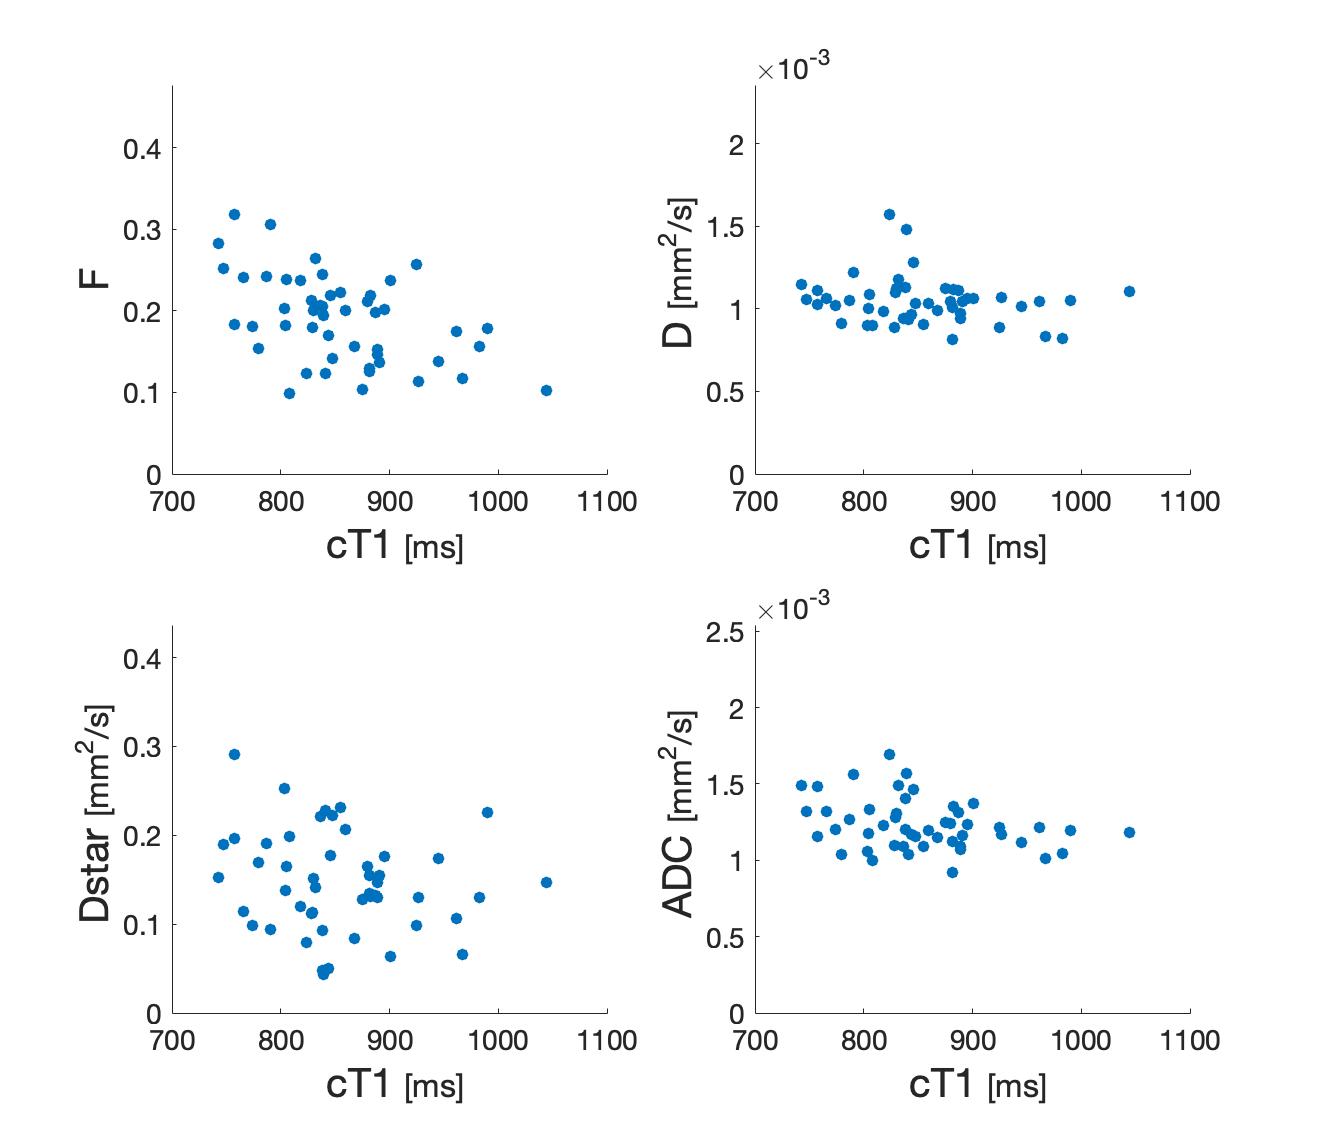
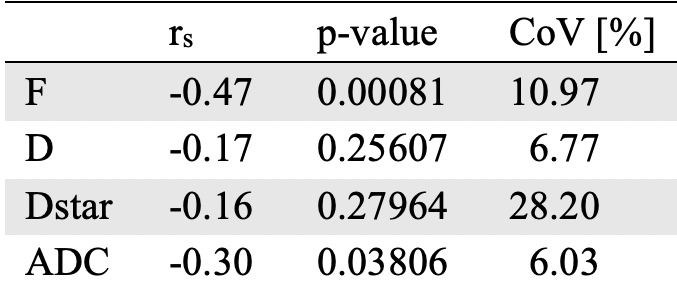
Statistical Analysis: Patients with PDFF or iron load above the normal range (PDFF>5.6%, T2*<11ms)8-10 were excluded from the study. The mean value of all the ROI estimates computed among the slices for the cT1, IVIM parameters and ADC are used to represent the patient. The Spearman correlation coefficient was used to calculate the degree of association. The coefficient of variation (CoV) of the ROI-estimates among the slices was computed for each patient to reflect the inter-slice variability and the mean CoV was reported for each diffusion parameter [Fig.3, Table 2].
RESULTS
The statistical analysis was performed on 49 patients [Fig.1]. The vascular volume fraction F showed the strongest negative correlation (rs = -0.47, p<0.001) with cT1 measurements among the diffusion parameters. ADC showed a mild correlation (rs= -0.30, p<0.05), while no correlation was found with the diffusion and pseudo-diffusion coefficients D and Dstar. The CoV for those parameters are 10.97% for F, 6.77% for D, 28.20% for Dstar and 6.03% for ADC [Fig.3].DISCUSSION
A Bayesian estimation algorithm implementation was proposed to deal with the ill-conditioned problem and a b-value distribution for high perfusion regime organs including numerous low b-values was chosen. The multiparametric acquisition protocol allowed exclusion of patients with complementary factors (steatosis, iron load) that could confound the IVIM measurements. The vascular volume fraction F was found to have a statistically relevant correlation with cT1 (rs =-0.47, p<0.001). The decrease in F was already reported in former studies1 and may reflect the influence of the increased proportion of extracellular matrix in fibrosis which reduces the volume of hepatic sinusoid.CONCLUSION
The proposed multiparametric protocols added useful information to the study of IVIM parameters, providing quantitative measurements of the potential confounding factors and supporting strategies to deal with them. A correlation between the vascular volume fraction F and cT1 measurements was found. However, further studies are needed to achieve a deeper understanding of the IVIM clinical reliability for liver fibrosis assessment.Acknowledgements
This study was supported by Grant from AbbVie.References
- Li Y. T., Cercueil J.-P., Yuan J., Chen W., Loffroy R., & Wáng, Y. X. J. (2017). Liver intravoxel incoherent motion (IVIM) magnetic resonance imaging: a comprehensive review of published data on normal values and applications for fibrosis and tumor evaluation. Quantitative Imaging in Medicine and Surgery, 7(1), 59–78. https://doi.org/10.21037/qims.2017.02.03.
- Lemke A., Stieltjes B., Schad L. R., & Laun F. B. (2011). Toward an optimal distribution of b values for intravoxel incoherent motion imaging. Magnetic Resonance Imaging, 29(6), 766–776. https://doi.org/10.1016/j.mri.2011.03.004.
- França M., Martí-Bonmatí L., Alberich-Bayarri Á., Oliveira P., Guimaraes S., Oliveira J., … Miranda H. P. (2017). Evaluation of fibrosis and inflammation in diffuse liver diseases using intravoxel incoherent motion diffusion-weighted MR imaging. Abdominal Radiology, 42(2), 468–477. https://doi.org/10.1007/s00261-016-0899-0.
- Banerjee R., Pavlides M., Tunnicliffe E. M., Piechnik S. K., Sarania N., Philips R., … Neubauer S. (2014). Multiparametric magnetic resonance for the non-invasive diagnosis of liver disease. Journal of Hepatology, 60(1), 69–77. https://doi.org/10.1016/j.jhep.2013.09.002.
- Foucher J., Chanteloup E., Vergniol J., Castéra L., Le Bail B., Adhoute X., … De Lédinghen V. (2006). Diagnosis of cirrhosis by transient elastography (FibroScan): A prospective study. Gut, 55(3), 403–408. https://doi.org/10.1136/gut.2005.069153.
- Perspectum (2018), LiverMultiScan. https://perspectum-diagnostics.com/technology-and-services/livermultiscan. Accessed 1 November 2018.
-
Neil J. J., & Bretthorst G. L. (1993). On the use
of bayesian probability theory for analysis of exponential decay date: An
example taken from intravoxel incoherent motion experiments. Magnetic Resonance in Medicine, 29(5),
642–647. https://doi.org/10.1002/mrm.1910290510.
-
Szczepaniak et al. (2015). Magnetic resonance
spectroscopy to measure hepatic triglyceride content: prevalence of hepatic
steatosis in the general population. Am J
Physiol Endocrinol Metab, 288(2),
E462-8.
- Nuttall et al (2003), Reference Limits for Copper and Iron in Liver Biopsies. Ann Clin Lab Sci, 33(4), 443-50.
- Wood, J. C., & Ghugre, N. (2008). Magnetic Resonance Imaging Assessment of Excess Iron in Thalassemia, Sickle Cell Disease and Other Iron Overload Diseases. Hemoglobin, 32(1-2), 85–96. https://doi.org/10.1080/03630260701699912.
Figures