3436
Ex vivo Structural Connectomics of the Mouse Brain Subcortical Regions1GAIST, Incheon, Korea, Republic of, 2Lee Gil Ya Cancer & Diabetes Institute, Incheon, Korea, Republic of
Synopsis
Parkinson's disease (PD) is one of the degenerative brain disease and the hallmark of PD is the death of dopaminergic cells. The subcortical area involved in neuronal circuits which play a central role in the motor control. Structural connectivity can identify abnormal connectivity of neural circuits. Diffusion tensor imaging (DTI) is a non-invasive technique that has been used to delineate the internal anatomy by tracing white matter tracts. In this study, we investigated ex vivo diffusion MR images using perfusion methods and identify the structural connectivity in subcortical regions. In conclusion, we provide structural connectional fingerprints in the mouse model.
Introduction
Parkinson's disease (PD) is a degenerative brain disease that exhibits behavioral characteristics such as tremor at rest and physical exhaustion due to the loss of dopaminergic neurons.1 The hallmark of PD is the death of dopaminergic cells in substantia nigra pars compacta (SNc), but as the disease progresses, neural degeneration spreads to the rest of the brain.2 Subcortical structures belong to multiple neuronal circuit that are involved in the integration and execution of motor, cognitive and emotional function.3 Morphological alterations and disrupted afferent/efferent connections have been related to a variety of neurological disorders including psychiatric and movement disorders.4 Connectomics has been considered to be an important factor in studying brain network in relation to health and disease.5 However, there are no studies regarding diffusion-based connectivity analysis using mouse models. The purpose of the present study was to investigate ex vivo diffusion MR images using perfusion methods and identify the structural connectivity between subcortical regions.Methods
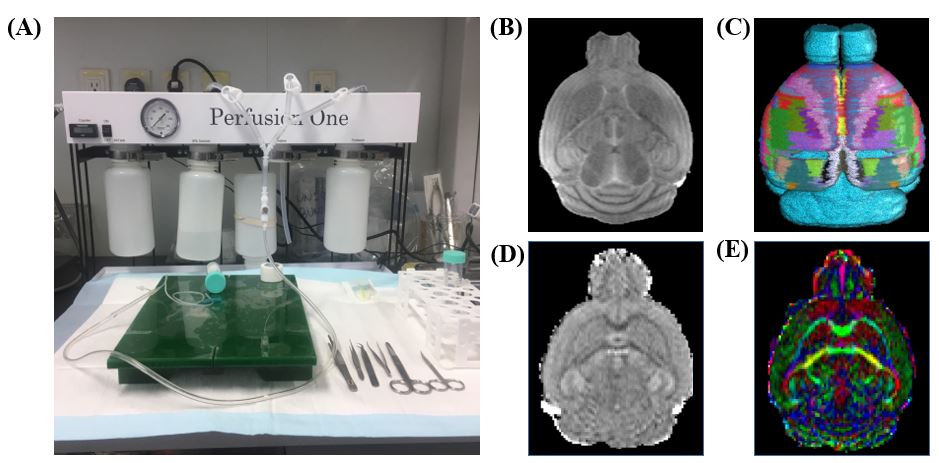
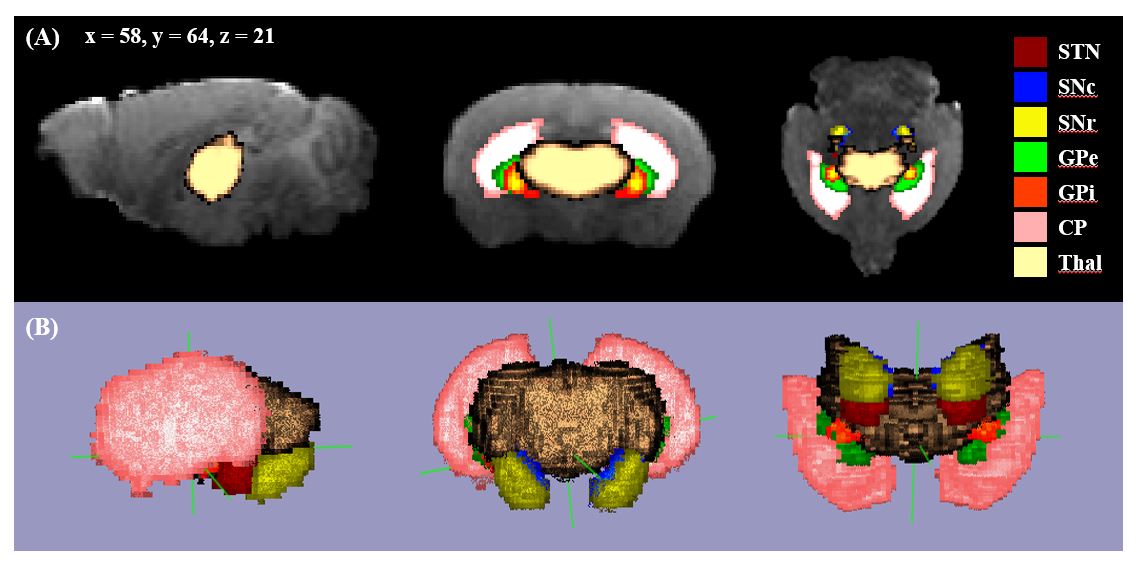
Animals were transcardially perfused and fixed with 4% paraformaldehyde and 0.1% Magnevist®. Mice were decapitated and had excess skin/muscle removed from the skull. Brain with the remaining intact skulls were post-fixed in 0.1% Magnevist/phosphate buffer for 4 days, placed in Fomblin and imaged on a 9.4T scanner (Bruker Biospec, Germany). T2-weighted images were acquired with a 2D turbo rare sequence with repetition time=4624.5 ms, echo time=22.72 ms, bandwidth=75 kHz, field of view=1.3ⅹ1.0 and matrix=256ⅹ196. Diffusion MRI was acquired with a 2D diffusion-weighted spin-echo sequence with repetition time=12000 ms, echo time=33.63 ms, bandwidth=300 kHz, field of view=1.8ⅹ1.6, matrix=120ⅹ120 and b-value=2000 s/mm2 Image data were brain extracted using Atlas Normalization Toolbox using elastix (ANTx). Subcortical regions (e.g., STN, SNc, SNr, GPe, GPi, CP, Thal) was segmented using the parcellation scheme (e.g., warping allen brain atlas to target images) using FSL's FLIRT. Fiber data for probabilistic tractography were reconstructed using FSL’s BEDPOSTX. Probabilistic tractography was performed using FSL’s PROBRACKX. Tracking parameters included the number of samples was P=5000, the number of steps S=2000 with a step length of 0.05 mm, and curvature threshold C=0.1. In order to compare similarities with ABA data, we performed 3D colocalization and connectivity-based comparisons of diffusion tractography data with ABA neuronal tracer data.Results
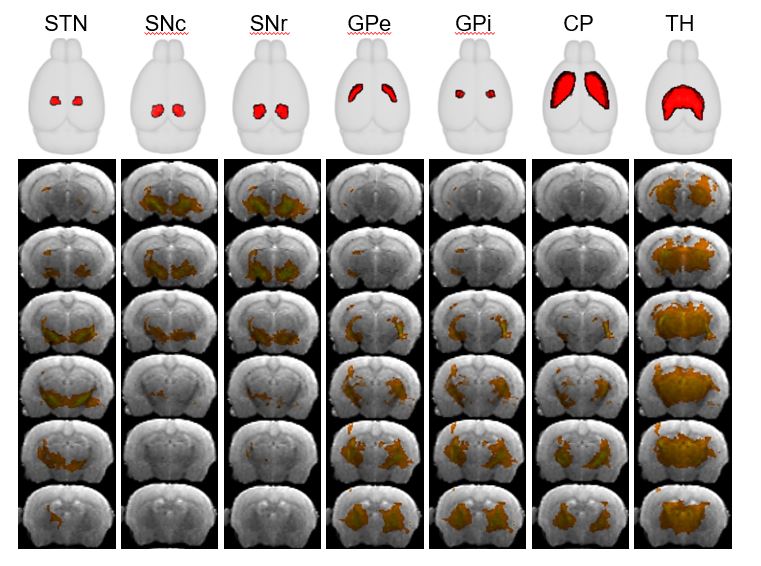
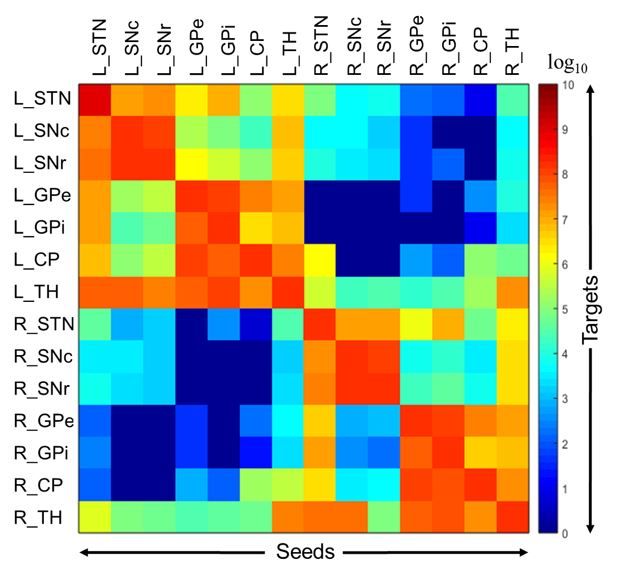
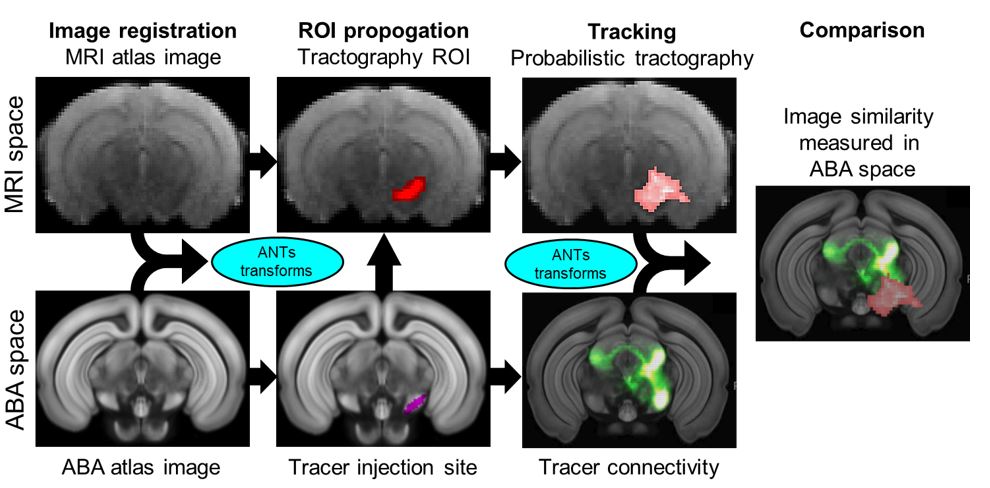
Figure 1 shows comprehensive perfusion experiment system and schematic of the tractography data-processing pipeline (e.g., automated atlas-based segmentation, fractional anisotropy). Examples of the subcortical segmentation and 3D reconstruction of mouse brain are presented in Figure 2. Seven structures of interest in each hemisphere (e.g., STN, SNc, SNr, GPe, GPi, CP, Thal) were described. Figure 3 represents seven connectivity maps presented as color overlays on top of anatomic MR images. These seed region connectivity maps represent all connections from a given region to the rest of the brain. To generate brain-wide connectivity matrices, probabilistic tractography waypoints were used. Connectivity estimates were generated for seven seed region tractography datasets and anatomic regions (Figure 4). As a result, 4 different connectivity matrices were generated-right seeds to right targets, right seeds to left targets, left seeds to right target, and left seeds to left targets. Figure 5 shows the direct comparison with neuronal tracer data from ABA in the SNr.Discussion
In this research, we performed formalin-fixed perfusion of mouse brain and structural connectivity analysis of the subthalamic nucleus, substantia nigra, globus pallidus, caudoputamen, and thalamus. An important advantage of ex vivo diffusion weighted imaging over in vivo imaging is the capability for a longer scan time. This advantage facilitates diffusion image capture with higher resolution, higher contrast, and lower noise.6 Diffusion tractography of small animals offers brain-wide connectivity maps and proves useful for identifying aberrant connectivity in models of neurologic and psychiatric diseases.7 In Figure 3, connectivity maps were constructed using probabilistic tractography which takes into account the intra-voxel crossing fibers and estimates the pathways that originate at any given seed voxel, which gives a general quantification about the white matter tracts that surround the target mask.8 We compared our data with a neuronal tracer-based connectivity data from the Allen Brain Atlas. Tractography data were produced corresponding to the SNr neuronal tracer injection site (e.g., SNr) included in the ABA mouse connectivity atlas (Fig.5).7 We observed relatively moderate correspondence with neuronal tracer data, with regard to 3D colocalization analysis. This study shows that high-field ex vivo structural connectivity allows for detailed 3D reconstruction of the projections of subcortical regions in mouse.Conclusion
In this work, we investigated comprehensive, ex vivo, structural connectome of the mouse subcortical regions. Using perfusion methods, we segmented the mouse subcortical structures and visualized structural connectivity. Our research can be applied to future study in mouse disease models (e.g., Parkinson’s disease) and opens the way to future investigation in preclinical research.Acknowledgements
This research was supported by Brain Research Program through the National Research Foundation of Korea (NRF) funded by the Ministry of Science and ICT (NRF-2017m3c7a1044367).References
1. Federico N, Umberto S, Olivier R, et al. Parkinson’s disease and local atrophy in subcortical nuclei: insignt from shape analysis. Neurobiology of aging. 2015;35:424-433.
2. Sterling N, Lewis M, Du G, et al. Structural imaging and Parkinson’s disease: Moving toward quantitative markers of disease progression. Journal of Parkinson’s disease. 2016;6:557-567.
3. Sonia P, Ryan C, Sophie B, et al. In vivo exploration of the connectivity between the subthalamic nucleus and the globus pallidus in the human brain using multi-fiber tractography. Frontiers in neuroanatomy. 2017;10:119.
4. Jeremy F, Charles W, Andrew L, et al. An MRI atlas of the mouse basal ganglia. Brain struct funct. 2014;219:1343-1353.
5. Neels S, Anna E, Hsu-Lei L, et al. The connectomics of brain demyelination: Functional and structural patterns in the cuprizone mouse model. 2017;146:1-18.
6. Birgit R, Alard R, Valentin G, et al. Ultra-high field MRI post mortem structural connectivity of the human subthalamic nucleus, substantia snigra, and globus pallidus. 2016;10:66.
7. Evan C, Alexandra B, Gary C, et al. A diffusion MRI tractography connectome of the mouse brain and comparison with neuronal tracer data. Cerebral Corex. 2015;25:4628-4637.
8. Evangelia T, Angela D, William S, et al. The potential value of probabilistic tractography-based for MR-guided focused ultrasound thalamotomy for essential tremor. Neuroimage. 2018;1019-1027.
Figures