3435
Structural and Functional Characteristics of the Common Marmoset Brain Assessed Using Connectome Analysis1Radiological Sciences, Tokyo Metropolitan University Graduate School, Tokyo, Japan, 2Department of Physiology, Keio University School of Medicine, Tokyo, Japan, 3Laboratory for Marmoset Neural Architecture, Center for Brain Science, RIKEN, Wako, Japan, 4Live Imaging Center, Central Institute for Experimental Animals, Kawasaki, Japan
Synopsis
Connectome analysis with magnetic resonance imaging (MRI) is a non-invasive method and is an important approach for assessing brain networks and neurological diseases from a multilateral perspective. We examined the structural and functional characteristics of the common marmoset brain using structural and functional connectome analyses. For these connectome analyses, diffusion-weighted imaging and true-awake resting-state functional MRI (rsfMRI) were performed using a 9.4-T MRI scanner. The structural connectome analysis showed that the visual region had the most prominent structural characteristics in the marmoset brain. In addition, functional connectome analysis indicated that the functional connectome results were affected by the rsfMRI environment.
Introduction
In neuroscience, a connectome refers to the brain regions and their interconnections.1 It is particularly important in studies involving small disease model animals because it can confirm aberrant connectivity associated with neurological diseases.2 The comparison and evaluation of the results of structural and functional connectome analyses are important to understand brain networks and neurological diseases from multilateral perspectives.3
In this study, we examined the structural and functional characteristics of the common marmoset brain by conducting structural and functional connectome analyses.
Methods
This study was conducted in the common marmoset (Callithrix jacchus), which has been used in recent neuroscience research. All imaging scans were performed using a 9.4-T magnetic resonance imaging (MRI) scanner (BioSpec 94/30; Bruker BioSpin, Ettlingen, Germany).
In the structural connectome analysis, the MRI protocol was applied to 10 healthy common marmosets (mean age, 3.2 ± 0.4 years; seven males and three females). Diffusion-weighted imaging was performed with the following parameters: spin echo (echo-planar imaging [EPI]); six shots; repetition time (TR)/echo time (TE) = 3,000/25.57 ms; diffusion gradient characteristics (δ/∆) = 6/12 ms; 30/60 diffusion directions with b-values of 1,000/3,000 s/mm2 (+4 b-values of 0 s/mm2); resolution = 350 × 350 × 700 µm; three averages; total acquisition time = approximately 1.5 h. Fiber tractography was conducted for each brain using a multi-shell multi-tissue constrained spherical deconvolution (msmt CSD) algorithm in MRtrix3. In addition, structural connectivity matrices between ROIs that was comprised of 52 anatomical regions in the brain hemisphere were generated from the derived fiber tractography data (Fig. 1a).
In functional connectome analysis, the MRI protocol was applied to a healthy male common marmoset (age, 3.2 years). Resting-state functional imaging (true awake) was performed with the following parameters: gradient spin echo (EPI); TR/TE = 2,000/16 ms; isotropic resolution = 700 µm; 2.0 s/volume (total acquisition time = 200 min). Functional magnetic resonance images were preprocessed, and functional correlation coefficients between ROIs were generated (Fig. 1b).
This study was approved by the animal experiment committee at Riken Center for Brain Science (CBS) in Japan and was conducted in accordance with the Riken CBS guidelines for animal experiments.
Results
Figure 2 shows the average connectivity matrix and map of the structural connectome analysis. Structural connections were remarkably strong in the visual cortex, deep gray matter, and frontal cortex of the common marmoset brain. In addition, it was found that the visual cortex had strong structural connections with the parahippocampal gyrus. Fiber tractography images of these regions are shown in Figure 3.
Figure 4 shows the average connectivity matrix and map of the functional connectome analysis. The functional connections under the awake condition showed significantly high correlations for the prefrontal cortex (PFC) and orbital frontal cortex (OFC), primary somatosensory cortex (S1) and primary motor cortex (M1), and nucleus accumbens (NAcc) on both sides of the brain. In addition, this result indicated that the functional correlations between the same brain regions in the left brain and the right brain were relatively high.
Discussion
・Structural Connectivity
During evolution, primates are believed to rely heavily on visual information.4 In particular, in the marmoset brain, V1 was found to be a large region occupying 14.5% of the gray matter mass.5 The remarkable connections in the visual region identified here are consistent with the results of these previous studies. 4,5 In addition, fiber tractography analysis has a characteristic that creates more stronger connections between nearby regions. It is possible that this feature affected connections in the deep gray matter and frontal cortex.
・Functional Connectivity
The PFC and OFC are involved in suppressing/regulating emotions, actions against those emotions and decision making.6–8 The NAcc is involved in the formation of memories associated with salient environmental stimuli.9 The S1 and M1 regions are involved in merging and exchanging multimodal information through cortical–subcortical connections.10 We infer that the common marmoset in an awake state showed brain activation associated with the MRI scanning environment. In other word, the scanning environment might have a great influence on functional connectome analysis in an awake state.
Conclusion
We showed the structural and functional characteristics of the common marmoset brain using connectome analysis. In addition, our data indicate that it may include the characteristics of the analysis methods and the influence of the MRI environment besides the characteristics of the marmosets’ brain itself.Further studies are required to establish more accurate connectome analysis methods.
In the future, we will apply this approach to animal models involving neurological diseases, such as Parkinson's disease, and we aim to provide findings that contribute to clinical medicine.
Acknowledgements
This research is partially supported by the program for Brain Mapping by Integrated Neurotechnologies for Disease Studies (Brain/MINDS) from Japan Agency for Medical Research and development, AMED
References
- Sporns O, Tononi G, Kötter R. The human connectome: A structural description of the human brain. PLoS Computational Biology 2005;1: 0245-0251
- Calabrese E, Badea A, Cofer G et al. A Diffusion MRI Tractography Connectome of the Mouse Brain and Comparison with Neuronal Tracer Data. Cerebral Cortex 2015;25: 4628–4637
- Greicius MD, Supekar K, Menon V et al. Resting-state functional connectivity reflects structural connectivity in the default mode network. Cereb Cortex. 2009;19:72-78
- Jude F. Mitchell and David A. Leopold. The marmoset monkey as a model for visual neuroscience. Neurosci Res. 2015;93:20-46
- Collins CE, Leitch DB, Wong P et al. Faster scaling of auditory neurons in cortical areas relative to subcortical structures in primate brains. Brain Struct Funct. 2013;81:805-816
- Michael P, Bessie A, and Stephen F. Differential activation of the human orbital, mid-ventrolateral, and mid-dorsolateral prefrontal cortex during the processing of visual stimuli. PNAS April 16, 2002; 99: 5649-5654
- Ono T, Tabuchi E. Ganka Zentouzenya no kinou [Function of orbital frontal cortex]. Advances in neurological sciences 1993;37(1):56-71
- Sakagami M, Pan X. Functional role of the ventrolateral prefrontal cortex in decision making. Curr Opin Neurobiol. 2007 Apr;17(2):228-33. Epub 2007 Mar 9.
- Volman SF, Lammel S, Margolis EB et al. New Insights into the Specificity and Plasticity of Reward and Aversion Encoding in the Mesolimbic System. J Neurosci. 2013; 33: 17569-17576
- Borich MR, Brodie SM, Gray WA et al. Understanding the role of the primary somatosensory cortex: Opportunities for rehabilitation. Neuropsychologia. 2015;79: 246–255.
Figures

Fig. 1 Process Flow Diagram of Connectome Analysis
a) The process of neural structural connectome analysis.
b) The process of functional connectome analysis.

Fig. 2 Neural Structural Connectivity Matrix and Map of the Common Marmoset Brain
a) The average connectivity matrix (10 common marmosets) in neural structural connectome analysis. The values in this image indicate the proportions (%) of the total fiber numbers (1 million in whole brain).
b) The neural structural connections show relatively strong connectivity.

Fig. 3 Tractography Images Showing Strong Structural Connectivity
a) The tractography analysis result of the connections of the visual cortex (V1, V2, V3, MT, and V6) and the parahippocampal gyrus.
b) The tractography analysis result of the connections of the deep gray matter.
c) The tractography analysis result of the connections of the frontal cortex.
Each figure includes the coordinate axes of each MR image and some brain region names relates to the structural connections.
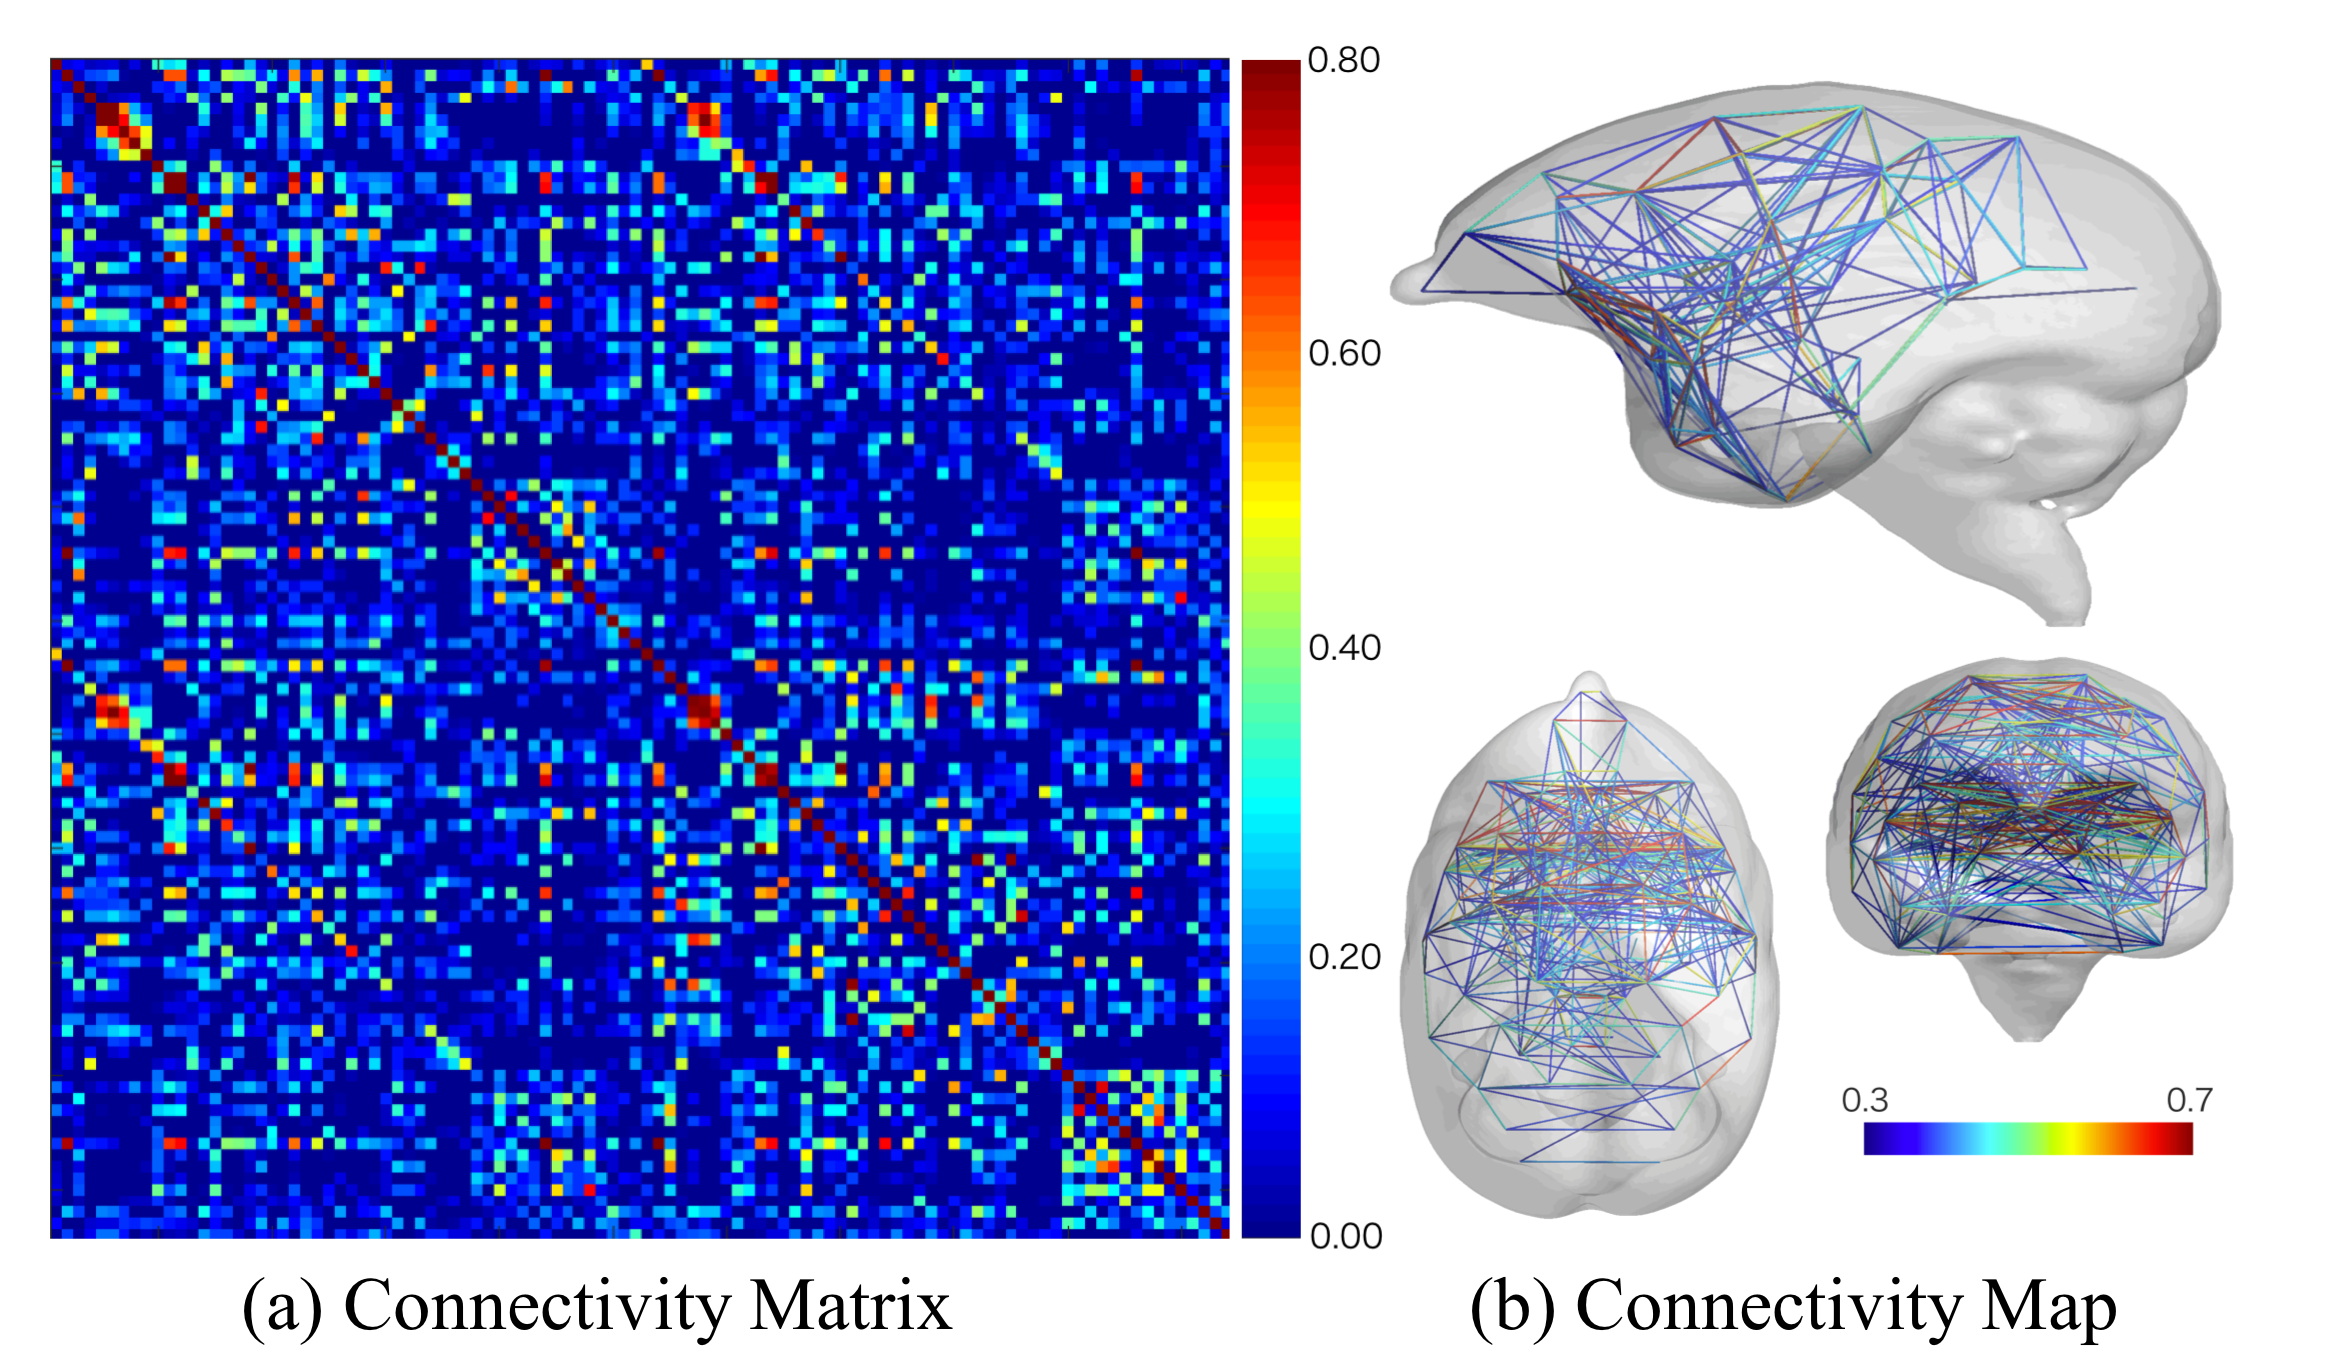
Fig. 4 Functional Connectivity Matrix and Map of the Common Marmoset Brain
a) Connectivity matrix in functional connectome analysis. The values in this image indicate the correlation coefficients.
b) The functional connections show relatively strong connectivity.