3431
Diffusion MRI detects changes in the Hippocampus and Fimbria-Fornix Circuit in 2 months old 3xTg-AD miceMaria Fatima Falangola1,2, Xingju Nie1,2, Emilie T. McKinnon1,2,3, Joseph A. Helpern1,2,3,4, and Jens H. Jensen1,2,4
1Department of Neuroscience, Medical University of South Carolina, Charleston, SC, United States, 2Center for Biomedical Imaging, Medical University of South Carolina, Charleston, SC, United States, 3Department of Neurology, Medical University of South Carolina, Charleston, SC, United States, 4Department of Radiology and Radiological Science, Medical University of South Carolina, Charleston, SC, United States
Synopsis
The triple transgenic mouse model (3xTg) of Alzheimer’s disease (AD) exhibits both Aβ and tau pathology. Interestingly, the first detectable pathological features in this model are alterations in overall myelination patterns leading to white matte disruption as early as 2 months of age. Here we investigated the sensitivity of diffusion MRI (dMRI) to detect brain changes in young 3xTg mice. Our results indicate that dMRI is able to capture brain microstructural alterations associated with the hippocampus-fimbria-fornix circuit in 2 months-old 3xTg-AD mice, thus demonstrating dMRI as a viable tool for studying abnormal pathology in this AD mouse model.
INTRODUCTION
The 3xTg-AD mouse model has been used extensively as a model of AD1,2 and develops both Aβ and neurofibrillary tangles (NFTs) in a temporal and spatial pattern that is similar to human AD pathology3,4. Interestingly, abnormal myelination patterns with changes in oligodendrocyte and myelin marker expression are early pathological features described in this model even before amyloid and tau-related pathologies are observed, particularly in sub-regions of the hippocampus and the entorhinal cortex5,6. Additionally, significant volumetric differences have been reported for the 3xTg-AD mice in the hippocampal complex and fimbria7. Thus, the goal of this study was to investigate the sensitivity of diffusion MRI (dMRI) to capture brain microstructural alterations associated with the hippocampus and fimbria-fornix circuit in 2 months-old 3xTg-AD mice.METHODS
Female 3xTg (TG, n = 14) and age-matched normosomic littermates (NC, n = 8) mice were studied at 2 months of age. In vivo MRI experiments were performed on a 7T Bruker MRI system (PARAVISION 5.1). A 2-shot SE-EPI dMRI sequence was used for a diffusional kurtosis imaging (DKI) acquisition8. Sequence parameters: TR/TE=3750/32.6ms, δ/Δ=5/18ms, slice thickness =0.7 mm, 15 slices with no gap, data matrix=128×128, image resolution=156×156μm2, 2 signal acquisitions, 10 b-value=0 images, followed by 30 diffusion encoding gradient directions with 4 b-values for each gradient direction (0.5, 1, 1.5, 2 ms/μm2) and fat suppression flip angle=105°. Total acquisition time=33 minutes. Mean diffusivity (MD), axial diffusivity (D‖), radial diffusivity (D┴), fractional anisotropy (FA), mean kurtosis (MK), axial kurtosis (K‖), radial kurtosis (K┴), and kurtosis fractional anisotropy (KFA) were all derived from the DKI dataset (Figure 1) using Diffusional Kurtosis Estimator software (DKE; http://www.nitrc.org/projects/dke)9. Regions of interest (ROIs) at the level of the dorsal (DH) and ventral (VH) hippocampus, fimbria (Fi) and fornix (Fx) were manually drawn in the average b-value=0 images, and verified on the FA maps to ensure correct anatomical location, using ImageJ (http://rsb.info.nih.gov/) (Figure 2). The average regional value for each dMRI metric was obtained from the voxels within each ROI. To minimize the effect of cerebrospinal fluid (CSF) contamination, all voxels with MD ˃1.5 μm2/ms were excluded from the ROIs prior to parameter quantification. Two-tailed paired t-tests were performed to assess differences in the ROI measurements between the two groups.RESULTS
Table 1 shows the group means, standard deviations and p-values for all the diffusion metrics in each ROI. Each ROI was analyzed separately, using all the dMRI metrics, and we considered the results statistically significant at p < 0.05 (uncorrected). For the 3xTg group, in the dorsal hippocampus (Figure 3), MD, D‖ and D┴ were all significantly increased (Figure 3), and K‖ was significantly reduced. In the ventral hippocampus (Figure 4), MD, D‖ and D┴ were significantly increased, with no changes in kurtosis metrics. In the fimbria (Figure 5), FA and KFA were significantly decreased, D┴ was significantly increased, and K┴ was significantly reduced. No statistically significant dMRI changes were observed in the fornix.DISCUSSION & CONCLUSION
Our results indicate that dMRI is able to capture brain pathology in young 3xTg mice. Although preliminary, these results correlate well with previously described morphological changes, where abnormal oligodendrocyte and myelin marker expression are noticeable in the hippocampus of 2 months old 3xTg mice5,6. The hippocampus of 2 months old 3xTg-AD mice had an overall increase of diffusivity metrics (MD, D‖ and D┴) and a decrease in FA and K‖, which could be explained by the ultrastructural changes in myelin sheath integrity and the decline in the total number of myelinated processes demonstrated in this model6. Additionally, significant volumetric differences in the hippocampal complex and fimbria have been reported in young 3xTg-AD mice7, which may also be related to our results. The fimbria and fornix of hippocampus form a complex system of afferent and efferent nerve fibers closely related functionally and structurally with the hippocampal formation and other brain parts, and it is clearly involved in AD pathology10-12. This study is the first application of dMRI to 2 month old 3xTg-AD mice, and it illustrates the sensitivity of dMRI metrics for detecting early pathological features, even before the presence of Aβ and tau pathology.Acknowledgements
This work was supported by the National Institutes of Health (1RF1AG057602-01) and The Litwin Foundation.References
1. Stover KR, et al. (2015) Early detection of cognitive deficits in the 3xTg-AD mouse model of Alzheimer's disease. Behav Brain Res, 289:29–38. 2. Clark JK, et al. (2015) Alterations in synaptic plasticity coincide with deficits in spatial working memory in presymptomatic 3xTg-AD mice. Neurobiol Learn Mem, 125:152–62. 3. Oddo S, et al. (2003) Triple-transgenic model of Alzheimer's disease with plaques and tangles: intracellular Abeta and synaptic dysfunction. Neuron, 39(3): 409-421. 4. Oddo S, et al. (2003) Amyloid deposition precedes tangle formation in a triple transgenic model of Alzheimer's disease. Neurobiol Aging, 24(8):1063-70. 5. Desai MK, et al. (2009) Triple-transgenic Alzheimer's disease mice exhibit region-specific abnormalities in brain myelination patterns prior to appearance of amyloid and tau pathology. Glia, 57(1):54-65. 6. Desai MK, et al. (2010) Early oligodendrocyte/myelin pathology in Alzheimer's disease mice constitutes a novel therapeutic target. Am J Pathol, 177:1422–35. 7. Kong V, et al. (2018) Early-in-life neuroanatomical and behavioural trajectories in a triple transgenic model of Alzheimer's disease. Brain Struct Funct, 223(7):3365-3382. 8. Jensen JH, et al. (2005) Diffusional kurtosis imaging: the quantification of non-gaussian water diffusion by means of magnetic resonance imaging. Magn Reson Med, 53:1432-1440. 9. Tabesh A, et al. (2011) Estimation of tensors and tensor-derived measures in diffusional kurtosis imaging. Magn Reson Med, 65(3):823-36. 10. Clark JK, et al. (2005) Alterations in synaptic plasticity coincide with deficits in spatial working memory in presymptomatic 3xTg-AD mice. Neurobiol Learn Mem, 125:152-162. 11. Stover KR, et al. (2005) Early detection of cognitive deficits in the 3xTg-AD mouse model of Alzheimer's disease. Behav Brain Res, 289:29-38. 12. Liu L, et al. (2002) Fimbria-fornix lesion does not affect APP levels and amyloid deposition in the hippocampus of APP+PS1 double transgenic mice. Exp Neurol, 177(2):565-74.Figures
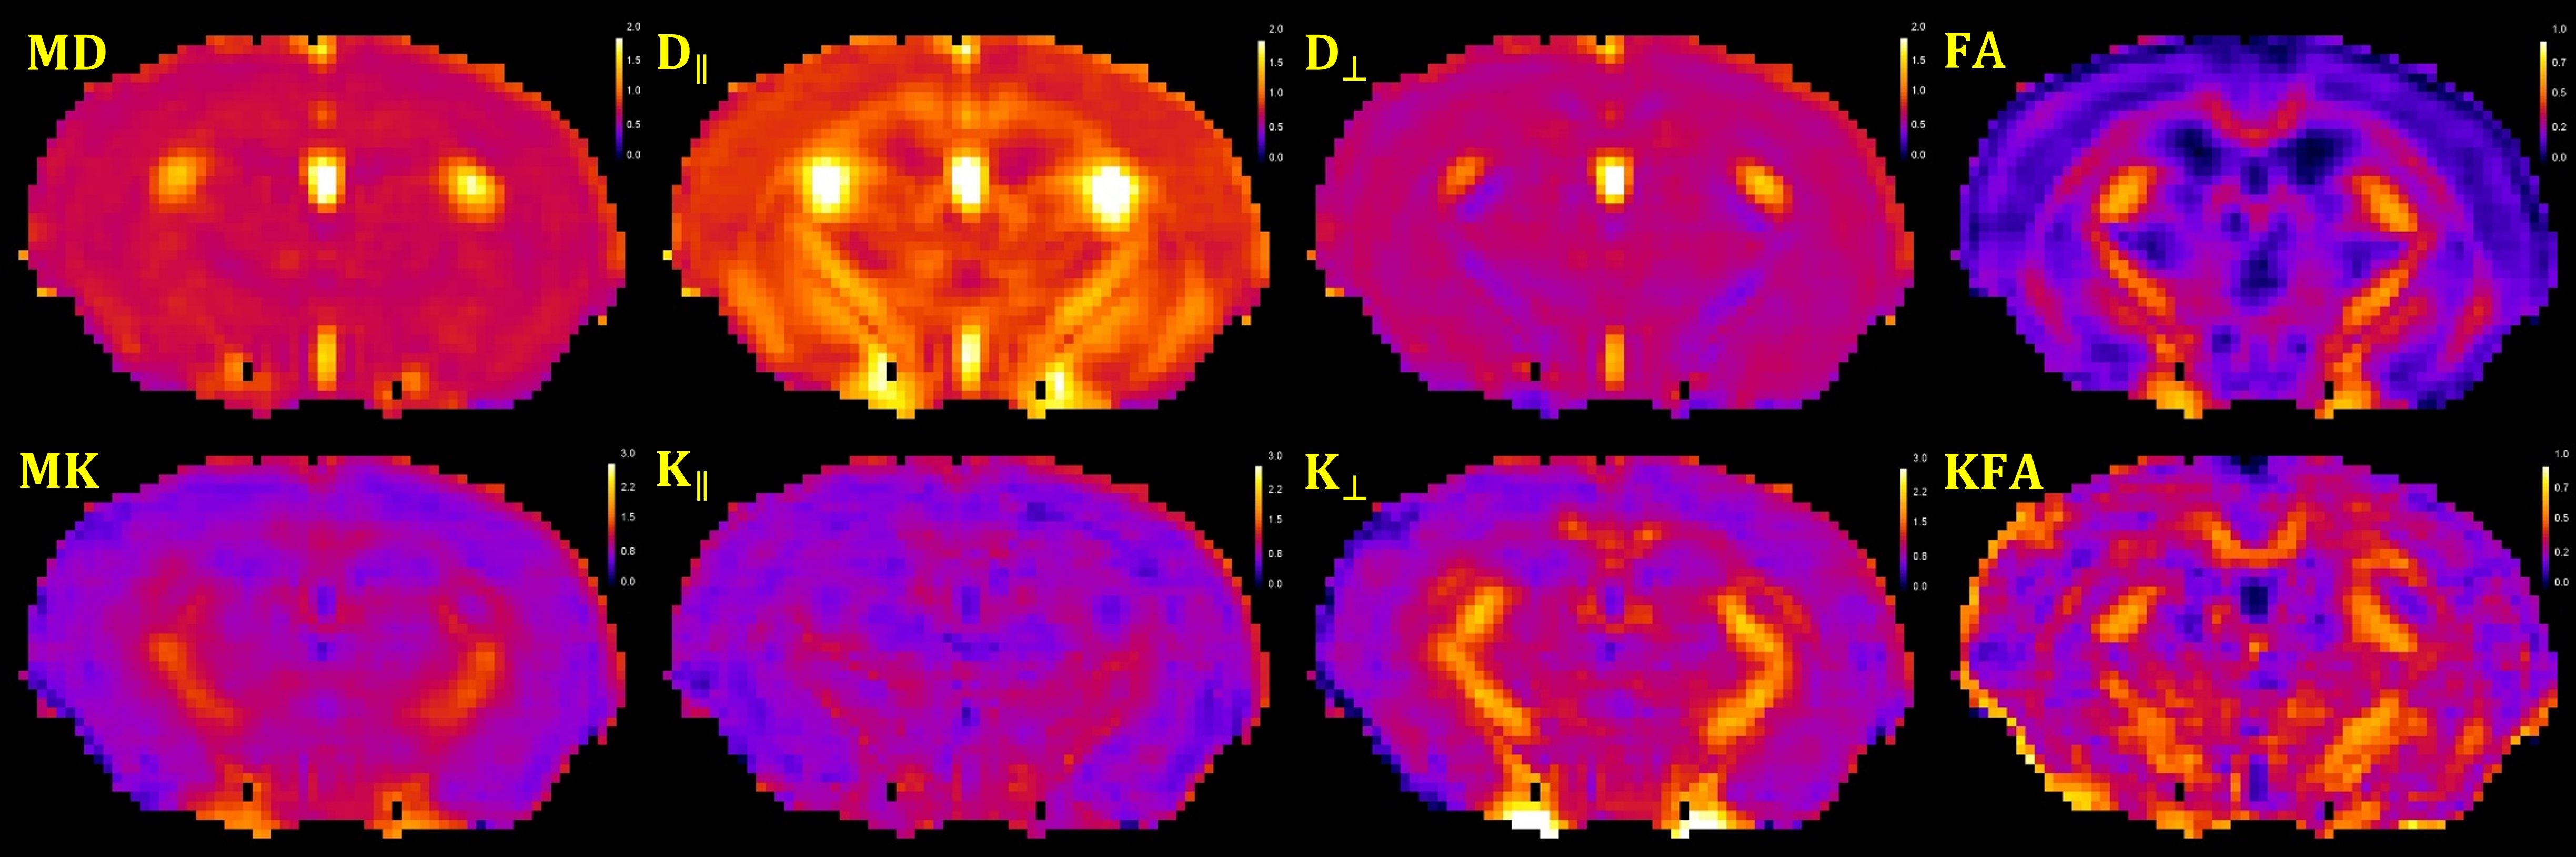
Figure 1: Example of diffusion MRI parametric maps for one
3xTg mouse: Mean (MD), axial (D‖) and radial (D┴)
diffusivity, fractional anisotropy (FA), mean kurtosis (MK), axial (K‖),
radial (K┴)
kurtosis and kurtosis fractional anisotropy (KFA).
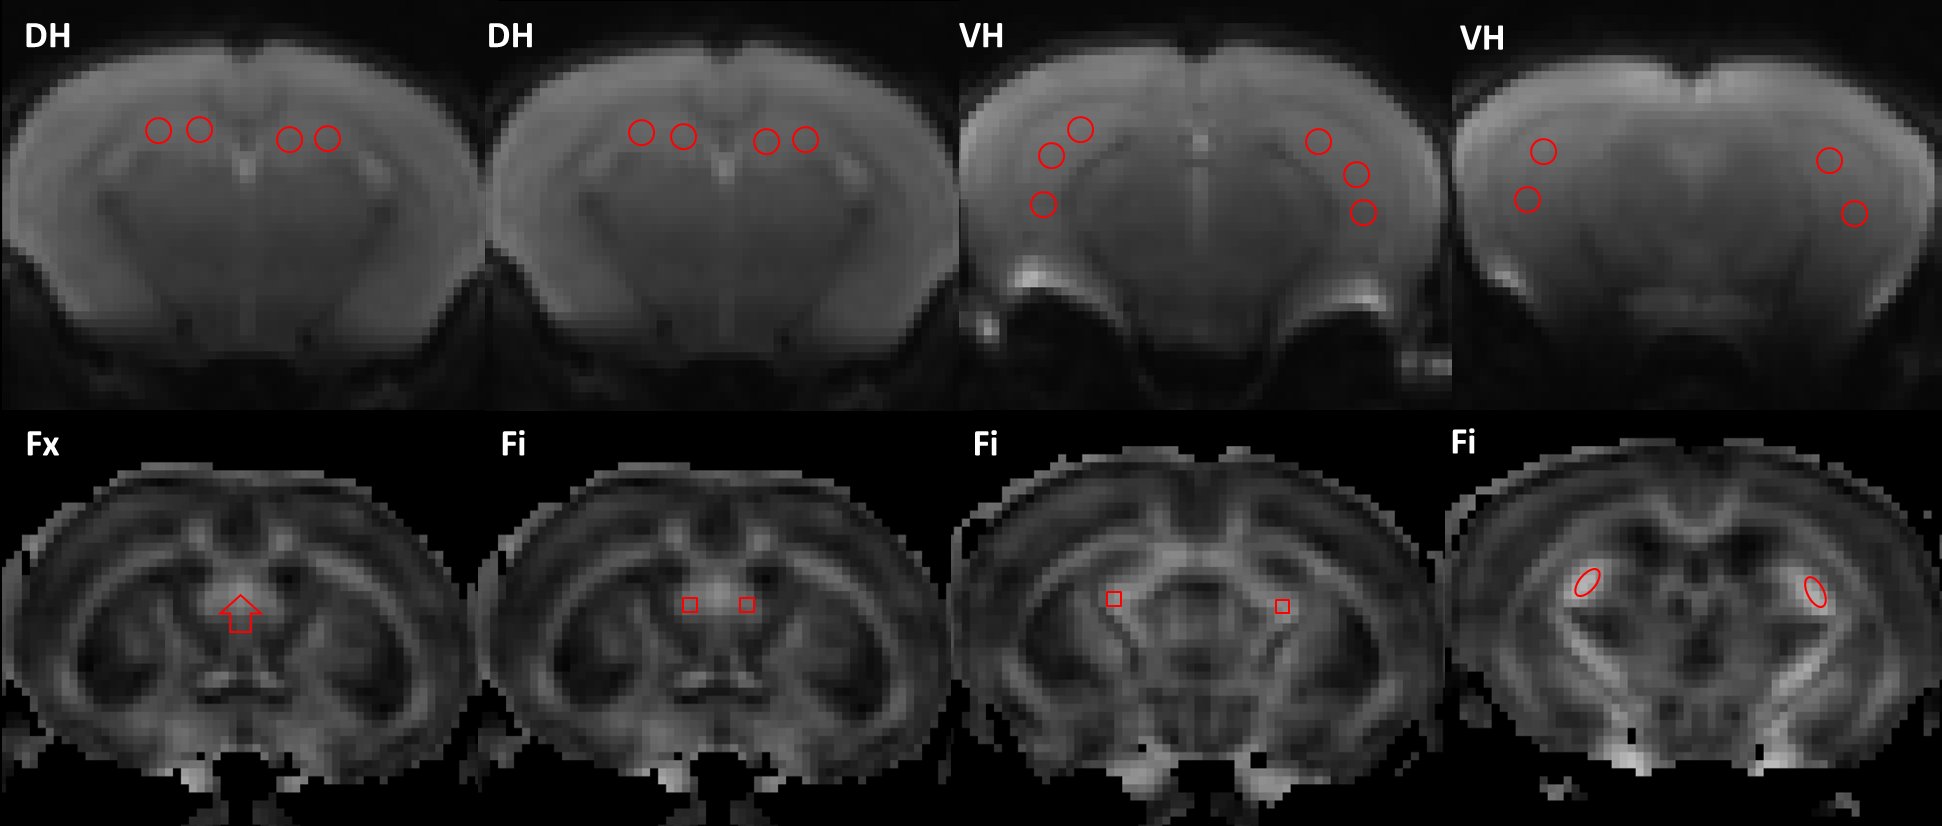
Figure 2: Example of the regions of interest (ROIs) at the level of
the dorsal (DH) and ventral (VH) hippocampus, fimbria (Fi), and fornix (Fx).
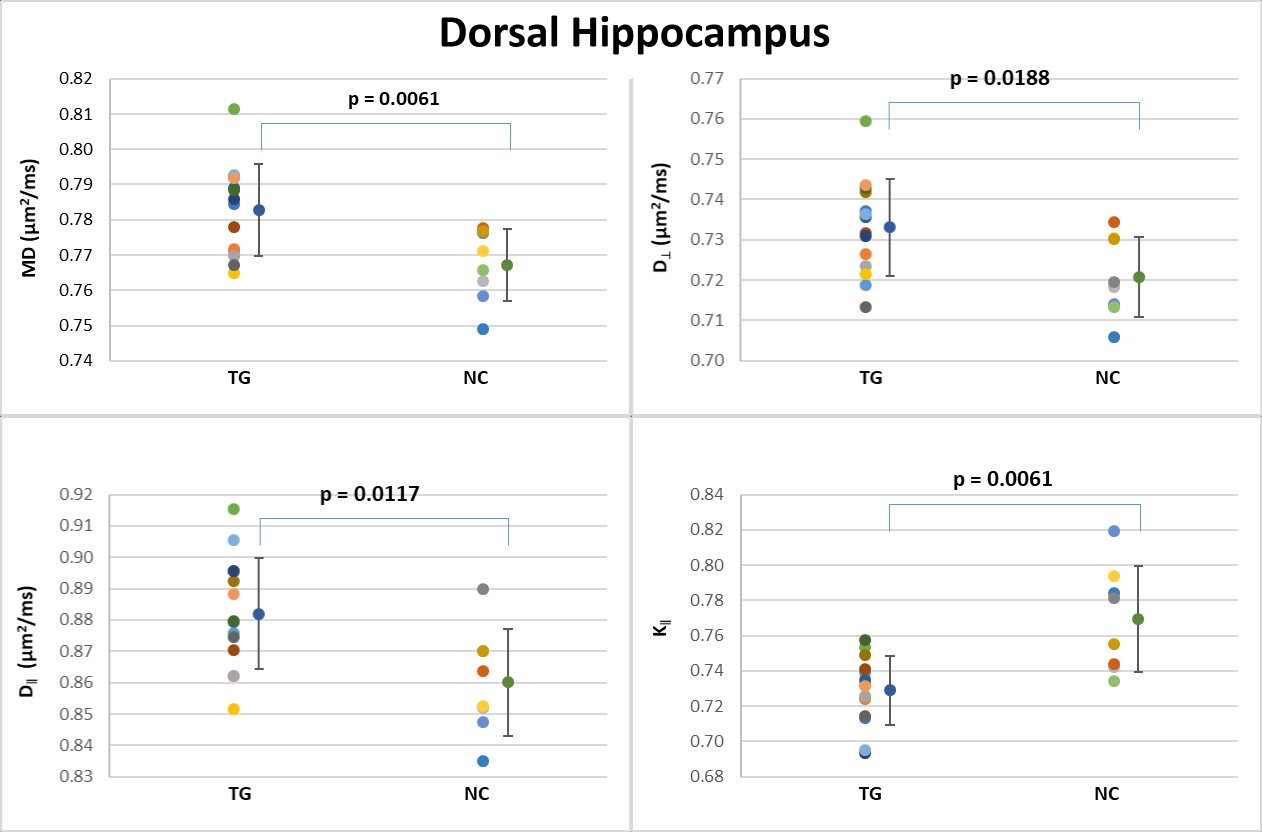
Figure 3: Scatter plots of the dMRI metrics statistically significant
between the two groups in the dorsal hippocampus.
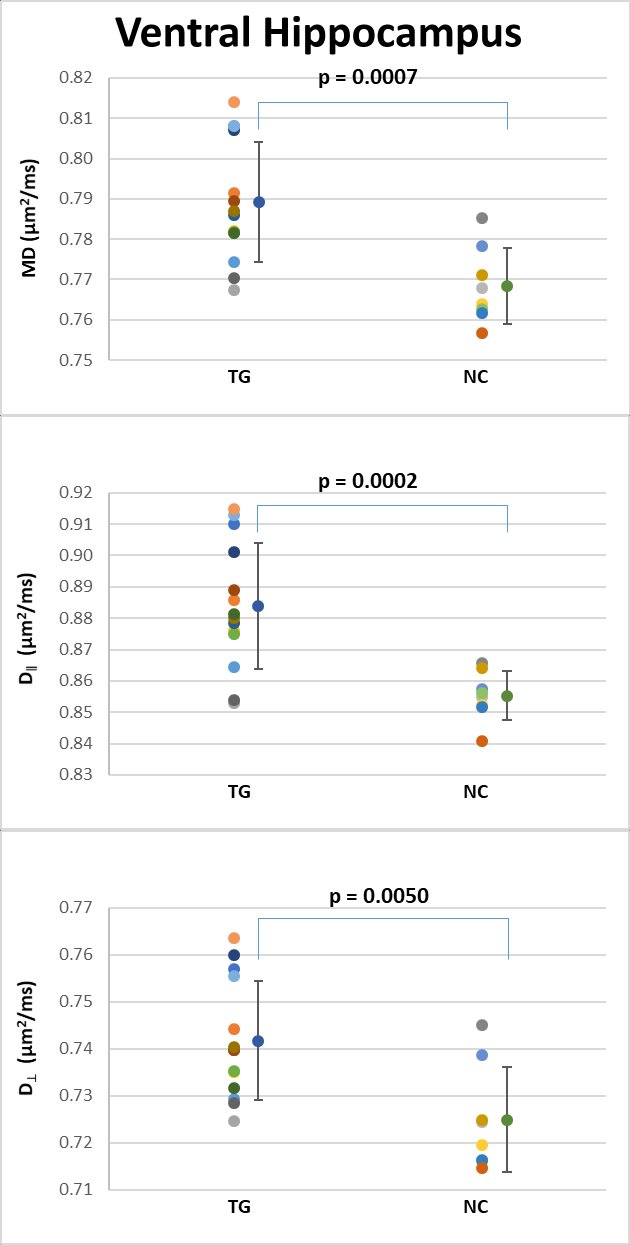
Figure 4: Scatter plots of the dMRI metrics statistically significant
between the two groups in the ventral hippocampus.
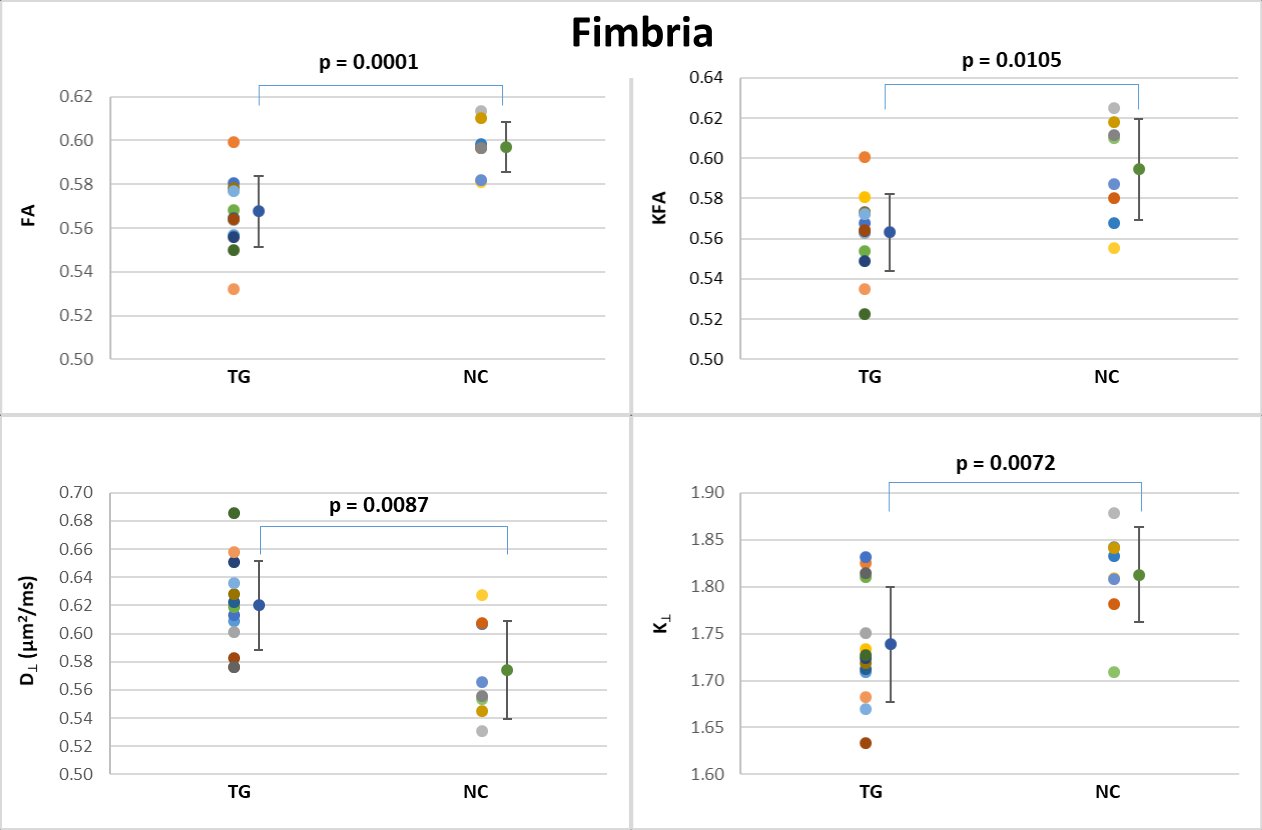
Figure 5: Scatter plots of the dMRI metrics statistically significant
between the two groups in the fimbria.
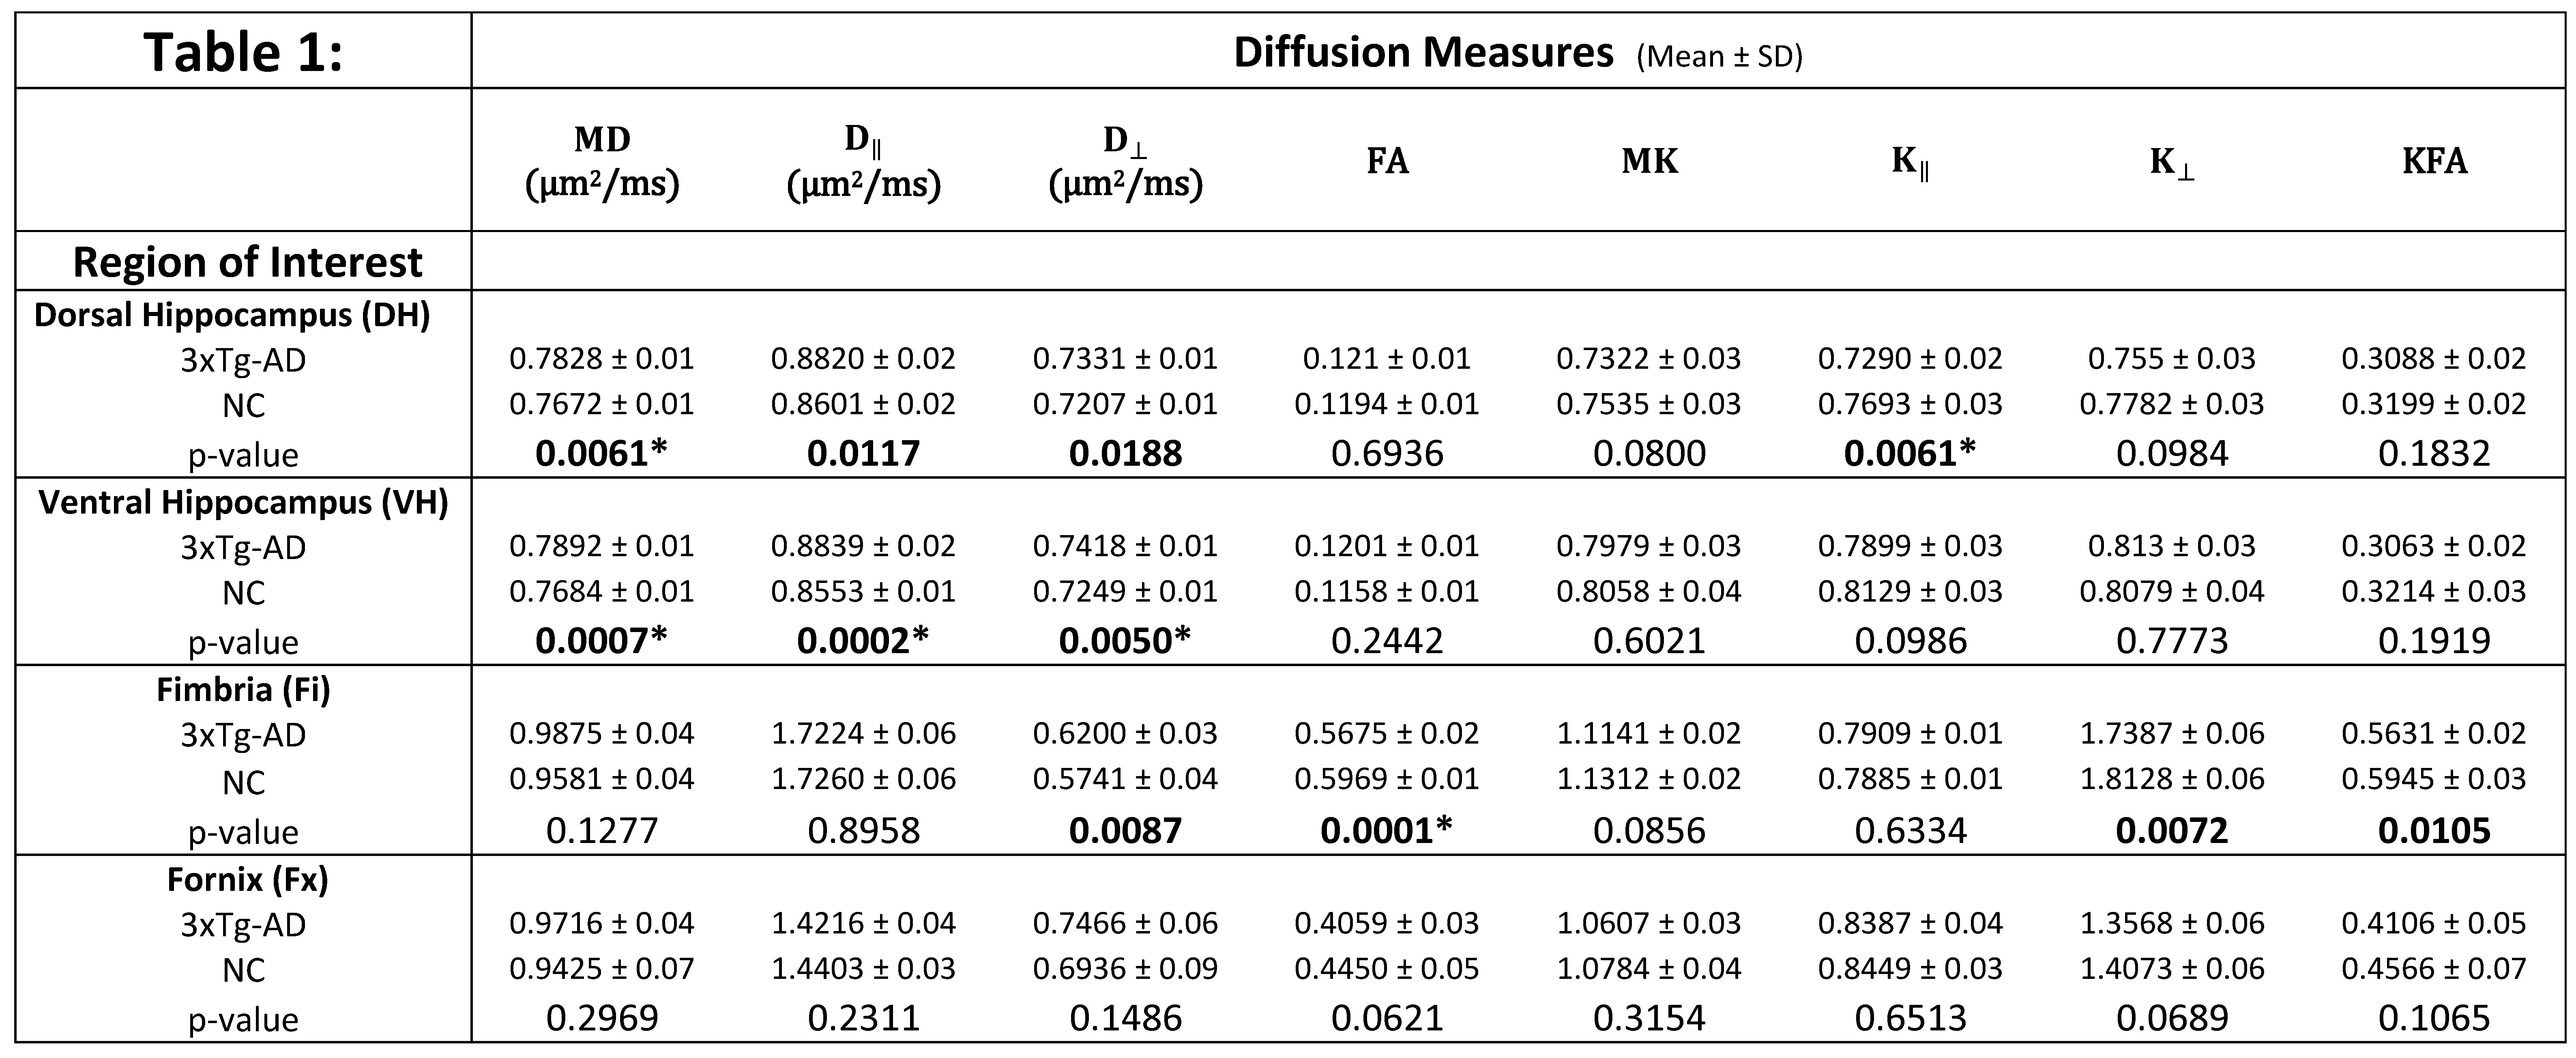
Table 1: Group
means, standard deviations and p-values for all the diffusion metrics in each
ROI. Bold text indicates a significant difference between the two groups (p <
0.05, uncorrected) and (*) indicates those values which survived Bonferroni correction for multiple comparisons (8 tests).