3417
Graph-based Structural Connectivity is correlated with Children Intelligence Quotient Scores1Université Claude Bernard-Lyon 1, lyon, France, 2American University of Beirut, Beirut, Lebanon, 3Hôpital Neurologique, Hospices Civils de Lyon, Bron, France, 4CERMEP - Imagerie du Vivant, Bron, France
Synopsis
The neural substrate of high intelligence performances remains not well understood. We propose to investigate the structural brain connectivity measurements and their relationship with the intelligence performances, as measured by the WISC-IV scores of 57 children. We found strong correlations between children brain network density and intelligence scores. Moreover, several correlations were found between integration and redundancy graph metrics suggesting that intelligence performances are probably related to homogeneous network organization.
Introduction
Intelligence performances, as measured by psychological tests, were shown to correlate with brain organization1. Allowing the analysis of brain micro-architecture, diffusion tensor imaging (DTI) may provide a sensitive approach to better understand the structural neural substrate of high intelligence. In this study, we propose to use constrained spherical deconvolution (CSD) based tractography to characterize the brain structural network of children with varying intelligence quotient (IQ).Materials and Methods
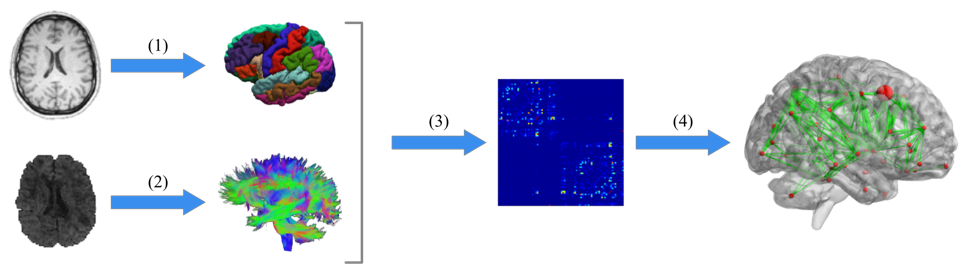
Fifty-seven children (14 girls, 43 boys, mean (± SD) age: 9.81 ± 1.16) were recruited in this study and underwent the Wechsler Intelligence Scale for Children IV (WISC-IV). Four subscales, including Verbal Comprehension Index (VCI), Working Memory Index (WMI), Perceptual Reasoning Index (PRI), and Processing Speed Index (PSI), were assessed to calculate the Full Scale Intelligence Quotient (FSIQ). MR examination was performed using a 1.5T Siemens Sonata system with an 8 channels head-coil. A T1-weighted MPR sequence was acquired in the sagittal plane with a spatial resolution of 1 x 1 x 1 mm (TE/TR = 3.93/1970 ms, FOV: 256 x 256 x 176 mm3). DTI data were acquired using a spin-echo EPI sequence with a nominal spatial resolution of 2.5 x 2.5 x 2.5 mm (TE/TR = 86/6900 ms, FOV: 240 x 240 x 51 mm3) and 24 gradient directions (b = 1000 s.mm-2). Data post-processing consisted first of eddy currents correction and brain extraction using FSL2. Second, anatomically constrained whole brain tractography was computed (500000 fibers) using MRtrix3. Streamline tractography was next coupled with 84 selected nodes obtained from the FreeSurfer segmentation in order to compute adjacency matrices, summing the number of streamline connecting each pair of nodes. A 25% threshold was applied to keep only the strongest connections of the adjacency matrices. Data processing pipeline is shown in Figure 1. Graph Density (D), Assortativity (r), Global Efficiency (Eg), Transitivity (T), Modularity (Q), and Characteristic Path Length (CPL) were then estimated using the Brain Connectivity Toolbox in MATLAB4. General linear model was fitted to every WISC-IV scores to test their dependence with the different global graph metrics, and age and gender as cofactor.Results
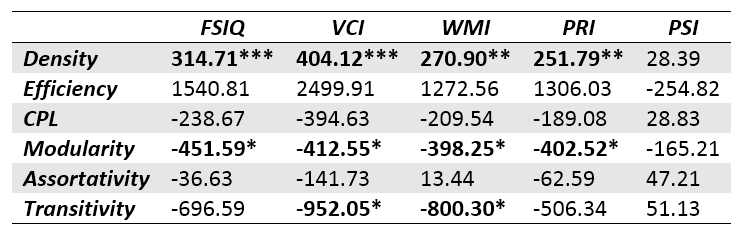
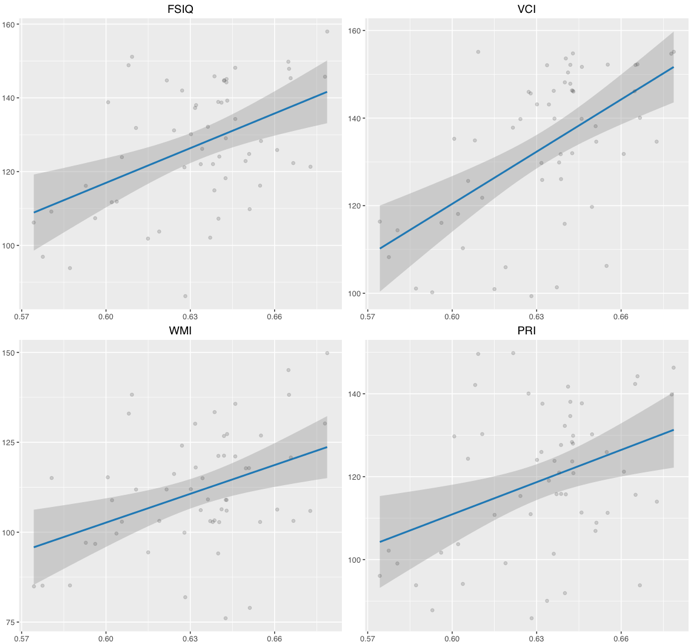
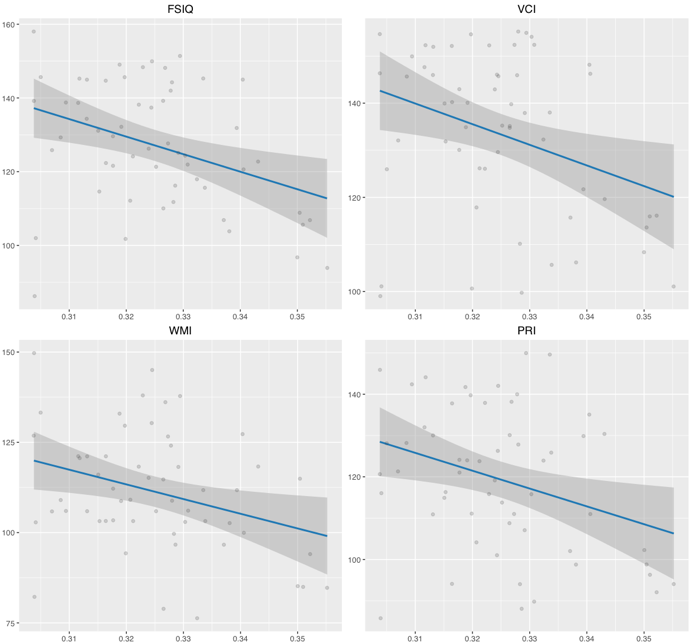
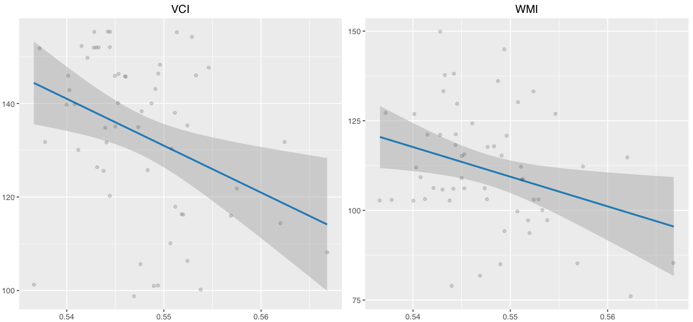
Significant correlations were found between density, modularity, and transitivity values with different WISC-IV scores (Table 1). More in details, a positive correlation was observed between density and FSIQ (p<0.001), VCI (p<0.001), WMI (p<0.01), and PRI (p<0.01). A negative correlation was observed between modularity and FSIQ, VCI, WMI and PRI (p<0.05), and between transitivity and VCI as well as WMI (p<0.05). These significant correlations are shown in Figures 2-4. No significant correlations were found between graphs’ metrics and PSI. Finally, none of these correlations are biased by gender or age effects.Discussion and Conclusion
This study showed significant correlations between different graph metrics based on diffusion measures and psychometric scores. First, the increase of network degree with intelligence scores, confirmed that fiber bundles density of brain networks play a significant role in intelligence capacities. Second, considering that modularity represents a measure of segregation levels between graph modules, and that transitivity reflects the redundancy in the network connections, the low modularity and low transitivity observed in high IQ children confirmed that homogeneous brain organization correlates with intelligence. These findings may show that high IQ may be related to a high fiber density and optimally distributed brain network, thanks to the global sensitivity of such graph-based methods for the investigation of brain topological organization.Acknowledgements
This work was made possible by APICIL Foundation financial support.References
1. Haier RJ, Jung RE, Yeo RA, Head K, Alkire MT. Structural brain variation and general intelligence. Neuroimage 2004;23:425–33.
2. Jenkinson M, Beckmann CF, Behrens TEJ, Woolrich MW, Smith SM. Fsl. Neuroimage 2012;62:782–90.
3. Tournier JD, Calamante F, Connelly A. MRtrix: Diffusion tractography in crossing fiber regions. Int J Imaging Syst Technol 2012;22:53–66.
4. Rubinov M, Sporns O. Complex network measures of brain connectivity: Uses and interpretations. Neuroimage 2010;52:1059–69.
Figures