3407
Validation of an image-based measurement of gradient non-linearity method and voxel-wise correction of b-values in a HARDI dataset1Laboratory for Social and Neural Systems Research, University of Zürich, Zürich, Switzerland, 2Institute for Biomedical Engineering, ETH Zürich, Zürich, Switzerland, 3Brain Imaging Centre, Research Centre for Natural Sciences, Hungarian Academy of Sciences, Budapest, Hungary, 4Department of Nuclear Techniques, Budapest University of Technology and Economics, Budapest, Hungary, 5Brain Imaging Centre, Goethe University Frankfurt, Frankfurt, Germany, 6Department of Neurophysics, Max Planck Institute for Human Cognitive and Brain Sciences, Leipzig, Germany, 7Wellcome Centre for Human Neuroimaging, UCL Queen Square Institute of Neurology, London, United Kingdom
Synopsis
Diffusion MRI requires numerous corrective steps in the data processing pipeline. One such step regards the need for voxel-wise correction of erroneous b-values that ensue from the inherent non-linearity of the magnetic field gradients. To estimate the non-linearity we used a simple image-based method that involves a spherical water phantom to measure voxel-wise the apparent diffusion constant. Deviations from the expected value allow estimation of the local b-value. The b-value maps were validated against the spherical harmonic predictions and subsequently used to correct phantom and in-vivo data.
Introduction
To perform cutting edge diffusion MR imaging studies, a large number of acquisition optimization1,2 and correction steps3-5 are applied to the high angular resolution diffusion imaging (HARDI) data. In particular, the inherent non-linearity of the magnetic field gradients will result in a spatial variability of the nominal b-value. Correction methods have been put forth that either model the cause of the deviations6 or rely on intimate knowledge of the gradient design7. The aim of the present work was to validate a simple, image-based measurement of the gradient non-linearity and the corresponding voxel-wise correction of the erroneous b-value.Methods
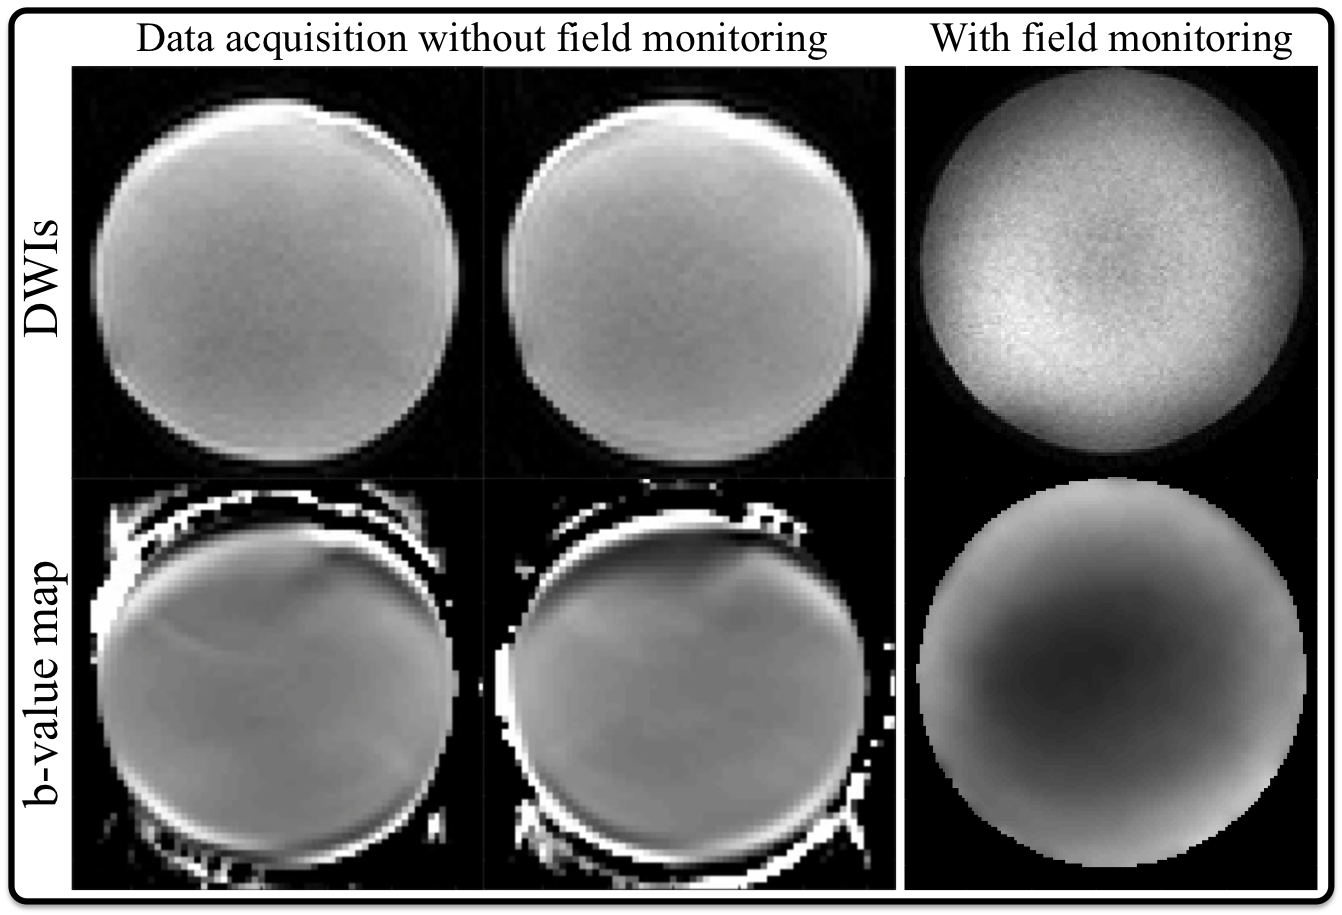
The method is based on previous work8 using a spherical water phantom to measure the spatial deviation from the expected diffusion constant on a 3T Philips Achieva scanner. Briefly, ten HARDI data sets were acquired with 64 diffusion directions (b=500 s/mm2) and 2 reference images (b=0 s/mm2) at 1.7 mm isotropic resolution. The acquisition implemented concurrent magnetic field monitoring9-11 to minimize artifacts from eddy currents, Bo field inhomogeneity and EPI ghosts (Fig1). Apparent diffusion coefficient (ADC) maps were calculated for each of the 64 diffusion-weighted images (DWIs) in 9 of the 10 repetitions. Under the assumption that at the isocentre the actual magnetic field gradients correspond to their nominal values, the observed b-values were estimated voxel-wise as bobs = k2bnom, with k = sqrt(ADCobs / ADCnom), where ADCobs is the observed diffusion constant, bobs is estimated voxel-wise b-value and ADCnom and bnom are the respective true values at the isocentre where gradients are assumed to be correct. The b-value maps of the first nine acquisitions were averaged for better SNR and this average was used to calculate the corrected voxel-wise ADC in each of the 64 DWIs of the 10th data set. One healthy adult male volunteer was also scanned once with an identical HARDI sequence but with b=1000 s/mm2. Using FSL version 5.0.11 (FMRIB, Oxford, England), the bedpostX pipeline for fibre estimation was run using the default parameter settings, but using the two different b-value approaches: 1) Standard bedpostX using a nominal b-value for every voxel. 2) Modified voxel-wise bedpostX (implemented in MATLAB 2018a) using the unique b-value measurements for every voxel in the brain.Results
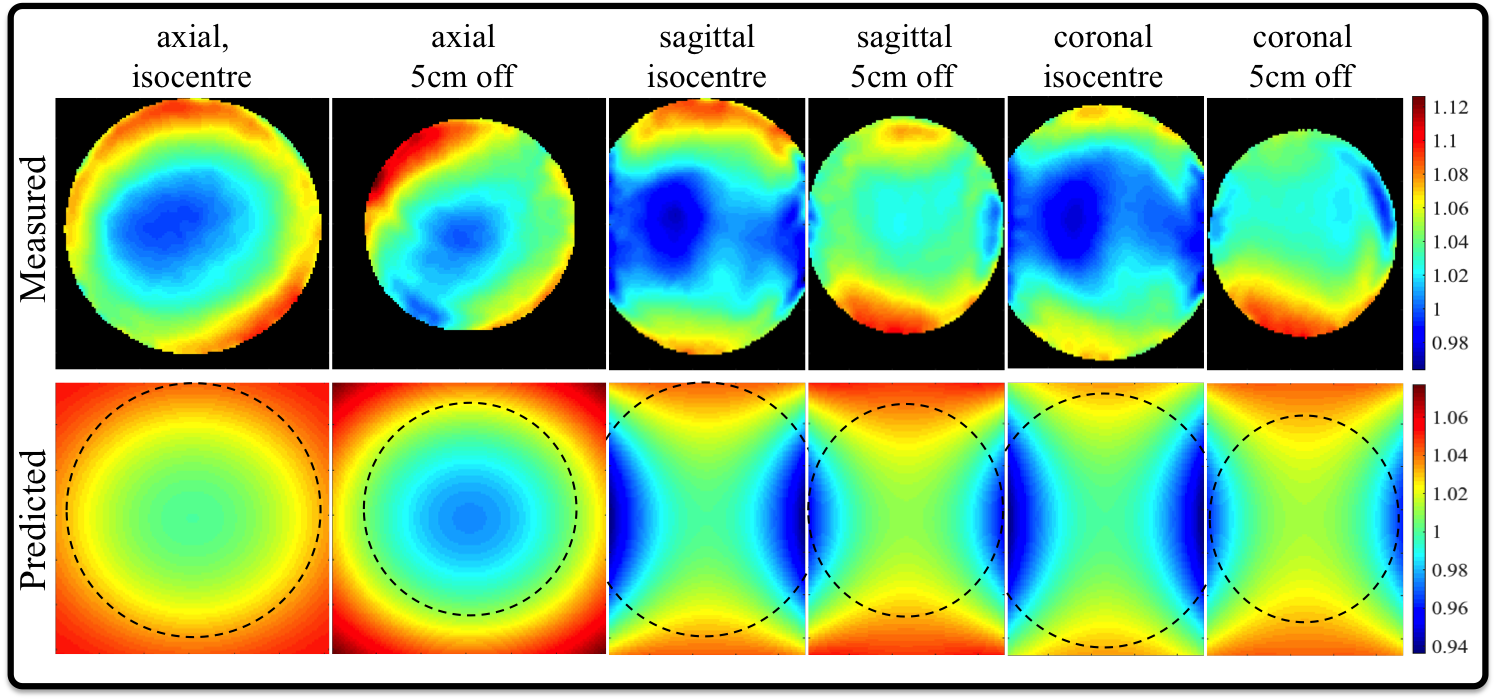
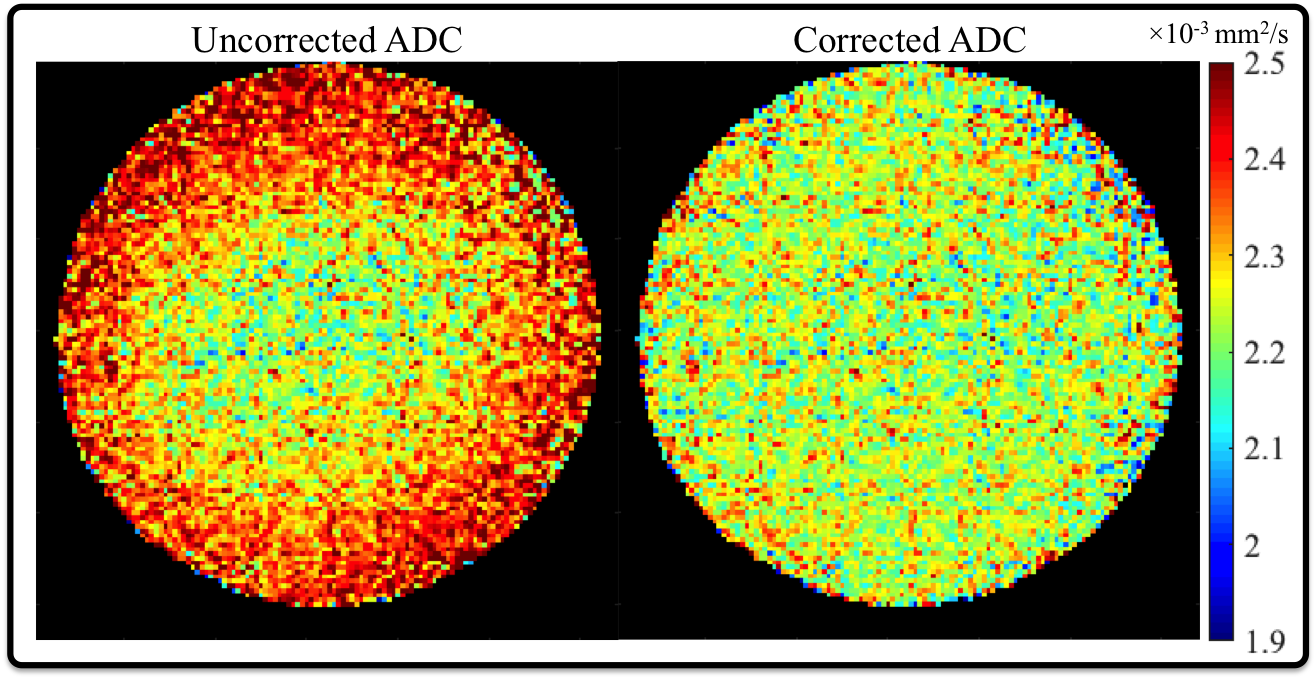
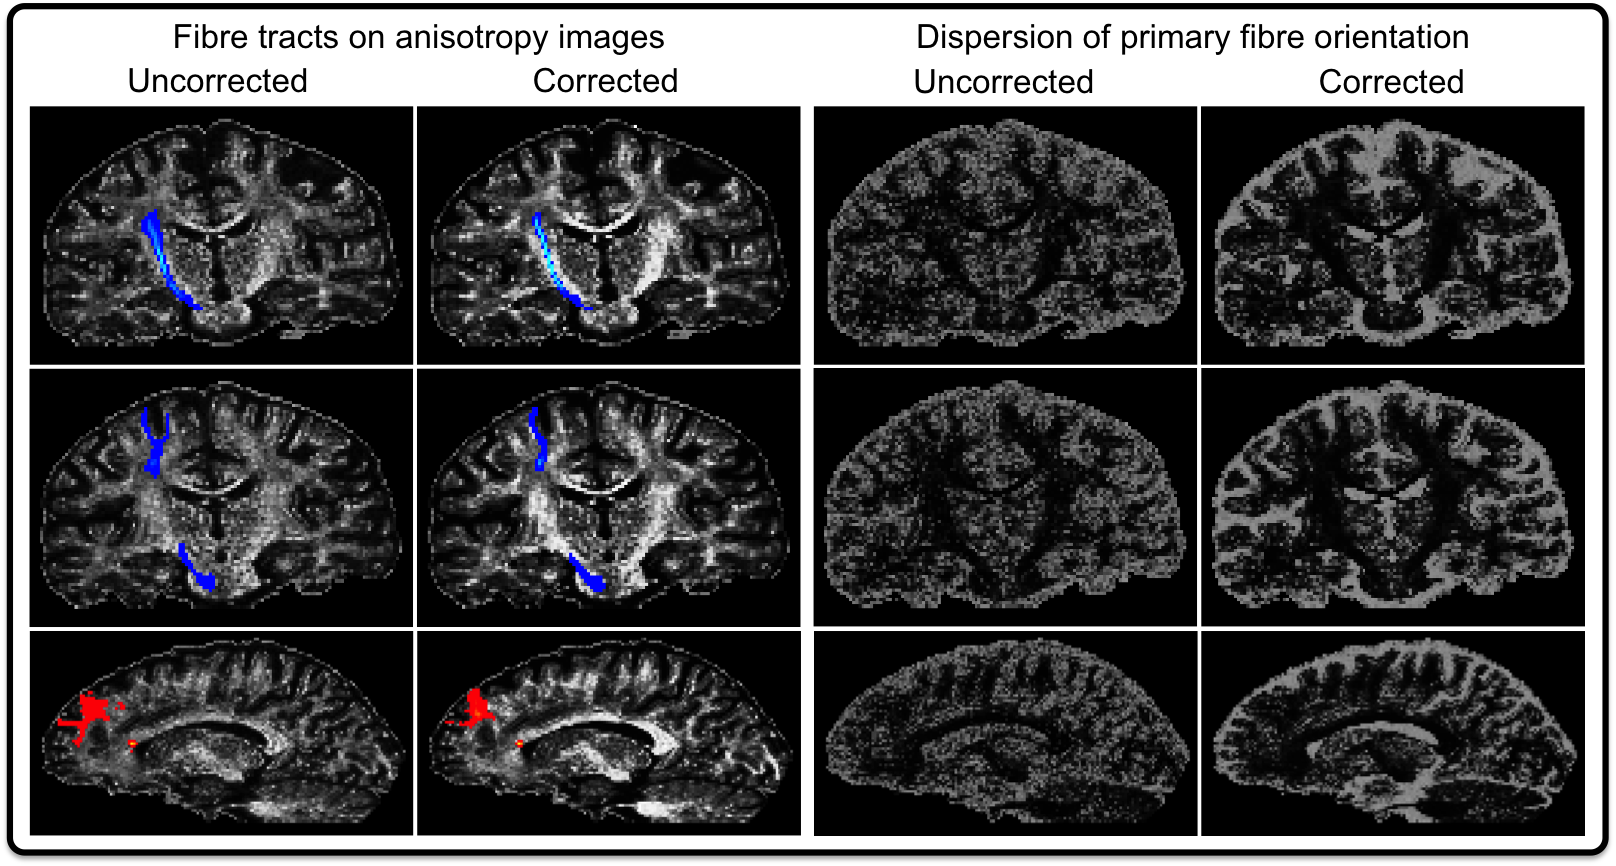
The high-quality 3D b-value maps (averaged over the 9 runs) showed a marked qualitative correspondence to the predicted maps, obtained via spherical harmonic prediction expansion – albeit the measured b-value deviations were larger (Fig2). The corrected ADC map – calculated voxel-wise from the 10th HARDI dataset and the measured b-value map – provided the expected spatial uniformity across the phantom (Fig3). The 1st and 2nd columns of Fig4 shows the probabilistic tractography results from a single seed voxel in either the posterior limb of the internal capsule (top and middle rows) or the anterior corpus callosum (bottom row). The b-value corrected data showed less noisy, more confined tracts. In the 3rd and 4th columns the corresponding dispersion images indicate that the data with corrected b-value results in lower uncertainty in the primary fibre orientation.Discussion
In this study the 3D spatial distribution of the actual b-value was calculated voxel-wise from high-quality HARDI data. Although the measurements indicated larger deviations from the nominal b-value than the spherical harmonic predictions (Fig2), the experimentally measured results were in line with previous measurements on a different scanner8 and also presented by independent investigators4. Furthermore, when the measured b-value maps were used to correct additional data, the resulting ADC map became spatially uniform as expected (Fig3). In-vivo confirmations are notoriously difficult because the underlying truth is not known. What we could confirm is that the two processing paths produce different results albeit reasonable results. The more confined fibre tracts of the b-value corrected data correspond to expectations that one would have from the observed lower uncertainty of the main fibre tracts. Future work will aim to investigate the discrepancy between the spherical harmonic prediction and the measured b-value maps to confirm whether this discrepancy is due to measurement error or the fact that the spherical harmonic predictions do not include secondary effects, such as the influence of the other imaging gradients, concomitant fields or eddy current effects (i.e. the first diffusion gradient effecting the second one, etc). Moreover, it is planned to devise additional outcome measures to ascertain that the changes in the in-vivo results represent significant improvements.Acknowledgements
Carrying out the work was supported by the Swiss National Science Foundation (grant# 31003A_166118 and 316030_164076). We are indebted to colleagues within Philips Healthcare (Best, The Netherlands) for sharing the spherical harmonic expansions of the expected gradient fields and their patient guidance in estimating the actual expected b-values.References
1. Reese TG, Heid O, Weisskoff RM, Wedeen VJ. Reduction of eddy-current-induced distortion in diffusion MRI using a twice-refocused spin echo. Magn Reson Med 2003;49(1):177-182.
2. Jones DK, Horsfield MA, Simmons A. Optimal strategies for measuring diffusion in anisotropic systems by magnetic resonance imaging. Magn Reson Med 1999;42(3):515-525.
3. Andersson JLR, Sotiropoulos SN. An integrated approach to correction for off-resonance effects and subject movement in diffusion MR imaging. Neuroimage 2016;125:1063-1078.
4. Sotiropoulos SN, Jbabdi S, Xu J, et al. Advances in diffusion MRI acquisition and processing in the Human Connectome Project. Neuroimage 2013;80:125-143.
5. Vos SB, Tax CM, Luijten PR, Ourselin S, Leemans A, Froeling M. The importance of correcting for signal drift in diffusion MRI. Magn Reson Med 2016;77:285-299.
6. Mohammadi S, Nagy Z, Möller HE, Symms MR, Carmichael DW, Josephs O, Weiskopf N. The effect of local perturbation fields on human DTI: Characterisation, measurement and correction. Neuroimage 2012;60(1):562-570.
7. Bammer R, Markl M, Barnett A, Acar B, Alley MT, Pelc NJ, Glover GH, Moseley ME. Analysis and generalized correction of the effect of spatial gradient field distortions in diffusion-weighted imaging. Magn Reson Med 2003;50(3):560-569.
8. Nagy Z, Alexander DC, Weiskopf N. Measuring and Correcting Errors That Occur in Diffusion Weighted Images Due to Non-Ideal Gradient Linearity. In: Proceedings of the 17th Annual Meeting of ISMRM, Honolulu, USA, Abstract #849.
9. Barmet C, De Zanche N, Pruessmann KP. Spatiotemporal magnetic field monitoring for MR. Magn Reson Med 2008;60(1):187-197.
10. Wilm BJ, Nagy Z, Barmet C, et al. Diffusion MRI with concurrent magnetic field monitoring. Magn Reson Med 2015;74(4):925-933.
11. Kennedy M, Lee Y, Nagy Z. An industrial design solution for integrating NMR magnetic field sensors into an MRI scanner. Magn Reson Med 2018;80(2):833-839.
Figures