3403
An independent phase-based measure for slice outlier rejection in diffusion MRI1Centre for the Developing Brain, School of Biomedical Engineering and Imaging Sciences, King's College London, London, United Kingdom, 2Biomedical Engineering Department, School of Biomedical Engineering and Imaging Sciences, King's College London, London, United Kingdom
Synopsis
Detecting and downweighting damaged slices is vital in analysing motion-corrupted dMRI data. Conventional magnitude-based outlier rejection methods rely on intensity model predictions, with the state of the art using slice-to-volume reconstruction. However, in cases with very high outlier prevalence such model prediction is no longer reliable. Here, we introduce a model-independent phase-based measure for detecting motion-induced slice dropouts. We demonstrate its use in neonatal data, and show that it outperforms model-based magnitude techniques in highly damaged data.
Introduction
Diffusion MRI (dMRI) can probe tissue microstructure in vivo using pulsed gradient encoding that sensitizes the signal to water self-diffusion. In standard EPI-based dMRI sequences subject motion, particularly during the diffusion preparation, can cause signal dropouts at the slice or multiband excitation level 1. Detecting these slice dropouts as outliers and downweighting or rejecting them in slice-to-volume reconstruction and/or local modelling can substantially improve the quality of subsequent dMRI analysis 2.
Outlier rejection strategies typically compare the measured signal magnitude to an intensity model prediction. However, when there is a high incidence of corrupted slices the fitted model may become less reliable and in low SNR regimes, detecting a significant signal difference from a model prediction can be less effective. Here, we introduce a model-independent outlier measure derived from the phase images of the EPI slice, and demonstrate its use in neonatal dMRI data.
Materials and Methods
Data: Neonatal dMRI data of the Developing Human Connectome Project were acquired on a Philips 3T Achieva system with a 32-channel neonatal head coil 3; resolution 1.5x1.5x3mm with 1.5mm slice overlap; MB=4; SENSE=1.2; b=0(20), 400(64), 1000(88), 2600(128) s/mm2. Data were preprocessed with image denoising 4 and Gibbs ringing correction 5, and a B0 field map was estimated using FSL Topup 6.
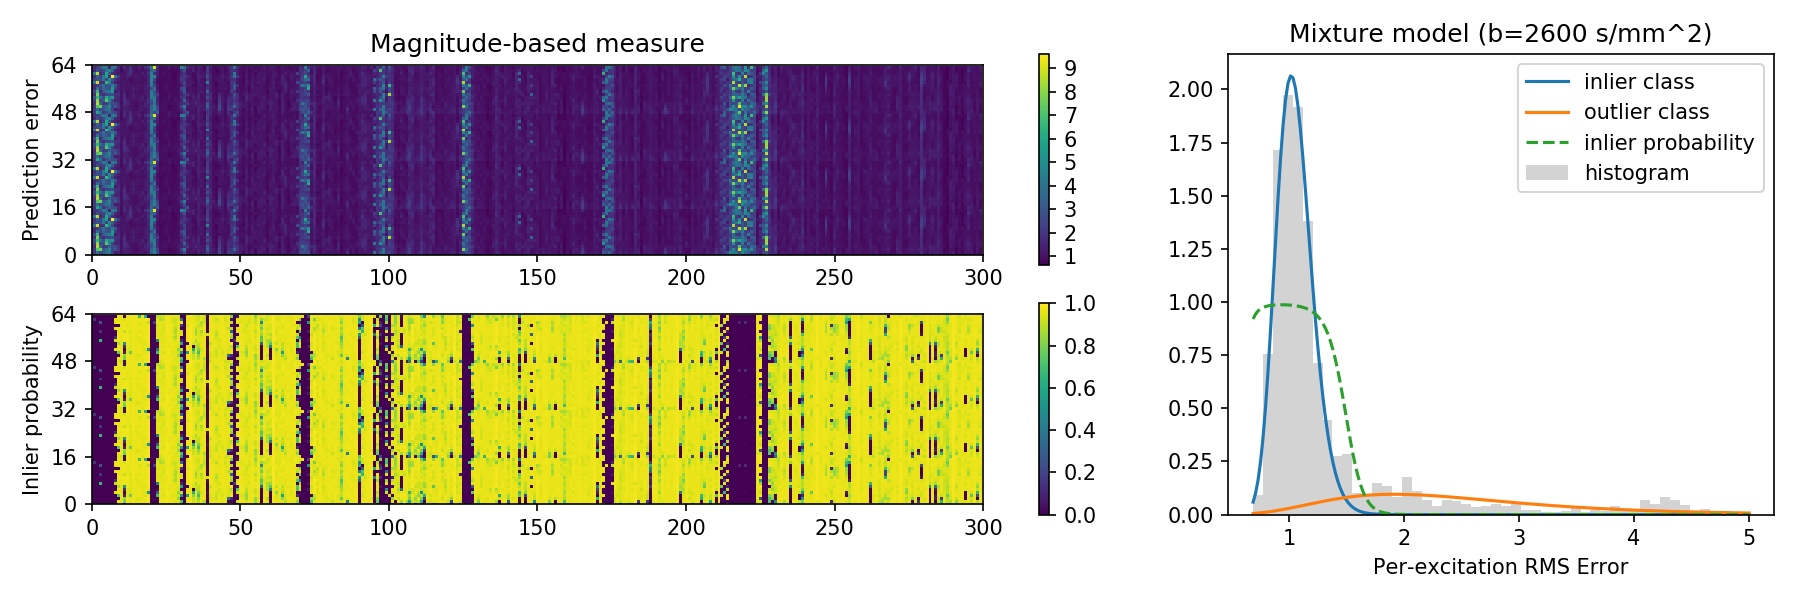
Magnitude-based measure: Magnitude-based outlier rejection requires an intensity model prediction, provided in this case by a slice-to-volume reconstruction (SVR) framework 7. In SVR, a motion-free signal representation and rigid motion parameters for each slice are jointly optimized in the reconstruction.
In this process, a signal prediction for each slice is compared to the measured intensity using the root-mean-squared error. Per-excitation outlier probabilities are then derived in a 2-class mixture model of log-normal distributions, evaluated per b-value shell (Fig.1). Note that these probabilities need to be updated in each iteration of the SVR process.
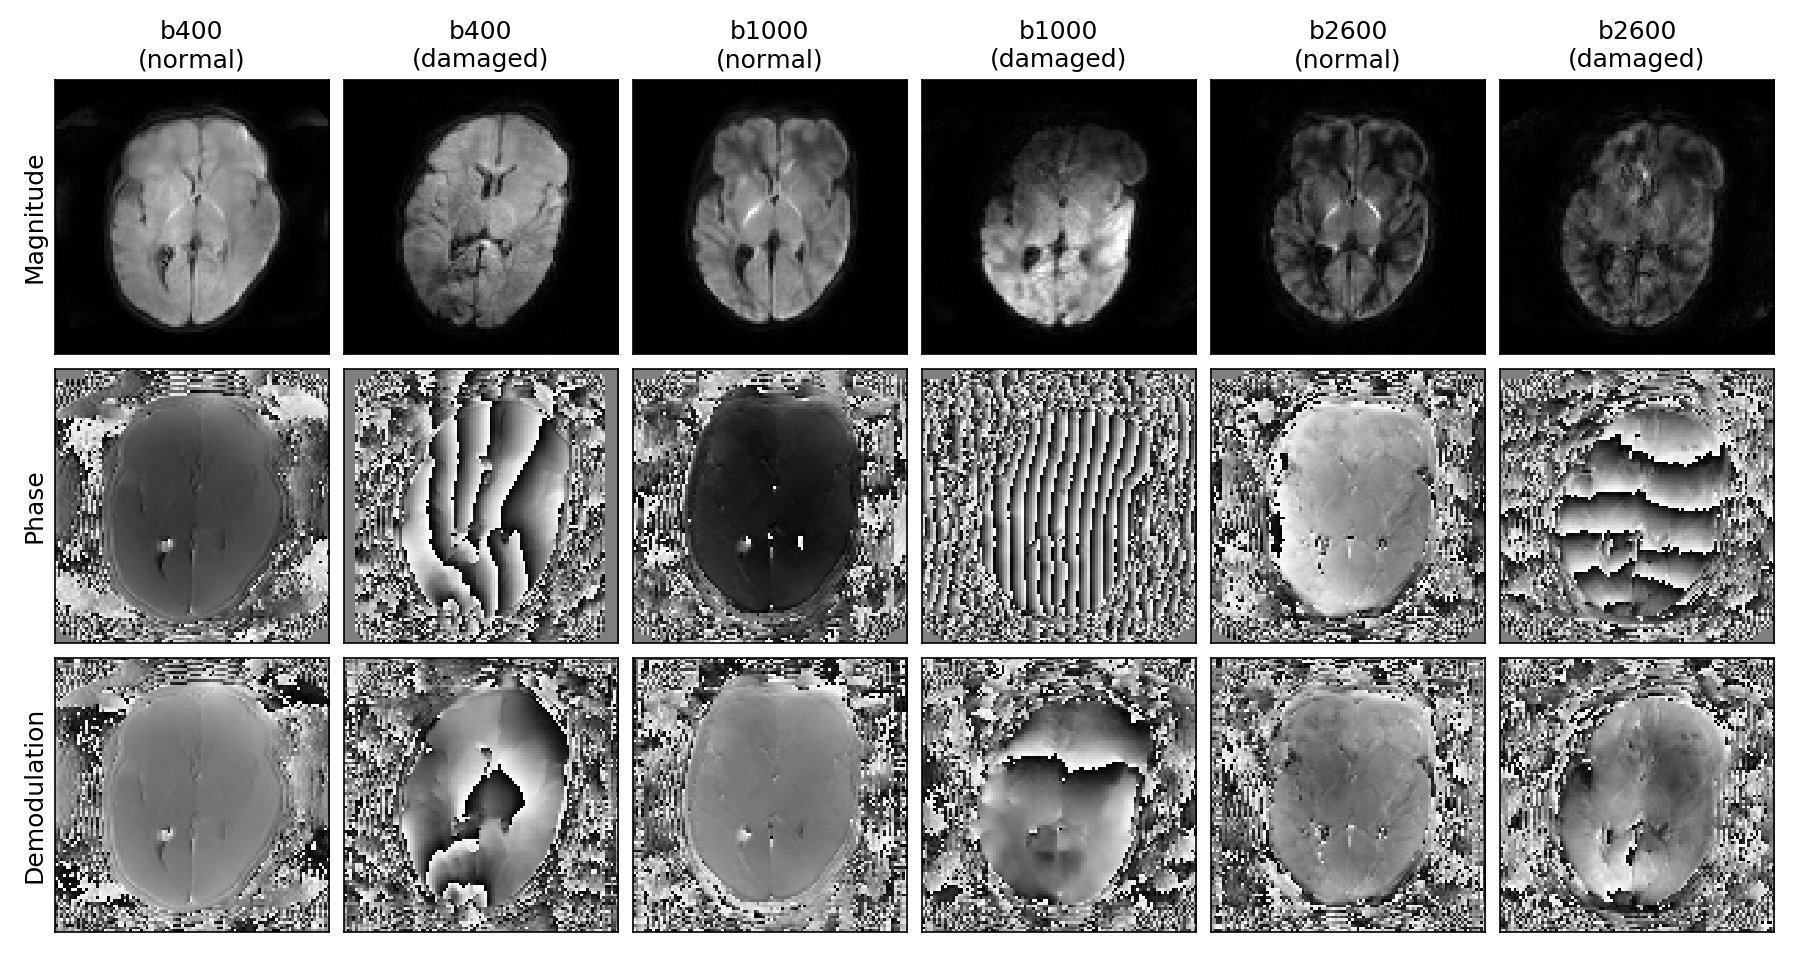
Phase-based measure: Subject motion leaves an imprint on the phase of diffusion-weighted images in each slice or multiband excitation: translation induces a phase offset and rotation induces a linear phase ramp (Fig.2). This leads to the following relation between the uncorrupted k-space signal $$$S(k_x,k_y)$$$ and the measured spectrum $$$S'(k_x,k_y)$$$ in each slice: $$S'(k_x,k_y) = e^{d\phi} S(k_x + dk_x, k_y + dk_y)\quad,$$ where $$$d\mathbf{k}$$$ is a shift in k-space (linear phase ramp) about the diffusion gradient and $$$d\phi$$$ is the phase offset 8. $$$d\mathbf{k}$$$ and $$$d\phi$$$ are proportional to the respective rotation and translation, and also to the diffusion gradient strength $$$\|\mathbf{G}\| \propto \sqrt{b}$$$.
The linear phase component in each slice can hence provide an independent measure of motion. Here, we measure the linear phase by detecting the peak of the power spectrum. We heuristically define the inlier probability as a Gaussian PDF of the offset $$$\|d\mathbf{k}\|$$$, scaled by the b-value: $$P_i = \mathcal{N}(\|d\mathbf{k}\|; 0, b\,\sigma^2)\quad,$$ where the scale $$$\sigma$$$ is a tunable constant, here set to 0.05. We can then downweight or reject slices with low inlier probability.
Combined measure: We also combine both by using the phase-based outlier probability as prior for the magnitude-based method. Upon each SVR iteration, the updated magnitude-based inlier probability is multiplied with the fixed phase-based inlier probability.
Results
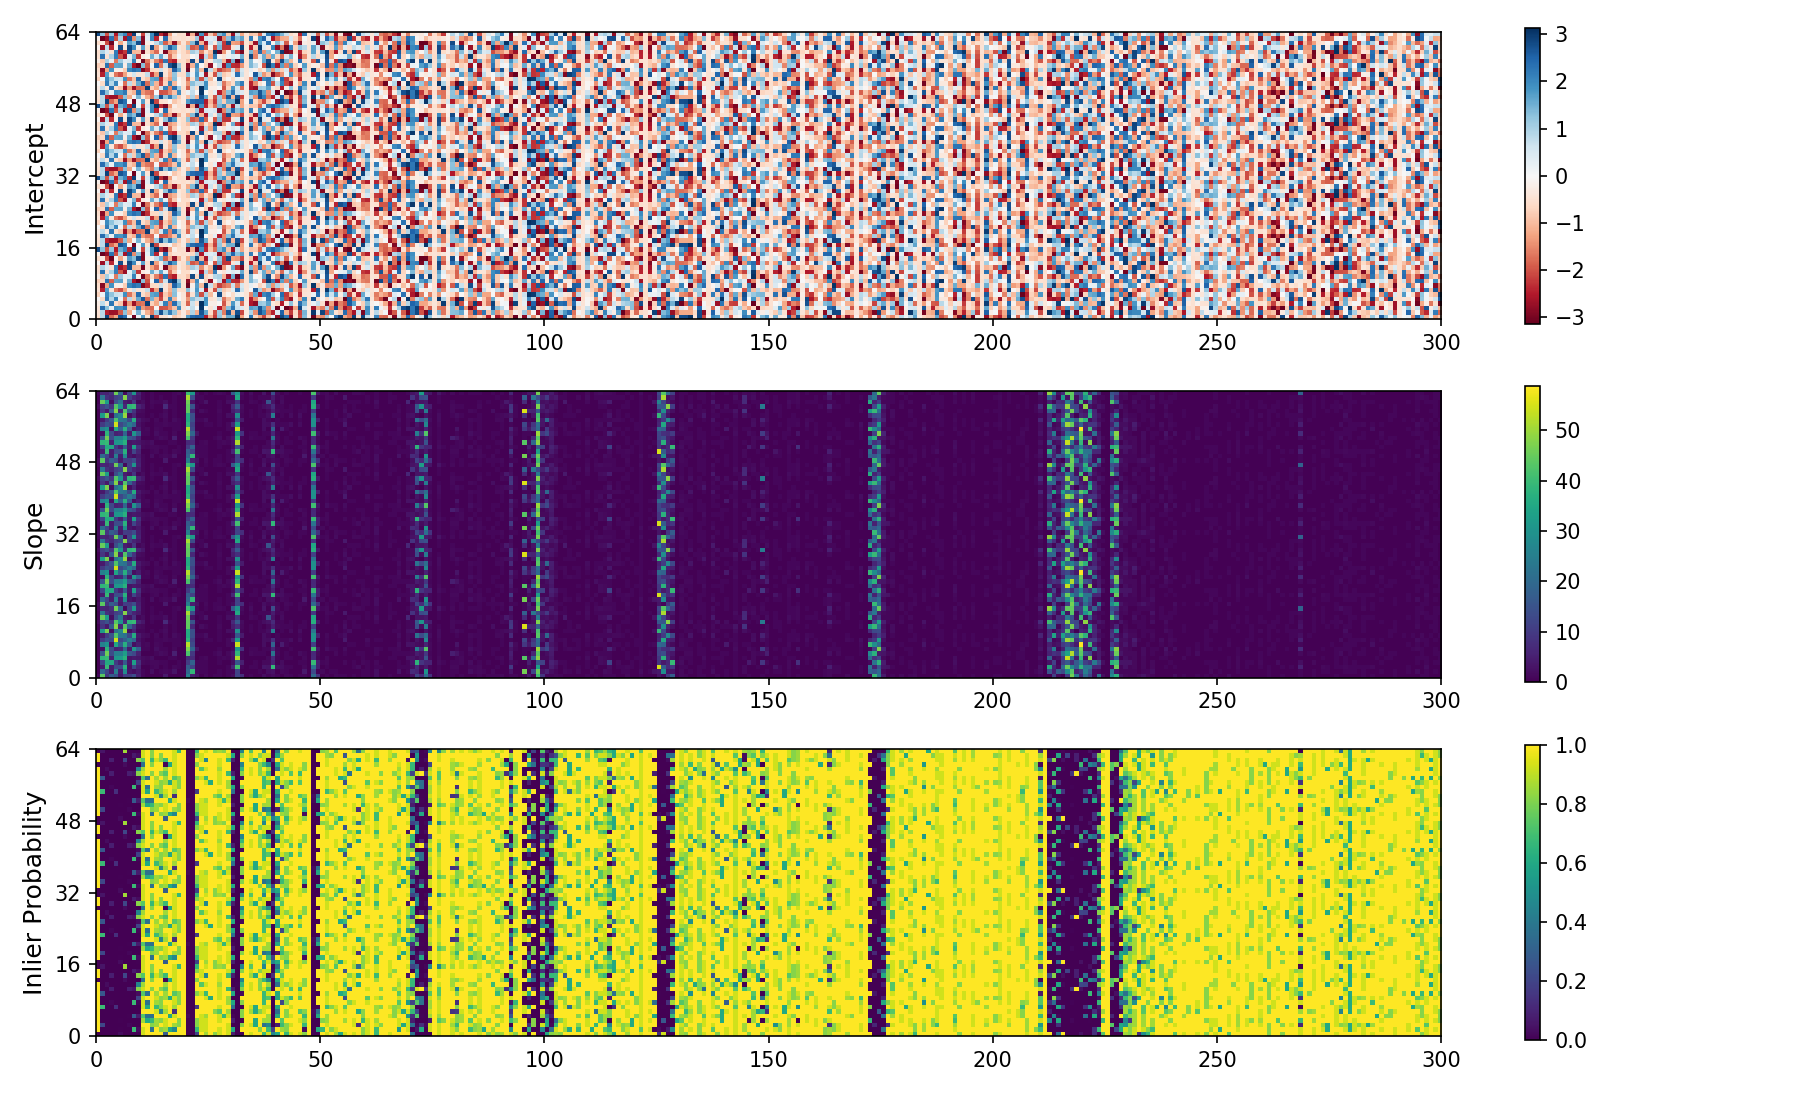
Fig.3 shows the detected phase at the peak of the power spectrum (intercept) and the distance of the peak location to the k-space centre (slope). We observe that while the intercept provides little usable information, the slope shows a clear pattern that coincides with subject motion and with the magnitude-based outlier detection (Fig.1).
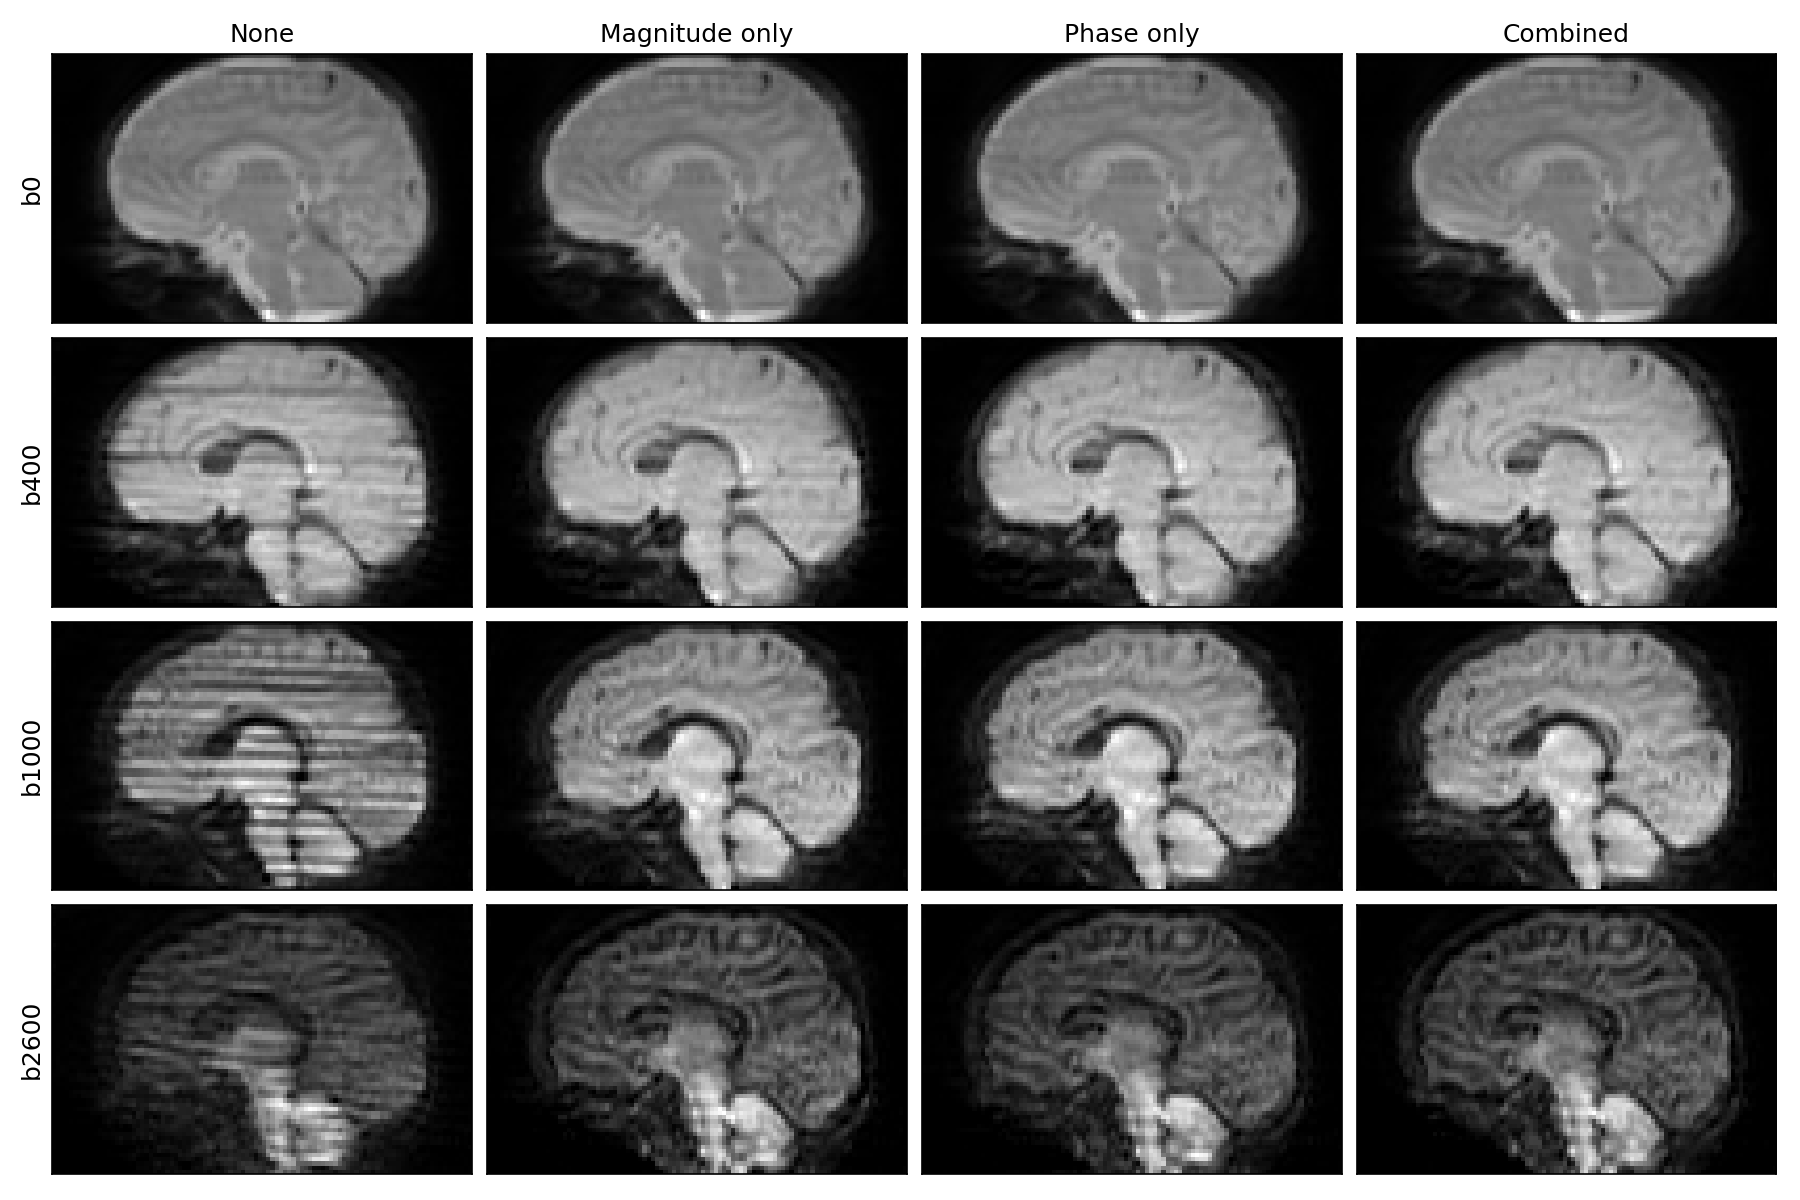
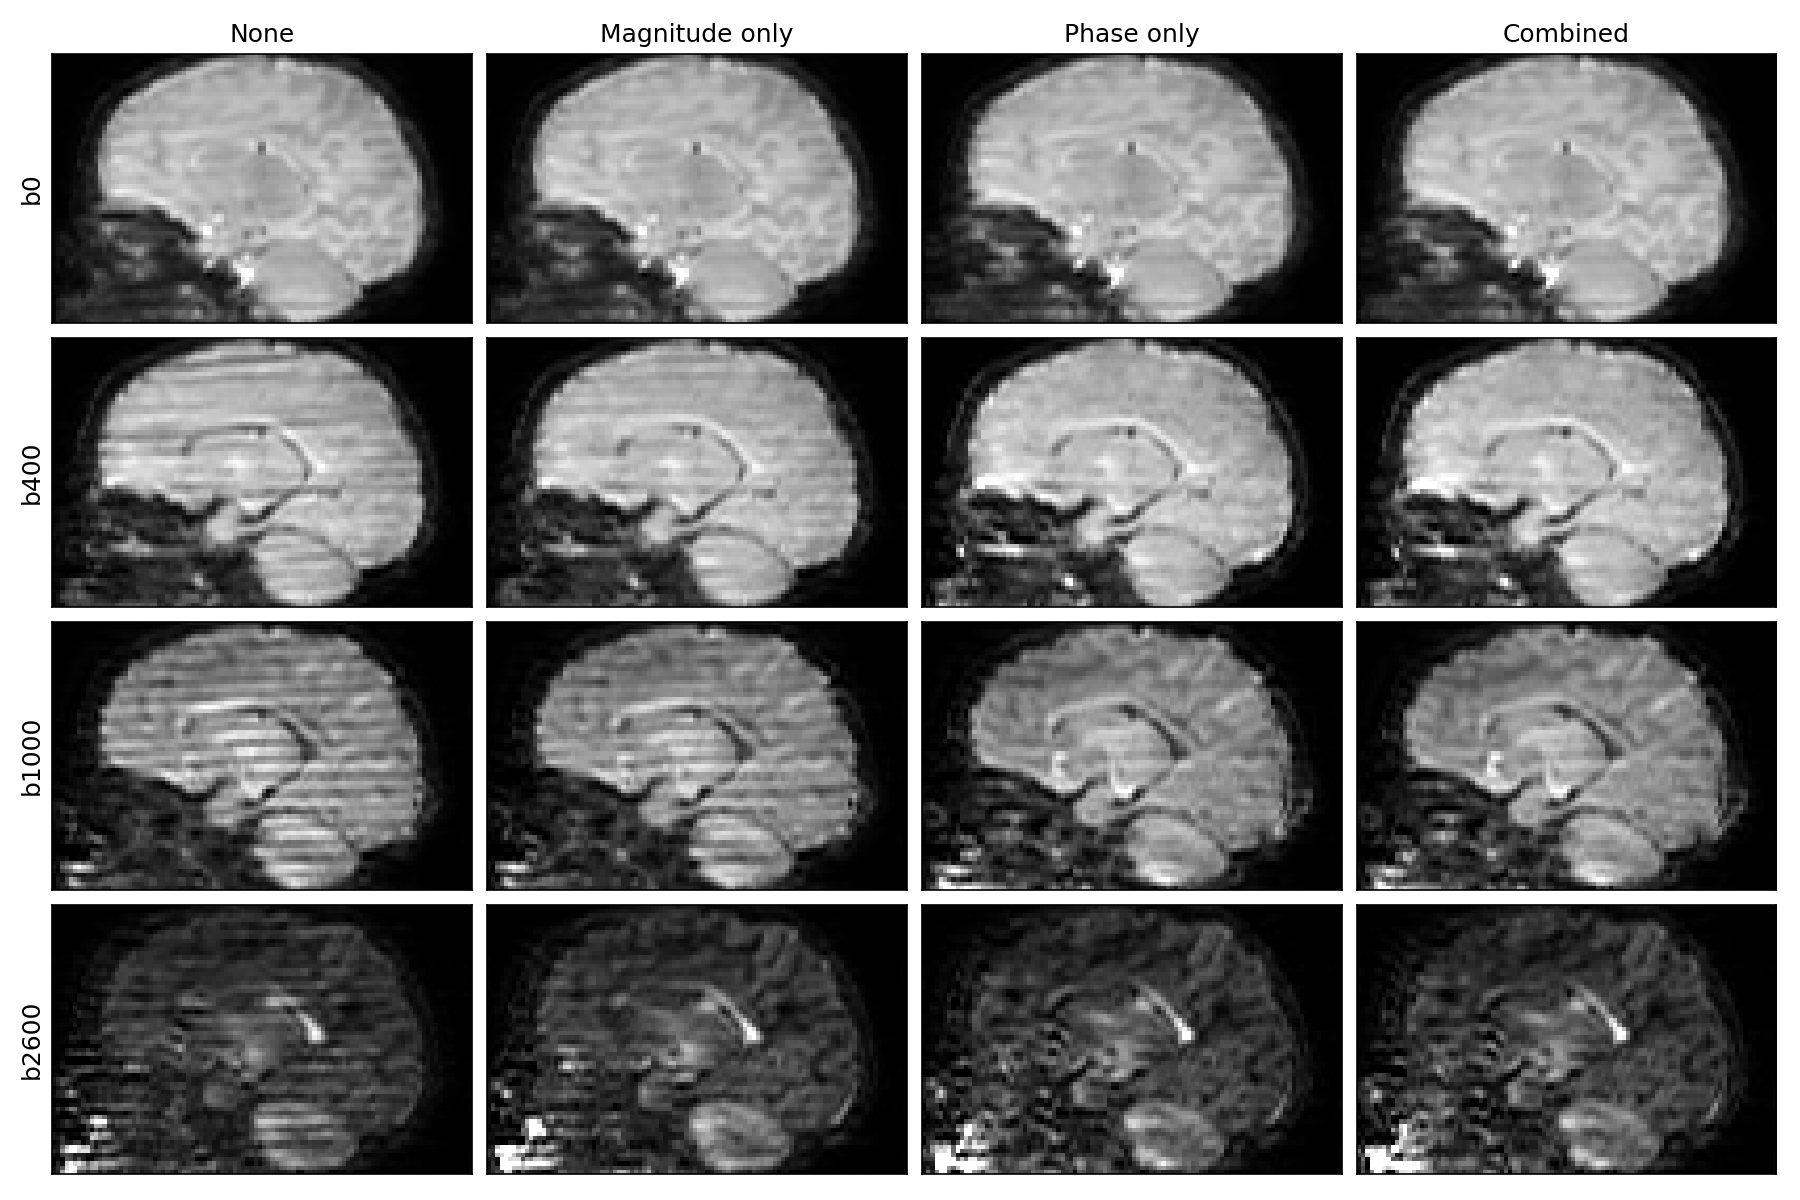
Figures 4 and 5 show the effect of the different strategies on SVR when using the slice inlier probability for weighted least-squares reconstruction. The left column shows the need for outlier rejection in the selected volumes. The other columns show the SVR result with the reference magnitude-based outlier rejection method, the independent phase-based measure, and the combined method. In the large majority of subjects, as exemplified in Fig.4, all measures deliver good, on par results. However, in extreme cases (Fig.5), the phase-based and combined measures can recover highly outlier-corrupted data where magnitude-based methods fail.
Discussion and Conclusion
While conventional magnitude-based methods require iterative signal predictions to model the confounding effects of motion, the proposed phase-based technique offers a model-independent measure that can be computed upfront, and that produces on par or even better results in highly corrupted data. We anticipate that this phase-based method can also be beneficial in low-SNR regimes where magnitude-based methods can struggle to discriminate contrast close to the noise floor. Future work may explore higher-order spectral features to also detect localised effects of physiological noise, flow, or pulsation.Acknowledgements
This work was supported by ERC grant agreement no. 319456 (dHCP project), the Wellcome EPSRC Centre for Medical Engineering at King’s College London [WT 203148/Z/16/Z] and by the National Institute for Health Research (NIHR) Biomedical Research Centre based at Guy’s and St Thomas’ NHS Foundation Trust and King’s College London. The views expressed are those of the authors and not necessarily those of the NHS, the NIHR or the Department of Health.References
- Jones DK, Cercignani M. Twenty‐five pitfalls in the analysis of diffusion MRI data. Magn Reson Med 2010; 23(7):803-820.
- Andersson JRL, Graham, MS, Zsoldos E, Sotiropoulos SN. Incorporating outlier detection and replacement into a non-parametric framework for movement and distortion correction of diffusion MR images. NeuroImage 2016; 141:556-572.
- Hutter J, Tournier J-D, Price AN, Cordero-Grande L, Hughes EJ, Malik S, Steinweg J, Bastiani M, Sotiropoulos SN, Jbabdi S, Andersson J, Edwards AD, Hajnal JV. Time-efficient and flexible design of optimized multi-shell HARDI diffusion. MRM 2017; 79(3):1276-1292.
- Veraart J, Novikov DS, Christiaens D, Ades-Aron B, Sijbers J, Fieremans E. Denoising of diffusion MRI using random matrix theory. NeuroImage 2016; 142:394-406.
- Kellner E, Dhital B, Kiselev V, Reisert M. Gibbs-ringing artifact removal based on local subvoxel-shifts. MRM 2016; 76(5):1574-1581.
- Andersson JLR, Skare S, and Ashburner J. How to correct susceptibility distortions in spin-echo echo-planar images: application to diffusion tensor imaging. Neuroimage 2003; 20(2):870-888.
- Christiaens D, Cordero-Grande L, Pietsch M, Hutter J, Edwards AD, Deprez M, Hajnal JV, Tournier J-D. Multi-shell SHARD reconstruction from scattered slice diffusion MRI data in the neonatal brain. ISMRM 2018; 26:O464.
- Anderson AW, Gore JC. Analysis and Correction of Motion Artifacts in Diffusion Weighted Imaging. MRM 1994; 32:379-387.
Figures