3400
Gradient nonlinearity-induced bias calibration and correction in diffusion imaging using DIADEM and a simple, uniform gel phantom1Department of Radiology, Mayo Clinic, Rochester, MN, United States, 2GE Global Research, Niksayuna, NY, United States
Synopsis
This study reports a novel gradient nonlinearity (GNL) calibration approach using DIADEM (Distortion-free Imaging Approach with a Double Encoding Method) diffusion imaging. Unlike standard diffusion-weighted echo-planar-imaging (DW-EPI), DIADEM is free from DW-EPI distortions. This allows GNL calibration with a uniform phantom, since confounding effects between DW-EPI and GNL-induced distortions in the calibration are separated. Direct bias correction could be applied to the corresponding in-vivo data from the DIADEM scans, which results in reliable quantitative diffusion imaging. The feasibility was successfully demonstrated in phantom and in-vivo on a compact 3T system.
Introduction
Gradient-nonlinearity (GNL) induces not only geometric distortion in MR imaging, but also spatially‐dependent intensity bias in gradient-encoded signals, including quantitative diffusion values such as fractional anisotropy (FA) and apparent diffusion coefficient (ADC)1,2. Today, most vendor’s image reconstruction pipelines only correct for GNL-induced geometric distortions (e.g., GE’s “gradwarp” tools), but not the signal-level bias. In addition to GNL, conventional diffusion-weighted echo-planar-imaging (DW-EPI) is also sensitive to susceptibility and eddy-current effects, which cause confounding distortion effects if not corrected during reconstruction and ultimately poor reproducibility in quantitative diffusion imaging. Recently, a novel multi-shot EPI, termed DIADEM (Distortion-free Imaging Approach with a Double Encoding Method)3, was suggested for high-resolution diffusion imaging. Although this approach is robust against most DW-EPI distortion sources, it is still affected by the GNL-induced image bias. To address the issue, in this work, a new DIADEM-based calibration approach that directly measures the GNL-bias using an isotropic diffusion phantom is proposed. The simplicity of a uniform phantom may offer advantages over those with complex internal structures4-6. Feasibility was investigated with phantom and in-vivo studies on the compact 3T system, which exhibits complex nonlinearity effects due to the asymmetry of its gradient system and reduced diameter of spherical volume7. The results were compared against a previously-described correction scheme1,2.Theory and Methods
Presuming sufficiently high SNR, the applied b-value in a diffusion scan can be estimated as8:
b=ln(S0/Sb)/D, (1)
where D, S0, and, Sb are the diffusion coefficient, the non-diffusion-weighted (DW) image, and the DW image, respectively. In an isotropic diffusion phantom filled with water or agar (to minimize bulk motion), the diffusion coefficient, D, is assumed to be spatially and directionally invariant. When the diffusion coefficient is known, the bias map, C, for any applied DW gradient can be simply calculated by9:
C=|b|/|b0|=sqrt(tr(b2)) /|b0|, (2)
where b0 is the ideal b-value requested for the imaging. Rather than the correction during the diffusion-tensor-imaging (DTI) scalar calculation, intensity correction of individual DW image allows to use existing diffusion analysis tools without any modification and can be is achieved by10:
Sb,corr=S0exp((C-1)/C)×Sbexp(1/C). (3)
Two healthy volunteers were imaged under an IRB-approved protocol on the compact 3T11 using an 8-channel coil (Invivo, Gainesville, FL) and concomitant field compensation12,13. A calibration scan from a uniform agar gel phantom was also obtained. Each DIADEM dataset was acquired with 7 and 14 shots, respectively for the in-vivo and phantom calibration scans, which resulted in a total scan time of 3:02 and 6:04, respectively. The GNL-caused bias maps were measured by Eq. 2 based on the images from non-DW and DW-DIADEM data in the SW-PE dimension. To normalize the bias map, a value assumed to be ideal (i.e. C=1) at the isocenter was chosen without direct measurement of the diffusion coefficient in phantom. After the proposed GNL bias correction in Eq. 3, GNL-induced geometric distortion correction was performed using the vendor provided algorithm. Finally, DTI scalars were calculated using FSL14. The results were also compared with those obtained from the GNL bias correction method using a 10th-order spherical harmonic model (SHM) determined via EM simulation1,2.
Results and Discussion
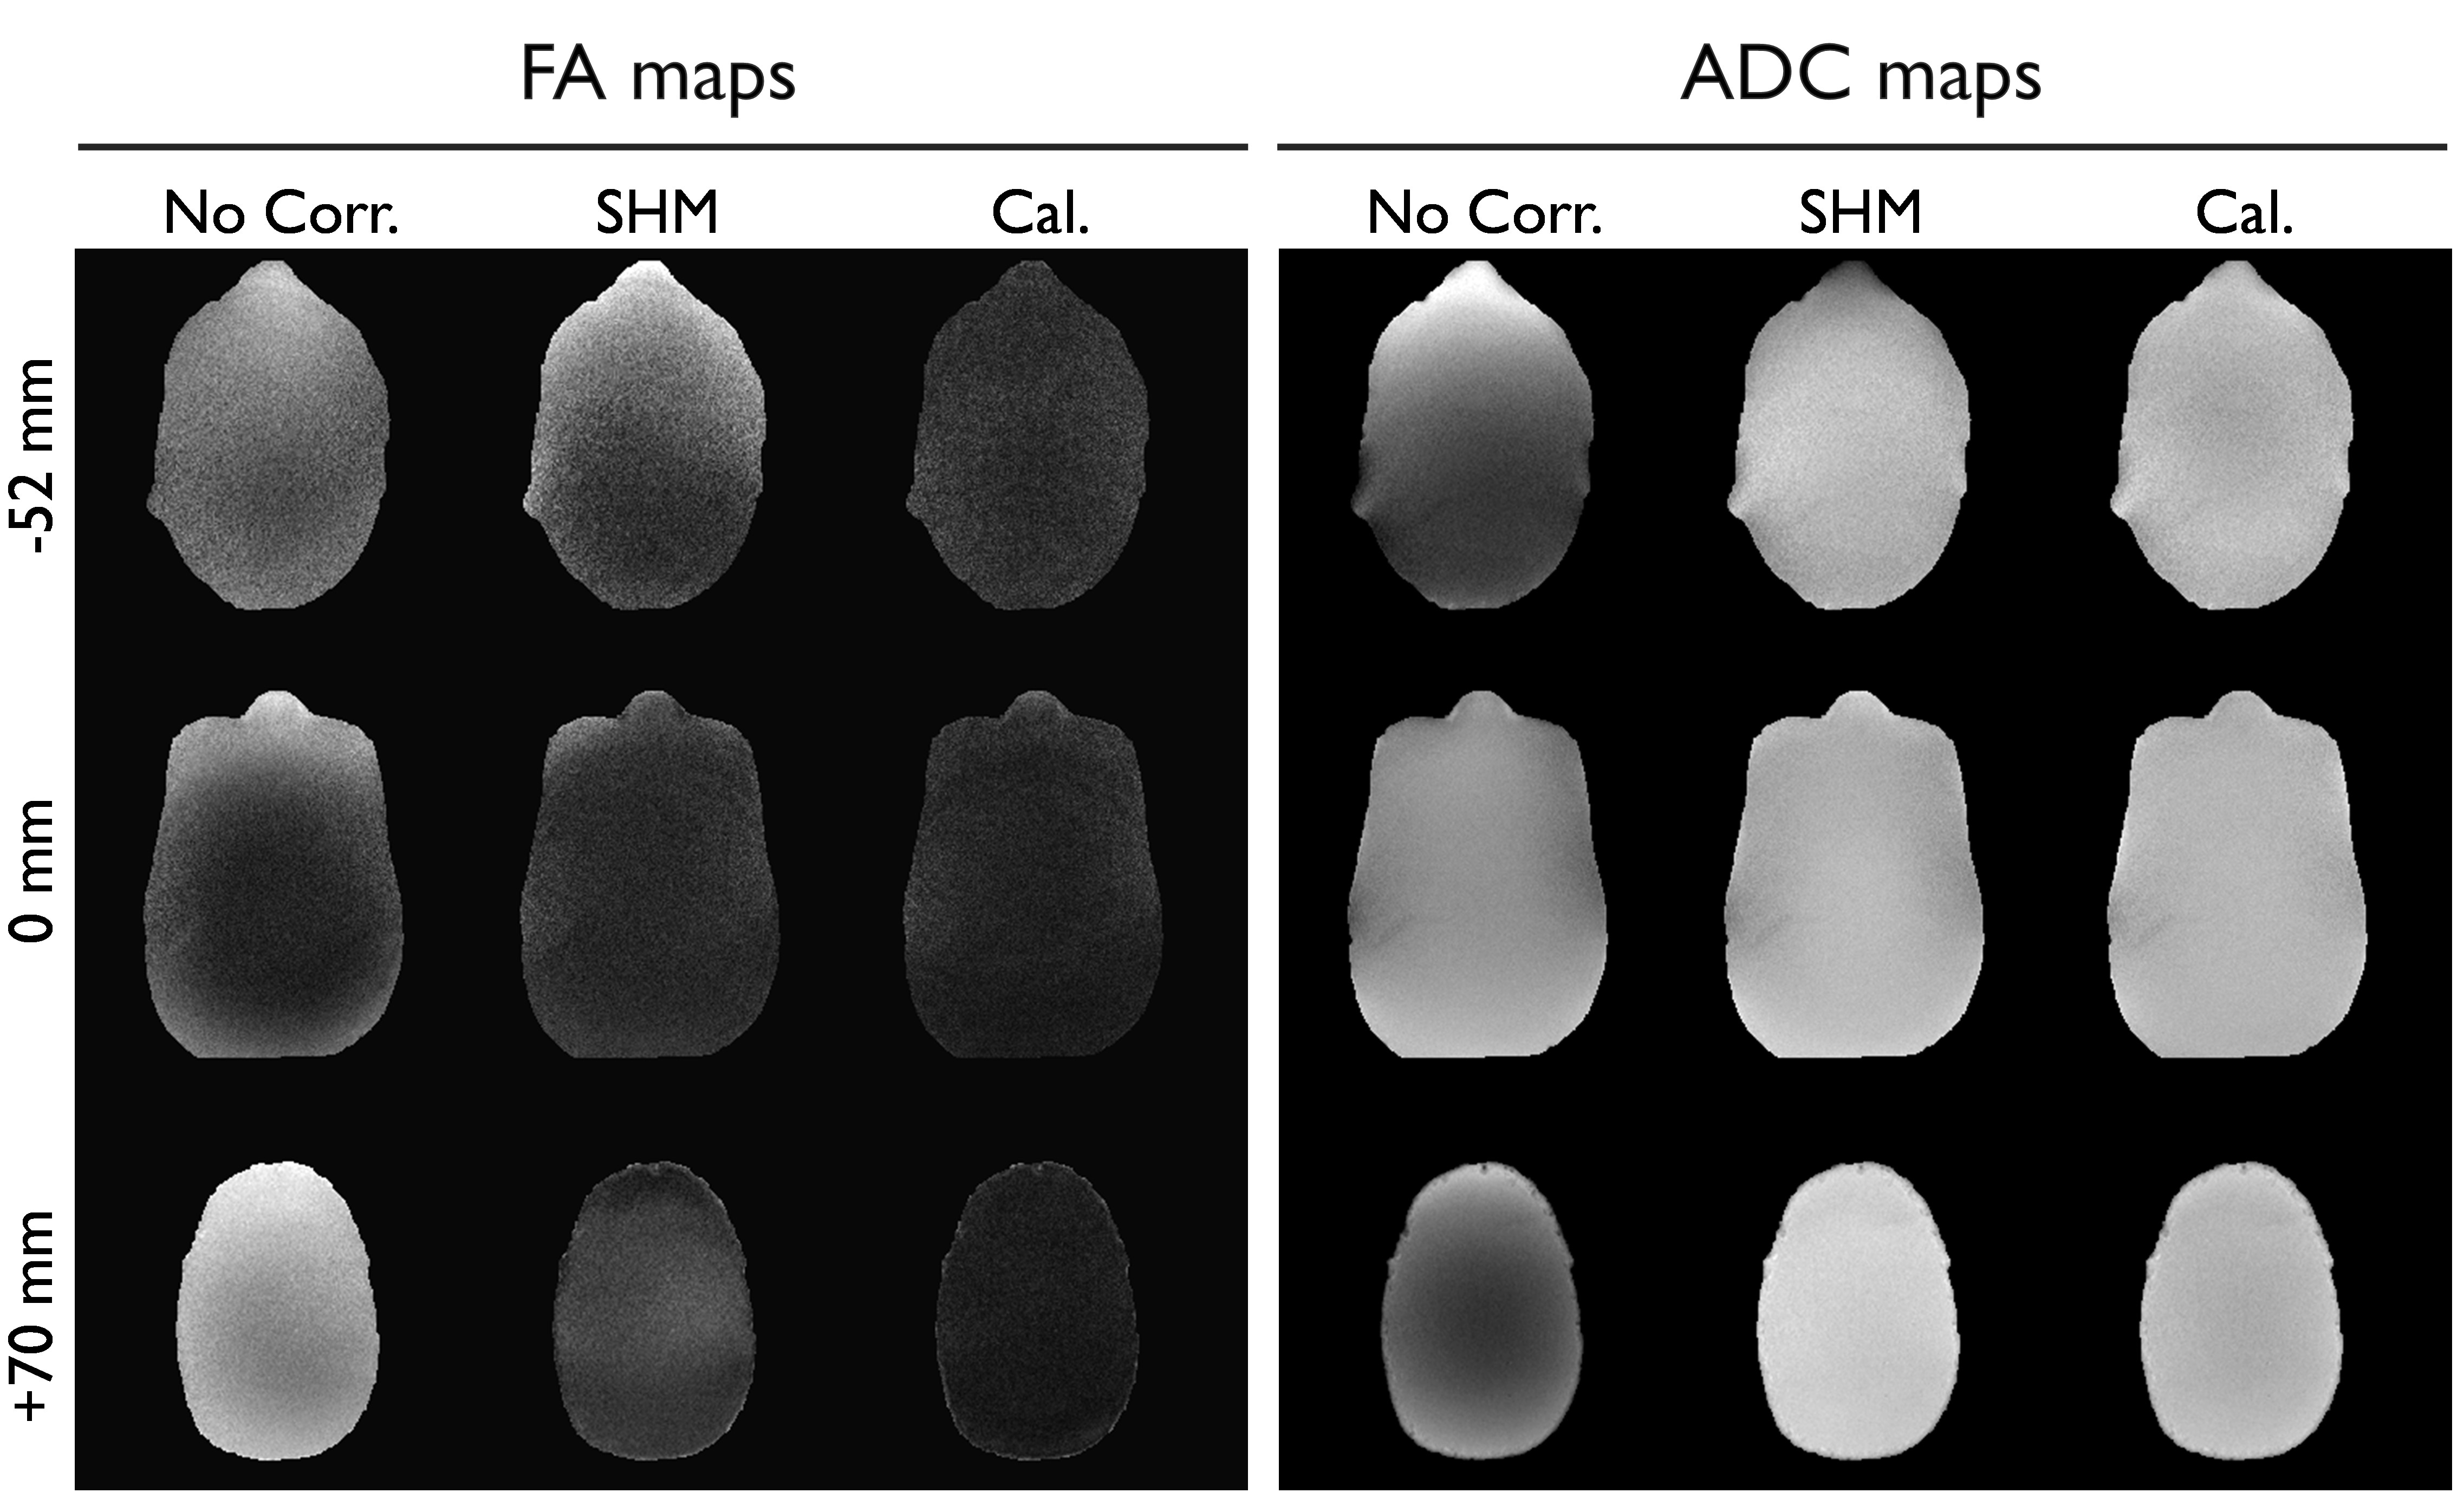
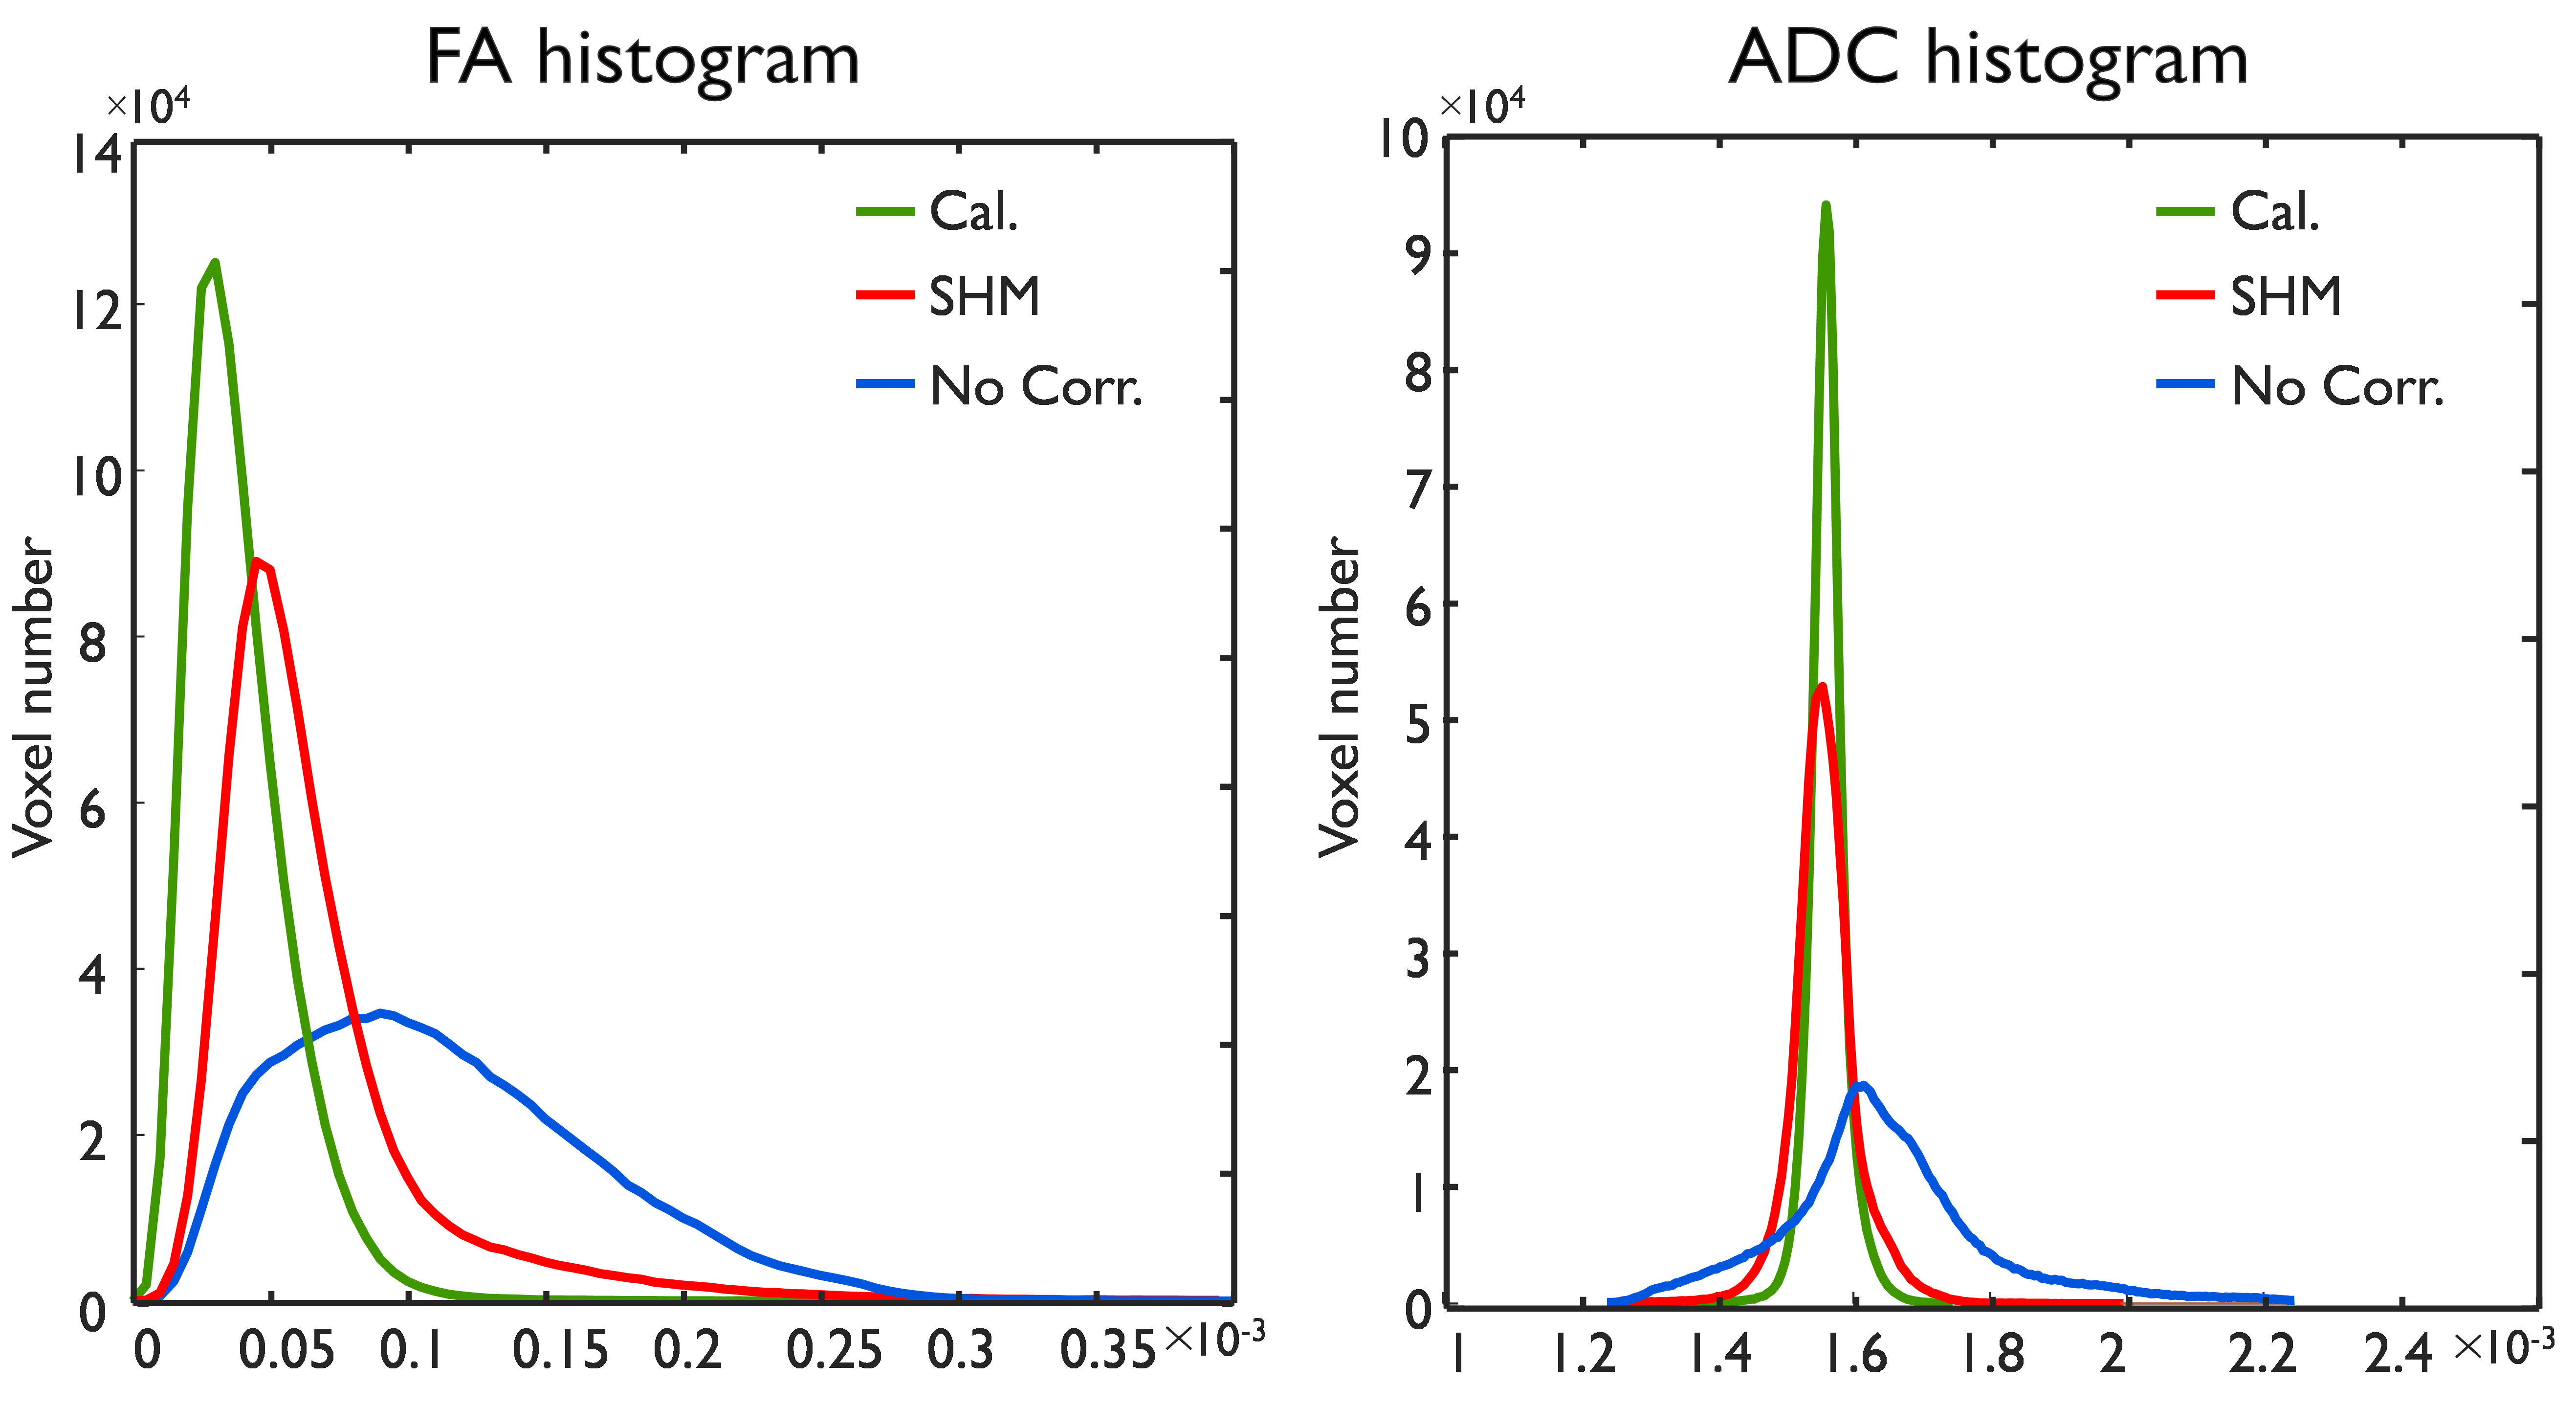
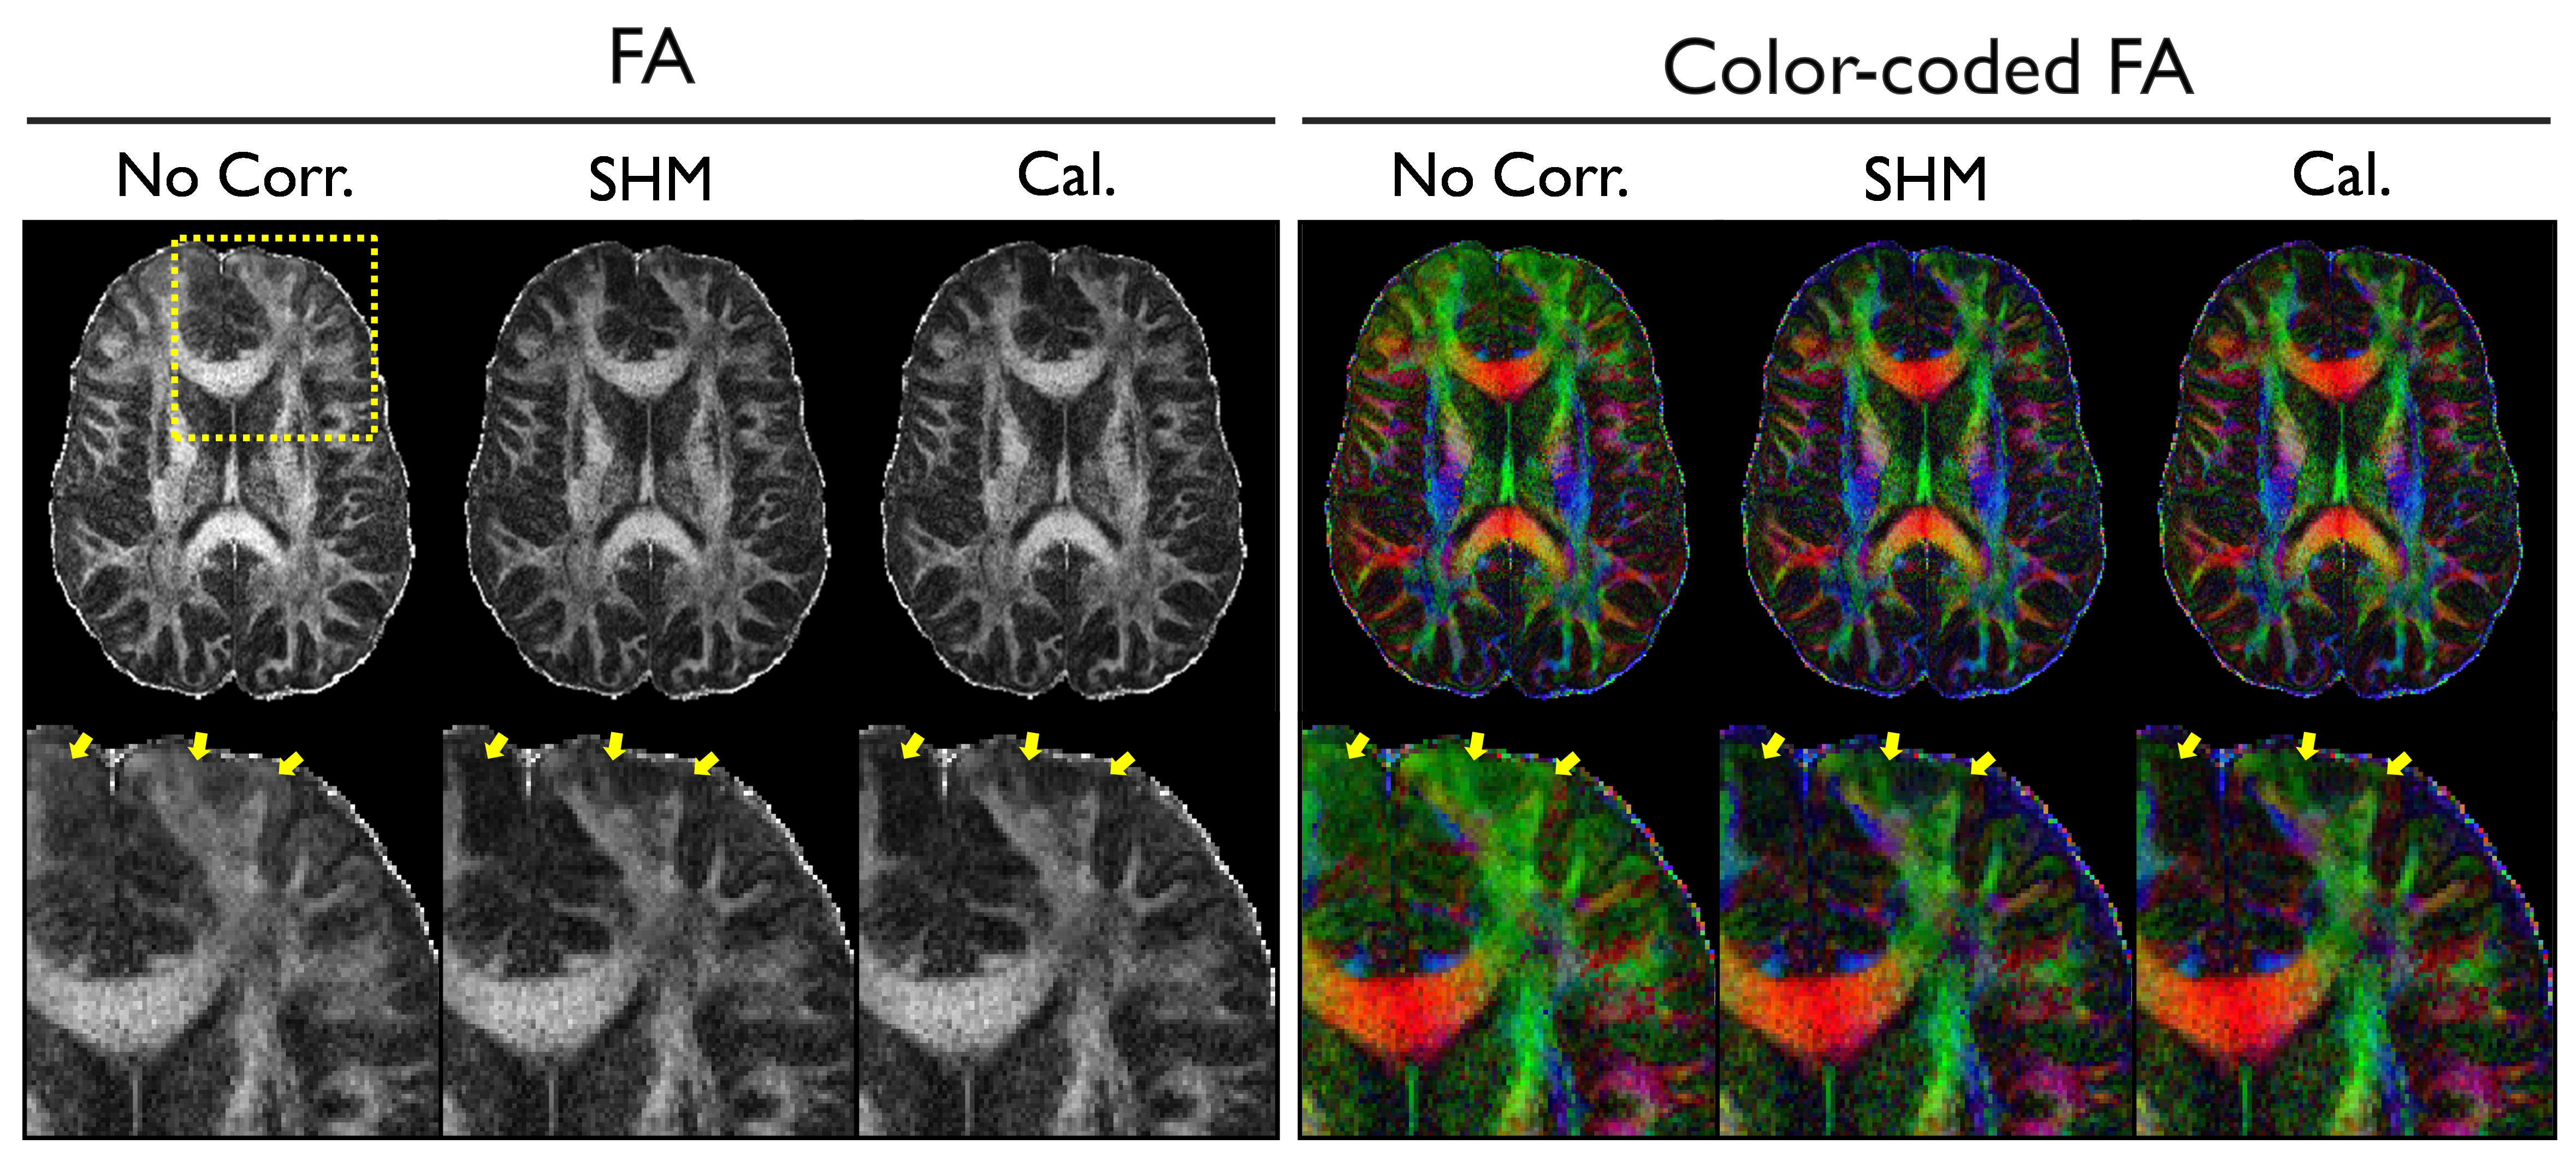
Strong GNL-induced bias was observed in both the FA and ADC maps without correction on the compact 3T system (Fig. 1). The non-uniformity effects were more pronounced, especially at regions far away from the isocenter. Although the GNL bias correction was effective for both the high-order SHM and the proposed calibration approaches, the error was further reduced by the proposed approach, as shown in the histograms of FA and ADC (Fig. 2). While reliable bias correction was still possible using the proposed approach even in the regions far from the isocenter, the spatial non-uniformity errors can still be observed in results from the previously described approach (Fig. 2). Due to the bias, in the color-coded FA maps, green and blue colors were more apparent, respectively in the inferior and superior regions of the brain without correction (yellow arrows in Fig. 3). These were effectively resolved after GNL correction. No noticeable differences between two approaches were observed in in-vivo results. Given these results, and the relative simpler calibration using the phantom compared to using the standard GNL phantoms, the results are encouraging.Conclusion
This study demonstrates the feasibility of DIADEM-based
GNL-induced bias calibration using a simple, isotropic gel phantom. This
approach is free from DW-EPI-related distortions and separates confounding distortion
effects from both GNL and DW-EPI. In addition, the bias map can be directly
applied to the reconstructed images from the DIADEM data for the correction. Together
with DIADEM-based diffusion imaging, the proposed calibration approach enables reliable quantitative diffusion imaging.Acknowledgements
This work was supported by NIH U01 EB024450-01.References
1. Tan ET, Marinelli L, Slavens ZW, King KF, Hardy CJ. Improved correction for gradient nonlinearity effects in diffusion‐weighted imaging. JMRI 2013;38(2):448-453.
2. Tao AT, Shu Y, Tan ET, Trzasko JD, Tao S, Reid R, Weavers PT, Huston J, Bernstein MA. Improving apparent diffusion coefficient accuracy on a compact 3T MRI scanner using gradient non-linearity correction. JMRI 2018; doi: 10.1002/jmri.26201.
3. In MH, Posnansky O, Speck O. High-resolution distortion-free diffusion imaging using hybrid spin-warp and echo-planar PSF-encoding approach. Neuroimage. 2017;148:20-30. doi: 10.1016/j.neuroimage.2017.01.008.
4. Huang KC, Cao Y, Baharom U, Balter JM. Phantom-based characterization of distortion on a magnetic resonance imaging simulator for radiation oncology. Phys Med Biol. 2016;61(2):774-90.
5. Gunter JL, Bernstein MA, Borowski BJ, Ward CP, Britson PJ, Felmlee JP, Schuff N, Weiner M, Jack CR. Measurement of MRI scanner performance with the ADNI phantom. Med Phys. 2009 Jun; 36(6):2193-205.
6. Weavers PT, Tao S, Trzasko JD, Shu Y, Tryggestad EJ, Gunter JL, McGee KP, Litwiller DV, Hwang KP, Bernstein MA. Image-based gradient non-linearity characterization to determine higher-order spherical harmonic coefficients for improved spatial position accuracy in magnetic resonance imaging. MRI 2017;38:54-62.
7. Tao S, Trzasko, J, Gunter J, Weavers P, Shu Y, Huston J, Lee SK Tan E, Bernstein MA. Gradient nonlinearity calibration and correction for a compact, asymmetric magnetic resonance imaging gradient system. Phys Med Biol. 2017; 21(62):N18-N31.
8. Stejskal EO, Tanner JE. Spin diffusion measurements: spin echoes in the presence of time-dependent field gradient. J Chem Phys. 1965;42:288–292
9. Bammer, R., Markl, M., Barnett, A., Acar, B., Alley, M., Pelc, N., Glover, G., Moseley, M., Analysis and generalized correction of the effect of spatial gradient field distortions in diffusion‐weighted imaging. MRM 2003; 50, 560-569.
10. Malyarenko DI, Ross BD, Chenevert TL. Analysis and correction of gradient nonlinearity bias in apparent diffusion coefficient measurements. MRM 2014;71(3):1312-1323.
11. Foo TK, Laskaris E, Vermilyea M, Xu M, Thompson P, Conte G, Van Epps C, Immer C, Lee SK, Tan ET. Lightweight, compact, and high-performance 3 T MR system for imaging the brain and extremities. MRM 2018. doi: 10.1002/mrm.27175.
12. Tao S, Weavers PT, Trzasko JD, Shu Y, Huston J 3rd, Lee SK, Frigo LM, Bernstein MA. Gradient pre-emphasis to counteract first-order concomitant fields on asymmetric MRI gradient systems. MRM 2017;77(6):2250-2262. doi: 10.1002/mrm.26315.
13. Weavers PT, Tao S, Trzasko JD, Frigo LM, Shu Y, Frick MA, Lee SK, Foo TKF, Bernstein MA. B0 concomitant field compensation for MRI systems employing asymmetric transverse gradient coils. MRM 2017; doi:10.1002/mrm.26790
14. FSL package, https://fsl.fmrib.ox.ac.uk/fsl/fslwiki/FSL
Figures