3399
Progress toward on-line implementation of vendor-provided prospective correction for non-uniform diffusion weighting due to gradient nonlinearity1Radiology, University of Michigan Health System, Ann Arbor, MI, United States, 2Philips Research Laboratories, Cambridge, MA, United States, 3GE Global Research, Niskayuna, NY, United States, 4Siemens Medical Solutions, Cary, NC, United States, 5Philips MR Clinical Science, Best, Netherlands, 6Radiology and Biomedical Imaging, University of California San Francisco, San Francisco, CA, United States, 7Radiology and Radiological Science, John Hopkins University School of Medicine, Baltimore, MD, United States
Synopsis
Feasibility of the prospective correction for non-uniform diffusion weighting due to gradient nonlinearity using scanner-specific gradient design information was previously demonstrated by our academic-industrial partnership (AIP). Here we report on the progress toward implementation of the prospective correction by leading MRI vendor participants of the AIP on their respective scanner platforms. The vendor-provided on-line correction is benchmarked by comparison to previously validated retrospective off-line processing for uniform gel and flood phantoms, and a human volunteer. Vendor efforts enable comprehensive bias correction for standardization of quantitative DWI applications in multi-center clinical trial environments.
Introduction
Non-uniform diffusion weighting due to gradient nonlinearity (GNL)1,2 causes spatial system-dependent bias in the quantitative apparent diffusion coefficient (ADC) metric routinely derived from DWI measurements on clinical MRI systems3,4. Although off-line retrospective ADC correction has been successfully demonstrated for several in vivo applications3,5,6, its wide implementation across multi-center clinical trials utilizing ADC imaging points3 has been hampered by proprietary gradient characteristics and vendor conventions5,7,8. This study describes the progress toward implementation of prospective (on-scanner) correction by leading MRI vendors benchmarked against retrospective vendor-independent correction2,9.Methods
Uniform (water-based) diffusion phantoms at ambient temperature and the brain of an IRB-consented volunteer were scanned on three clinical MRI systems (Sys1, Sys2 and Sys3) representing different MRI manufacturers. Torso-size flood phantom was made with water added to polyester fiber (to prevent swirling) in a rectangular 490x400x100mm3 plastic container. Head-size (170mm-diameter) fBIRN10 phantom was also used, consisting of 1.5% agar (in water) gel. fBIRN phantom and volunteer brain were scanned as previously described3,8 near isocenter (low GNL bias reference) and at 120-130mm superior offset (>10% predicted GNL bias).
2D DWI scans used large field-of-view (FOV=500-550mm) with 9 (flood) and 25 (fBIRN) 4-5mm-thick coronal slices for phantoms, and a typical brain protocol with 25 oblique axial slices (FOV=255mm) for a human volunteer. Quantitative DWI was acquired using b = 0 and 1000s/mm2 with 8 (fBIRN), 4 (brain) and 1 (flood) excitations per b-value to ensure high-b SNR>15. Repetition times were: TR = 3.7, 8.3, 10s, and echo-times: TE = 70, 80, 95ms, for brain, fBIRN and flood phantoms, respectively. Three orthogonal DWI gradients were applied along the primary patient axes in vendor-specific order (DWI1, DWI2, DWI3).
The DWI gradient directions, b-values and acquisition geometry were extracted from DICOM image header. Voxel-wise ADC was fit as the slope of the mono-exponential log-DWI signal dependence on b-values. Measured spatial ADCm bias was quantified as deviation from ADCiso reference at isocenter. For histogram analysis, volumes-of-interest (VOIs) were manually defined avoiding B1 inhomogeneity and susceptibility artifacts. The prospective DWI bias correction was performed using vendor-provided tools. The independent benchmark correction was applied retrospectively to DICOM series for the individual DWI directions as previously described2,5. Benchmark correction utilized system GNL tensors numerically modeled using spherical harmonic (SPH) expansion with vendor-provided model coefficients9. All data analysis was automated in MATLAB R2015b (Mathworks, Natick MA).
Results and Discussion
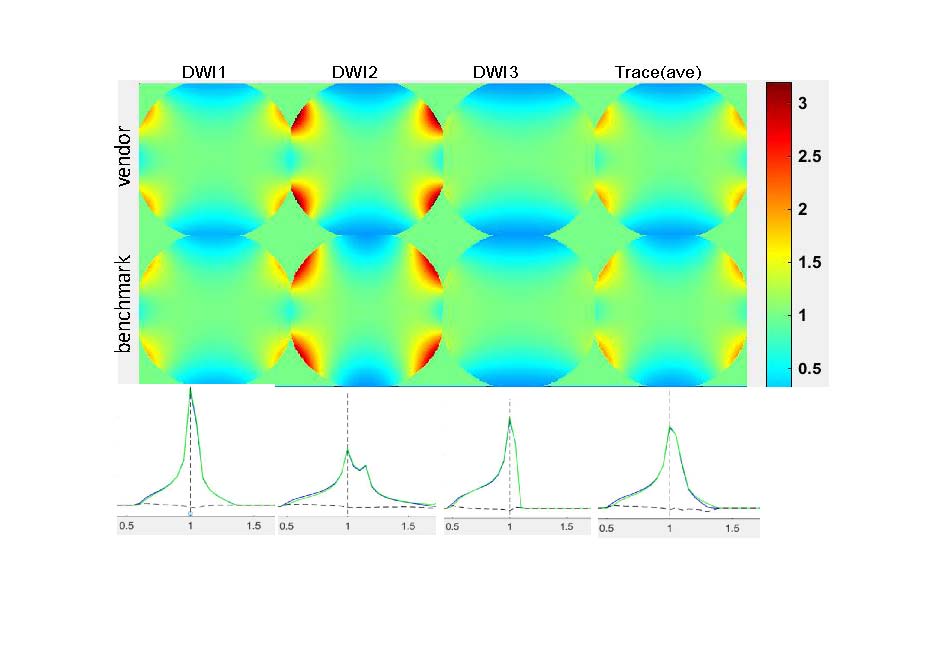
Sys1 on-scanner implementation allowed correction of individual DWI directions, and DICOM export of corrected DWI intensities, ADC maps, and corrector maps. The latter were used for direct comparison of (noise-less) scanner-generated and off-line benchmark corrector maps shown in Figure 1. The scanner-generated Sys1 corrector maps properly reflected GNL bias patterns (Fig.1, maps) with expected 50% under-weighting superior-inferior and over-weighting right-left. Minor differences versus independent benchmark correctors were detected for >200mm offsets. Good agreement between predicted direction-specific bias histograms within the flood phantom VOI confirmed correction implementation consistent with the benchmark (Fig.1, histograms).
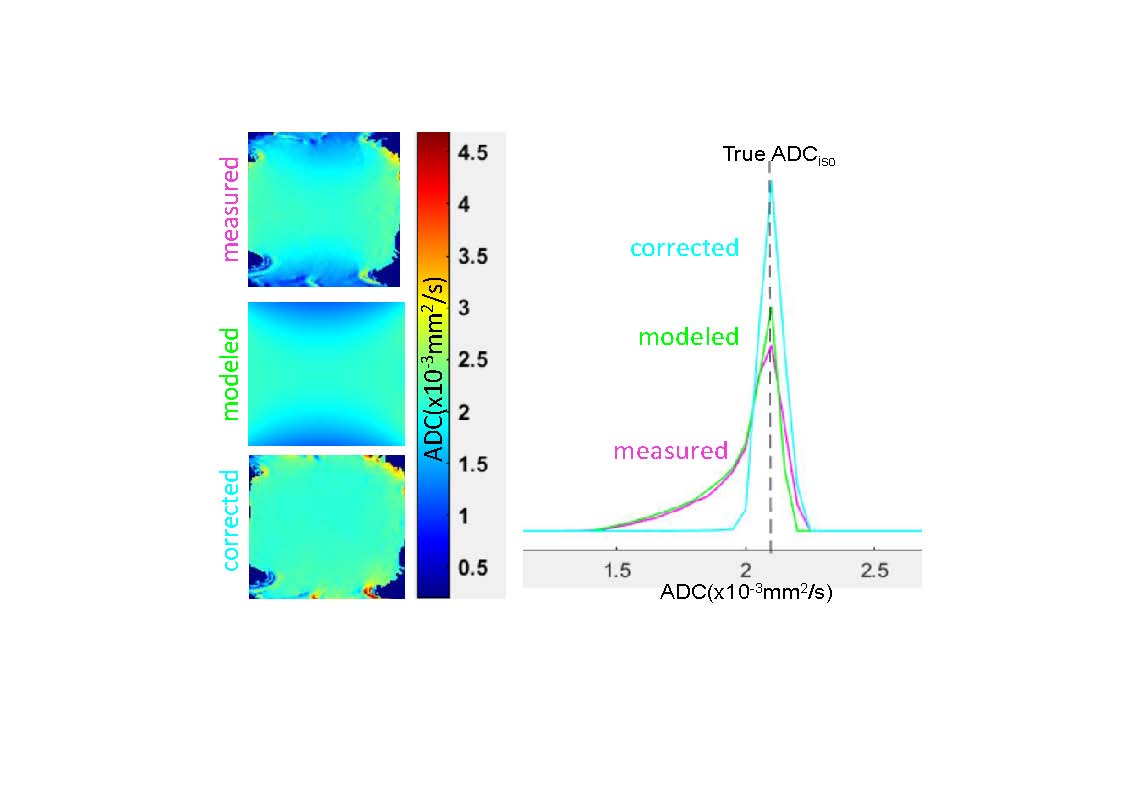
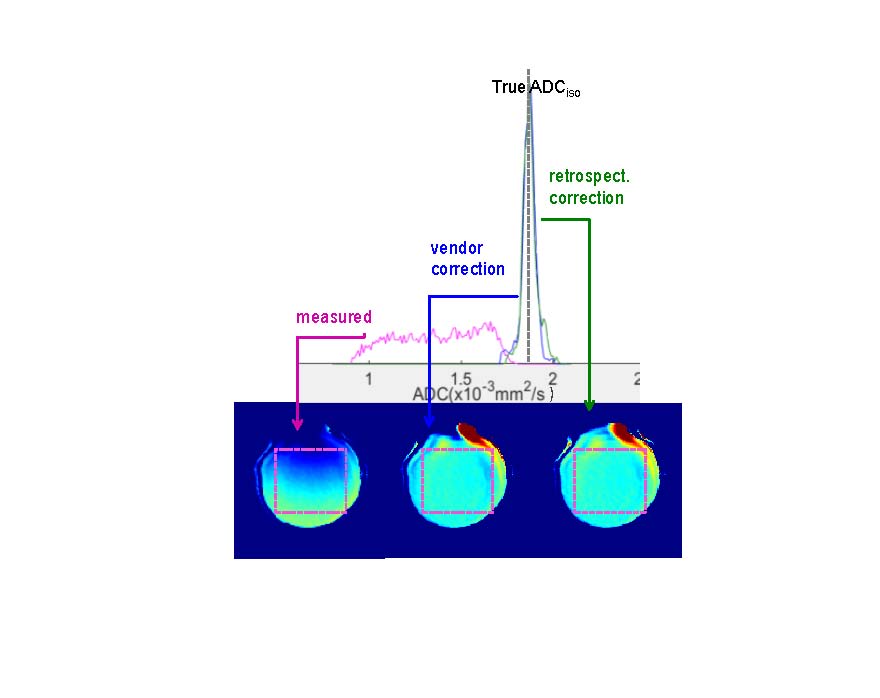
Figure 2 illustrates flood-phantom ADC correction for Sys2 DWI3 direction. SPH-model for DWI3 GNL corrector (Fig.2, middle map) properly reflected observed direction-dependent ADC non-uniformity pattern (Fig.2, top map) with bias ranging from -28% to +7% (Fig.2, magenta vs. blue histograms) with respect to isocenter reference (ADCiso=2.08x10⁻³mm2/s). Model-based correction effectively restored DWI3 ADC uniformity within the flood phantom volume (Fig.2, bottom map). Figure 3 illustrates comparable efficiency achieved by vendor-provided Sys3 GNL bias correction (implemented post-reconstruction based on DWI DICOM) and independent benchmark for average (trace-DWI) correction of an isotropic fBIRN phantom. The original observed ADC histogram bias (-50% to -5%) with respect to the isocenter reference (ADCiso=1.85x10⁻³mm2/s) was reduced down to measurement uncertainty (±5%).
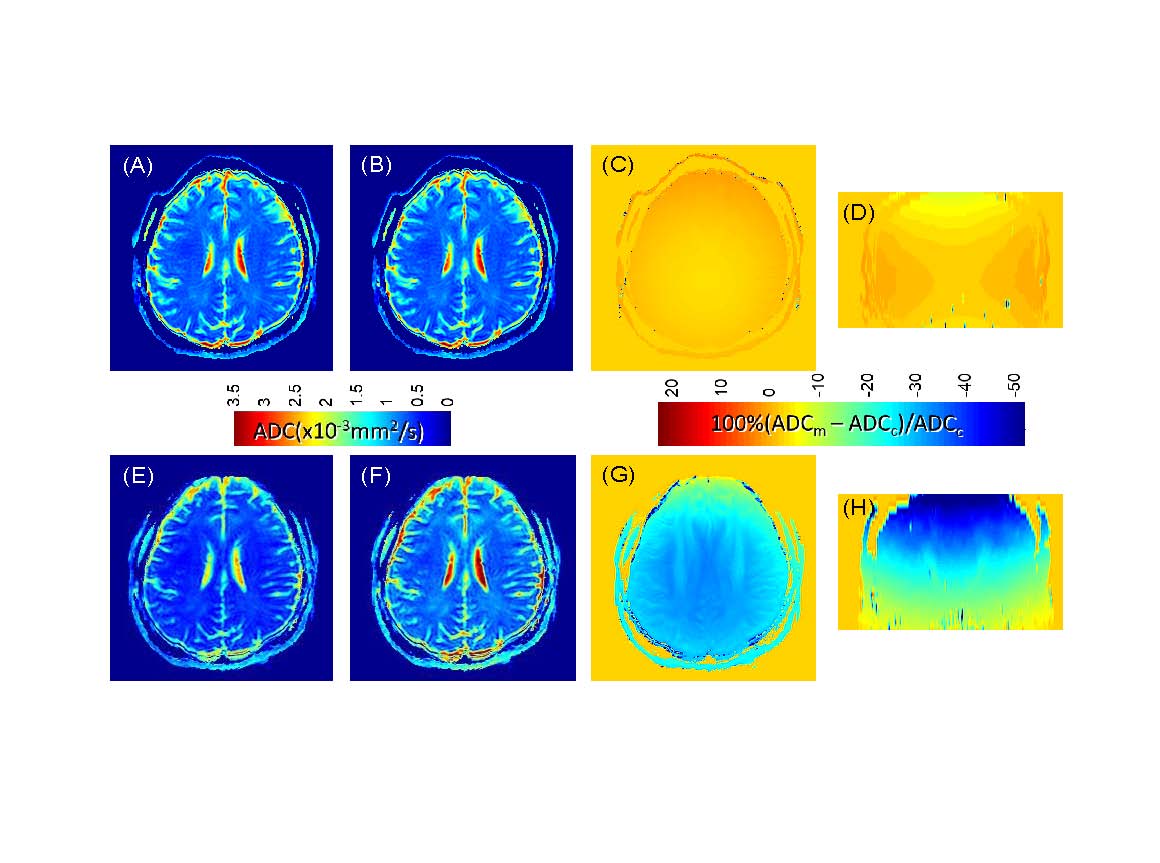
Figure 4 illustrates results of Sys1 vendor-provided correction for non-uniform diffusion weighting bias in brain ADC maps. Significant anatomy-specific ADC “attenuation” (e.g., from 0.8 to 0.5 (x10-3mm2/s) for midbrain white matter) evident for offset scan map (Fig.4E) compared to (low-bias) reference near isocenter (Fig.4A) is effectively corrected in Fig.4F. Anatomic %bias differences observed in Fig.4G for isotropic CSF (-20%) versus anisotropic white-matter regions (-30%) indicate sensitivity to directional DWI correction that would be lost by average correction of the trace-DWI. Coronal reformats in Fig.4D,H confirm characteristic GNL bias patterns with small bias near isocenter (0% to -5%, Fig.4D) and large SI non-uniform weighting gradient for offset location (-5% to -45%, Fig.4H) removed by correction.
Summary
Substantial progress has been demonstarted by vendors toward prospective DWI correction implementation for GNL-induced ADC bias. Minor deviations from the independent benchmark require implementation adjustments. Vendor-provided correction is preferred in multi-site trial setting for independence of proprietary gradient characteristics and DICOM conventions to standardize quantitative DWI metrics.Acknowledgements
National Institutes of Health Grants: R01CA190299, U01CA166104, U01CA151235, U01CA140204, 5P30CA006973.
Disclosure: T..Chenevert and D.Malyarenko are co-inventors of intellectual property assigned
to and managed by the University of Michigan for the patented GNL-bias DWI correction technology (US9851426)
licensed to Philips Medical Systems. E.Tan and J.Tondeur are employees of General Electric and Siemens, respectively. A.Devaraj and J.Peeters are Philips employees.
References
1.Bammer R, Markl M, Barnett A, et.al. Analysis and generalized correction of the effect of spatial gradient field distortions in diffusion-weighted imaging. Magn Reson Med. 2003 50:560-569
2.Malyarenko DI, Ross BD, Chenevert TL. Analysis and correction of gradient nonlinearity bias in apparent diffusion coefficient measurements. Magn Reson Med. 2014; 71(3):1312-1323
3.Newitt DC, Tan ET, Wilmes LJ, et al, Gradient Nonlinearity Correction to Improve Apparent Diffusion Coefficient Accuracy and Standardization in the American College of Radiology Imaging Network 6698 Breast Cancer Trial. J Magn Reson Imaging. 2015; 42(4): 908–919
4.Malyarenko DI, Newitt D, Wilmes LJ, et.al. Demonstration of nonlinearity bias in the measurement of the apparent diffusion coefficient in multicenter trials. Magn Reson Med. 2016; 75(3):1312-23
5.Malyarenko DI and Chenevert TL. Practical estimate of gradient nonlinearity for implementation of apparent diffusion coefficient bias correction. J Magn Reson Imaging. 2014; 40: 487-95
6.Malyarenko DI, Pang Y, Senegas J, et.al. Correction of Gradient Nonlinearity Bias in Quantitative Diffusion Parameters of Renal Tissue with Intra Voxel Incoherent Motion. Tomography. 2015; 1(2): 145-151
7.Tan ET, Marinelli L, Slavens ZW, et.al. JMRI. Improved correction for gradient nonlinearity effects in diffusion-weighted imaging. J Magn Reson Imaging. 2013; 38(2):448-53
8.Malyarenko DI, Wilmes LJ, Arlinghaus LR, et.al. QIN DAWG Validation of Gradient Nonlinearity Bias Correction Workflow for Quantitative Diffusion-Weighted Imaging in Multicenter Trials. Tomography 2016; 2(4): 396-405
9.Malyarenko D, Pang Y, Wilmes L, et.al.Correction of nonuniform diffusion weighting in DWI using vendor-provided gradient characteristics, ISMRM'25 Annual Conference, Honolulu HI, TP05: 1780, 2017
10.Glover GH, Function Biomedical Informatics Research Network (fBIRN) stability phantom QA procedures (2005) [accessed 31 Oct 2018]. Available from: https://www.nitrc.org/frs/download.php/275/fBIRN_phantom_qaProcedures.pdf
Figures