3391
Diffusion Gradient Nonlinearity Correction in a Diffusion Phantom and in Breast Cancer Bone Metastases1Department of Radiology, Aarhus University Hospital, Aarhus, Denmark, 2Department of Oncology, Aarhus University Hospital, Aarhus, Denmark
Synopsis
The purpose was to investigate if diffusion gradient nonlinearity (DGNL) ADC-errors could be corrected in vitro and in vivo.
Methods
DWIBS was performed in a diffusion phantom and in breast cancer patients. ADC-maps with and without DGNL correction were created and compared at different positions relative to the isocenter.
Results
In the diffusion phantom uncorrected ADC-values 17.5cm from the isocenter dropped by 29-32% while the corrected ADC-values increased by 2-4%.
In 85 bone metastases uncorrected ADC-values 14cm from the isocenter dropped by 18.7% while corrected ADC-values dropped by 2.8%.
Conclusion
DGNL ADC-errors can be corrected in vitro and in vivo.
Abstract
Introduction
Quantitative DW-MRI is increasingly being studied as an assessment method when evaluating response in bone metastasizing cancers1. Using software to semi-automatically segment the metastatic bone marrow, total diffusion volume and global tumor ADC-values can be obtained with high inter- and intra-observer repeatability2 for response assessment3. Increases in mean ADC-values are often a sign of response3,4, while decreases often area sign of progression3. Even though ADC-values have high reproducibility at the scanner isocenter both in vitro5,6 and in vivo7 ADC-values are not homogenous across large FOVs on clinical MRI systems due to diffusion gradient nonlinearities (DGNL)5,8,9. Previously, DGNL correction has not been available on clinical MRI systems10,11. In this study we investigate if ADC-values can be corrected for DGNL in a diffusion phantom and in bone marrow metastases from breast cancer across a large FOV using realistic clinical scan parameters and a correction algorithm supplied by the scanner vendor based on a published correction method12.
Methods
DWI was performed in patients and diffusion phantom with an axial spin echo single-shot echo-planar imaging sequence using 3 b-values (0, 50, 800). Two sets of monoexponential ADC-maps, one uncorrected and one DGNL corrected, were generated with the system software from the b50 and b800 images.
A diffusion phantom with vials of aqueous solutions of polymer in different concentrations was used to test DGNL correction against reference ADC-values (Figure 1). DWI sequences were obtained and the table moved 5cm maintaining the same spatial position of the FOV, thus moving the phantom relative to the FOV. 35cm was covered. On the ADC-maps 3.75cm2 region of interests were placed in each vial and mean ADC-values were recorded as well as position relative to the FOV isocenter. Polynomial regression was performed for each solution with and without correction. Fitted datasets were created and corrected and uncorrected were compared at different positions relative to the isocenter.
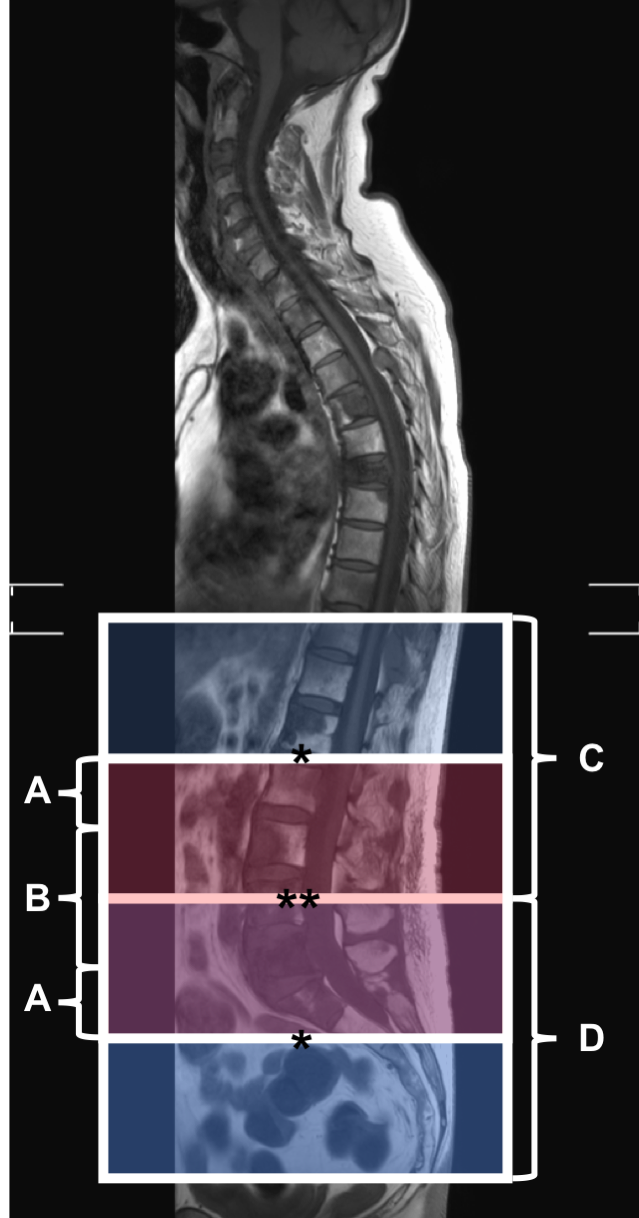
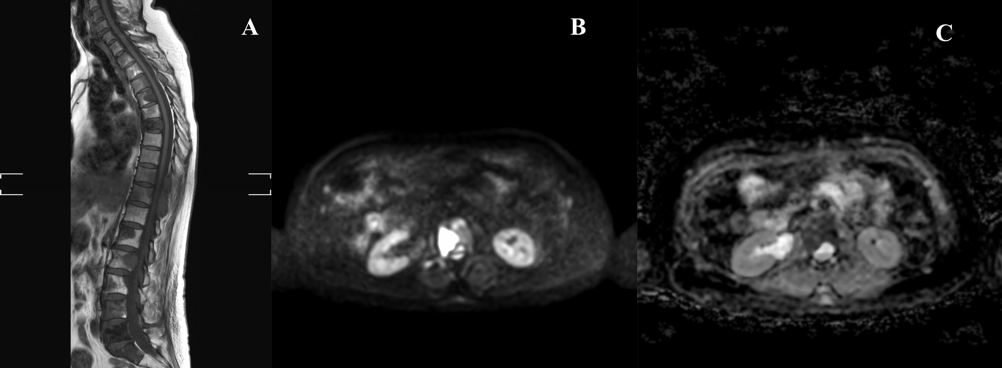
23 breast cancer patients with bone metastases undergoing MRI as part of response assessment were prospectively enrolled. DWI sequences were obtained in two adjacent stations with no overlap and used for reference. An intermediate overlap station was placed with its isocenter where the two adjacent stations met (Figure 2). 2cm2 ROIs were drawn in each slice that contained bone metastases on the b800 diffusion weighted images (Figure 3) and copied to the ADC-map. Mean tumor ADC-values with and without DGNL correction and spatial positions were recorded for both the continuous stations and the overlap station. Polynomial regression was performed on corrected and uncorrected ADC-values and a fitted dataset was created. This dataset was then compared at different positions relative to the isocenter.
Results
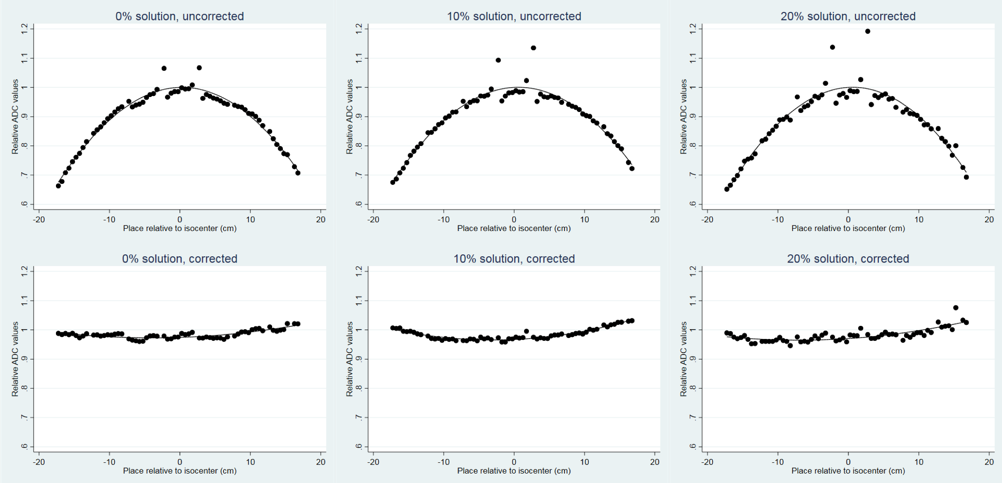
In the diffusion phantom uncorrected isocenter ADC-values differed by -0.4% (95% CI: -1.1% – 0.3%, p = 0.26), 2.9% (1.9% - 3.9%, p < 0.001) and 4.1% (2.7% - 5.6%, p< 0.001) (polymer solution 0%, 10% and 20% respectively) relative to the theoretical ADC-values (Figure 4). Uncorrected ADC-values 17.5cm from the isocenter dropped by 31.1% (29.6% – 32.6%), 29.0% (26.9% – 31.1%) and 31.9% (28.8% – 34.9%) (0%, 10% and 20% respectively). The DGNL corrected ADC-values 17.5cm from the isocenter increased by 2.0% (1.3% – 2.6%), 4.0% (3.5% – 4.5%) and 3.3% (2.2% – 4.4%) (0%, 10% and 20% respectively). A 5% ADC-error was found 6cm from the isocenter.
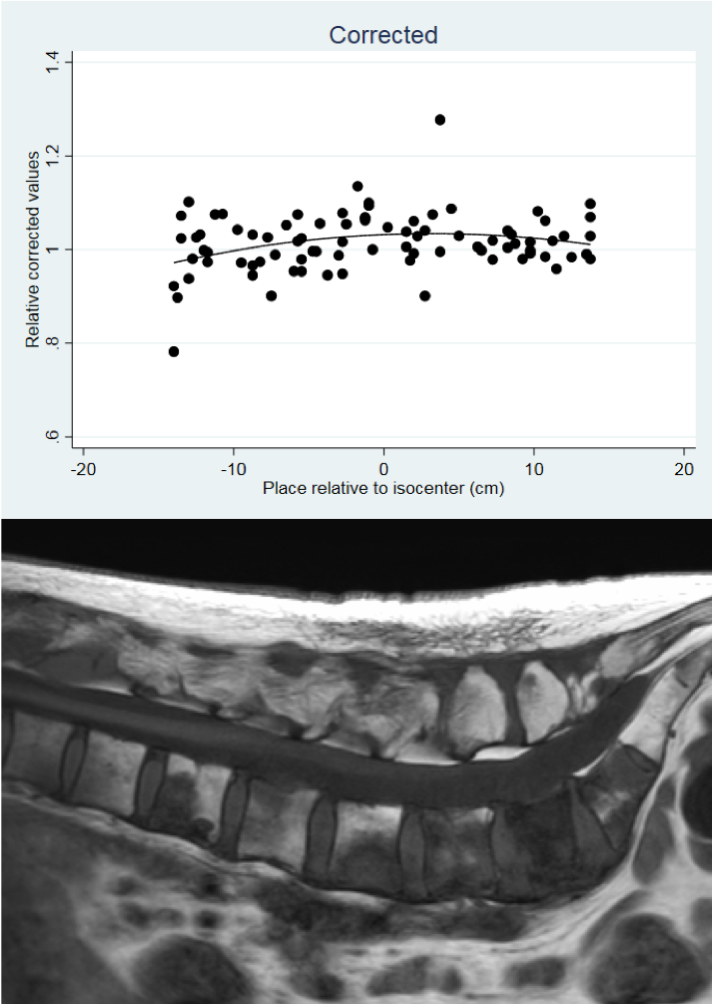
85 bone marrow metastases were evaluated in the breast cancer patients. Uncorrected ADC-values were 18.7% (14.9% – 22.5%) lower 14cm from the isocenter of the overlap FOV compared to the continuous station. The corrected ADC-values were 15.9% (10.8% – 21.0%, p < 0.001) higher than the uncorrected ADC-values 14cm from the isocenter. The corrected ADC-values were 2.8% (6.1% – -0.5%) lower 14cm from the isocenter compared to the reference continuous station (Figure 5).
Discussion
In this prospective study we have shown that DGNL can be corrected in vitro and in vivo using an online correction algorithm. To our knowledge this is the first study to use online DGNL correction in the feet-head direction in patients. Other studies have used offline correction algorithms, phantoms or looked at DGNL correction in the RL or AP direction.The maximum error of the ADC-measurements after correction 14cm from the isocenter was less than 3% in bone metastases and 4% in the phantom 17.5cm from the isocenter. This is within the range of variance expected when measuring ADC-values on clinical MRI systems5.
Conclusion
ADC-errors in the feet-head direction due to DGNL can be corrected in vitro and in breast cancer bone metastases in vivo, and should be used whenever quantitative DWI is performed on FOVs larger than 12cm.
Acknowledgements
The authors would like to thank Research Radiographer Olga Vendelbo for her help recruiting and scanning the patients and the Department of Radiology, Aarhus University Hospital, for making available the MRI scanner for the study.
References
References
1. Donners R, Blackledge M, Tunariu N, Messiou C, Merkle EM, Koh D-M. Quantitative Whole-Body Diffusion-Weighted MR Imaging. Magn Reson Imaging Clin N Am. Elsevier Inc; 2018;26(4):479–494
2. Blackledge MD, Tunariu N, Orton MR, et al. Inter- and Intra-Observer Repeatability of Quantitative Whole-Body, Diffusion-Weighted Imaging (WBDWI) in Metastatic Bone Disease. PLoS One. 2016;11(4):e0153840http://dx.doi.org/10.1371/journal.pone.0153840.
3. Blackledge MD, Collins DJ, Tunariu N, et al. Assessment of treatment response by total tumor volume and global apparent diffusion coefficient using diffusion-weighted MRI in patients with metastatic bone disease: A feasibility study. PLoS One. 2014;9(4):1–8.
4. Perez-Lopez R, Mateo J, Mossop H, et al. Diffusion-weighted Imaging as a Treatment Response Biomarker for Evaluating Bone Metastases in Prostate Cancer: A Pilot Study. Radiology. 2017; Apr;283(1):168-177.
5. Malyarenko D, Galbán CJ, Londy FJ, et al. Multi-system repeatability and reproducibility of apparent diffusion coefficient measurement using an ice-water phantom. J Magn Reson Imaging. 2013;May;37(5): 1238–1246.
6. Chenevert TL, Galbán CJ, Ivancevic MK, et al. Diffusion coefficient measurement using a temperature-controlled fluid for quality control in multicenter studies. J Magn Reson Imaging. 2011;October;34(4): 983–987.
7. Koh DM, Blackledge M, Collins DJ, et al. Reproducibility and changes in the apparent diffusion coefficients of solid tumours treated with combretastatin A4 phosphate and bevacizumab in a two-centre phase I clinical trial. Eur Radiol. 2009;Nov;19(11): 2728-38.
8. Tan ET, Marinelli L, Slavens ZW, King KF, Hardy CJ. Improved correction for gradient nonlinearity effects in diffusion-weighted imaging. J Magn Reson Imaging. 2013;38(2):448–453.
9. Malyarenko DI, Ross BD, Chenevert TL. Analysis and correction of gradient nonlinearity bias in apparent diffusion coefficient measurements. Magn Reson Med. 2014;Mar;71(3): 1312-23.
10. Bammer R, Markl M, Barnett A, et al. Analysis and generalized correction of the effect of spatial gradient field distortions in diffusion-weighted imaging. Magn Reson Med. 2003; Apr;50: 560–569.
11. Malyarenko DI, Newitt D, Wilmes LJ, et al. Demonstration of nonlinearity bias in the measurement of the apparent diffusion coefficient in multicenter trials. Magn Reson Med. 2016; Sep;50(3): 560-9.
12. Malyarenko DI, Chenevert TL. Practical estimate of gradient nonlinearity for implementation of apparent diffusion coefficient bias correction. J Magn Reson Imaging. 2014;December;40(6): 1487–1495.
Figures
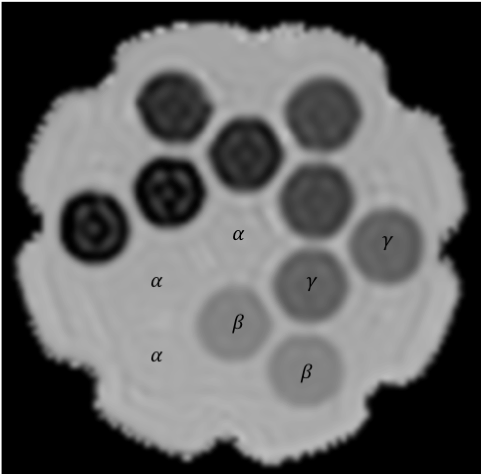
Figure 1: ADC map of the diffusion phantom with 7 vials containing 3 different solutions of polymer. α = 0% polymer solution. β = 10% polymer solution. γ = 20% polymer solution.