3390
Compensation of signal loss induced by scanner table vibrations in high b-value DW-TSE for measuring lipids ADC1Department of Diagnostic and Interventional Radiology, Technical University Munich, Munich, Germany, 2Health Systems Philips Schweiz, Zurich, Switzerland, 3Clinic of Orthopaedic Surgery, Technical University Munich, Munich, Germany
Synopsis
Fat plays a central role in the incidence of metabolic syndrome but current MRI biomarkers cannot answer questions about fat cell microstructure. Diffusion-weighted measurements are capable of revealing information about fat tissue microstructure but the required strong diffusion weighting induces scanner table vibrations that eventually lead to measurement errors and artifacts. The purpose of this work was to mitigate vibration artifacts by placing a vibration compensation gradient before the diffusion preparation. The approach was tested in a water-fat phantom and in-vivo in the lower leg of a healthy volunteer.
Purpose
Due to the role of fat in the increased prevalence of obesity and diabetes, there is an increased interest in probing fat microstructure using diffusion-weighted (DW) MRI1. DW measurements have been recently applied to measure lipid apparent diffusion coefficient (ADC)2,3 and probe lipid diffusion restriction effects to extract lipid droplet size4,5. To measure the low fat ADC2, strong diffusion weighting is required, bringing up technical issues related to eddy currents6, table vibrations3 and increased sensitivity to macroscopic motion7. Diffusion gradients were shown to yield scanner table vibrations (for example: frequency of 20-30 Hz, amplitude up to 100µm)8. The observed vibrations are so strong that even elastrography experiments with the table vibrations as the mechanical actuator have been proposed9. Any motion during the diffusion sensitizing periods, induces an additional accumulated phase and can eventually lead to signal cancellations due to intravoxel dephasing. The amount of the intravoxel dephasing by motion scales at a first approximation with the first gradient moment. The strong diffusion weightings required for measuring lipid diffusion therefore result in strong dephasing effects in the presence of table vibrations. A DW TSE sequence was recently applied to measure spatially resolved lipid diffusion10. This work tries to mitigate vibration artifacts by applying a vibration compensation gradient. The approach was tested in a water-fat (WF) phantom and in a volunteer’s calf.Methods
Pulse sequence:
A STE-DW preparation consisting of four 90° RF pulses and mono-polar diffusion gradients, followed by a 2D TSE readout, was used. Vibration compensation gradients matching the diffusion gradients were introduced before the diffusion preparation (Figure 1).
Phantom:
An 80% fat fraction WF phantom was produced (content: 800ml oil, 200ml water, 4ml Tween80 and 1g of sodium benzoate). Emulsification was carried out with a colloid mill at 6000 revolutions per minute. The phantom was scanned with a 3T scanner (Ingenia Elition, Philips, Best) using an 8-channel wrist coil on the scanner table and on a wooden table (Figure 1). First, the timing between the vibration compensation gradients and the first diffusion gradients was varied under strong diffusion weighting (b-value: 50,000 s/mm2; TVibration: 40 ms to 525 ms) to obtain an optimal TVibration. Second, the ADC was measured (b-value: 5,000 s/mm2 to 50,000 s/mm2 in 5,000 s/mm2 steps) without and with the compensation gradients. Used parameters were: FOV: (120 mm)2, voxel size: 2x2x10 mm3, TR/TE/TMPrep/TEPrep: 2000/23/220/61ms, diffusion time(Δ): 255 ms.
In vivo:
The calf of one volunteer was scanned without and with vibration compensation. The measurements were performed using an 8-channel extremity coil with the following parameters: FOV: (140 mm)2, voxel size: (2.2 mm)3, TR/TE/TMPrep/TEPrep: 1800/10/220/61 ms, b-values identical with the phantom experiment, scan time: 1:31 min.
Results
Phantom:
A signal intensity maximum was overserved when TVibration matched the timing of the first and second diffusion gradients (intensity increased to 117%). On the wooden table, no such signal fluctuations were observed (Figures 2 and 3). The frequency of the observed signal oscillation was of the order of 11 Hz. In Figure 4, the DW signal with fitting is shown. Without the compensation, the ADC was 70% higher on the scanner table compared to the wooden table. When the vibration compensation gradients were employed a 25% higher ADC was measured. On the wooden table only an ADC difference of 2% was observed.
In vivo:
Figure 5 shows the obtained ADC maps. The subcutaneous fat ADC is qualitatively more heterogeneous (especially in the region indicated by the ellipse) without vibration compensation gradients. In the subcutaneous fat, a total decrease of 5% and a local decrease of 12% was observed in the ADC and a decrease of the 16% (total) and 43% (local) was observed in the ADC standard deviation with the vibration compensation gradients. In the tibia and fibula bone marrow only minor differences were observed.
Discussion and Conclusion
The proposed compensation was found to mitigate vibration artifacts. A possible explanation for the effect is that the additional gradients drive the mechanical system such that the vibration-induced displacement follows a similar pattern after the application of its diffusion gradient. Having the vibration-induced displacement in phase will reduce the effect of intravoxel dephasing that adds up to the diffusion dephasing and artificially increases the ADC. The proposed vibration compensation is not able to completely recover the lost signal, but the artifacts were strongly reduced. The additional gradient can be added without time penalty in the sequence TR and the overall concept could be theoretically applicable to most diffusion prepared sequences.Acknowledgements
The present work was supported by the European Research Council (grant agreement No 677661, ProFatMRI) and Philips Healthcare. This work reflects only the authors view and the EU is not responsible for any use that may be made of the information it contains.References
1. Hu HH, Kan HE. Quantitative proton MR techniques for measuring fat. NMR Biomed 2013;26(12):1609-1629.
2. Lehnert A, Machann J, Helms G, Claussen CD, Schick F. Diffusion characteristics of large molecules assessed by proton MRS on a whole-body MR system. Magn Reson Imaging 2004;22(1):39-46.
3. Steidle G, Eibofner F, Schick F. Quantitative Diffusion Imaging of Adipose Tissue in the Human Lower Leg at 1.5 T. Magnetic Resonance in Medicine 2011;65(4):1119-1125.
4. Cao P, Fan SJ, Wang AM, Xie VB, Qiao Z, Brittenham GM, Wu EX. Diffusion magnetic resonance monitors intramyocellular lipid droplet size in vivo. Magn Reson Med 2015;73(1):59-69.
5. Verma SK, Nagashima K, Yaligar J, Michael N, Lee SS, Xianfeng T, Gopalan V, Sadananthan SA, Anantharaj R, Velan SS. Differentiating brown and white adipose tissues by high-resolution diffusion NMR spectroscopy. J Lipid Res 2017;58(1):289-298.
6. Reese TG, Heid O, Weisskoff RM, Wedeen VJ. Reduction of eddy-current-induced distortion in diffusion MRI using a twice-refocused spin echo. Magn Reson Med 2003;49(1):177-182.
7. Anderson. Analysis and correction of motion artifacts in diffusion weighted imaging. Magn Reson Med 1994;32(3):379-387.
8. Hiltunen J, Hari R, Jousmaki V, Muller K, Sepponen R, Joensuu R. Quantification of mechanical vibration during diffusion tensor imaging at 3 T. Neuroimage 2006;32(1):93-103.
9. Gallichan D, Robson MD, Bartsch A, Miller KL. TREMR: Table-resonance elastography with MR. Magn Reson Med 2009;62(3):815-821.
10. Weidlich D. RS, Cervantes B., Hock A., Karampinos, D. C. ADC quantification of lipids with high b-value stimulated echo-prepared diffusion- weighted 2D single shot TSE. 2018; Paris, France. p 2511.
Figures
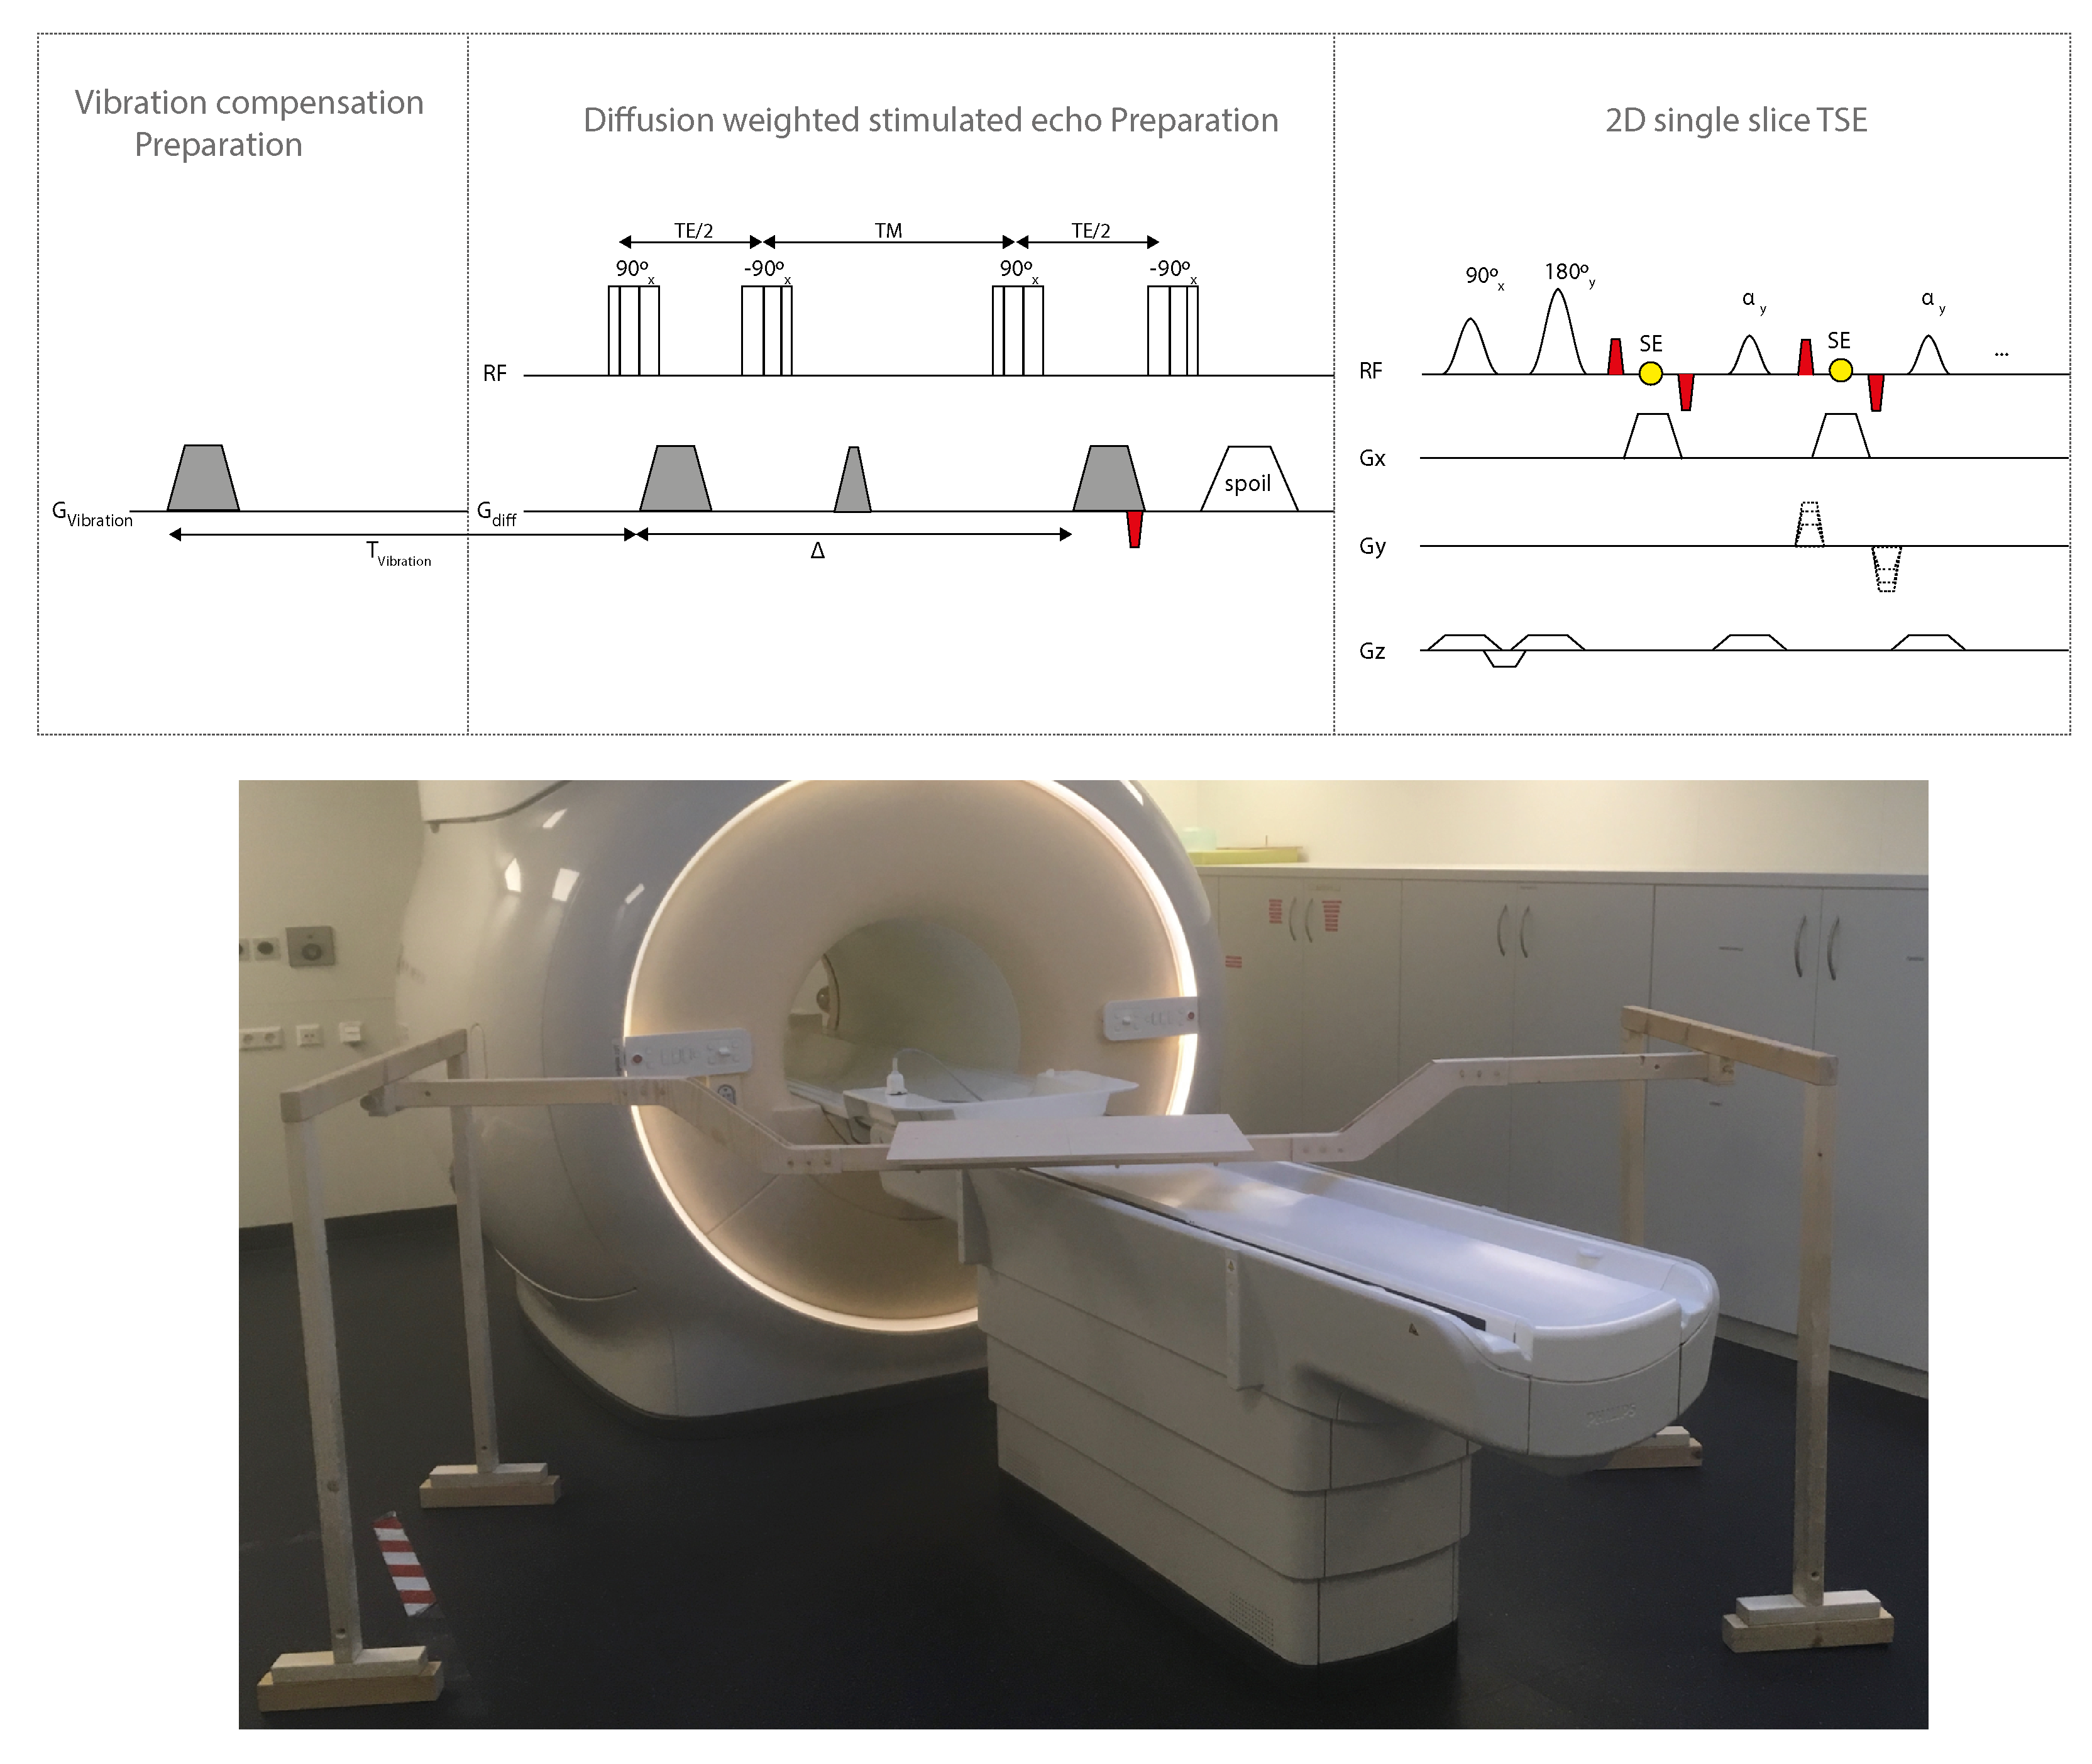
Figure 1:
Sequence diagram of the proposed DW-STE-prepared single-shot 2D TSE with vibration compensation gradient (upper row). The DW-STE magnetization preparation consists of four 90° RF pulses and mono-polar diffusion sensitizing gradients. To eliminate motion-induced phase errors an additional pair of de-/rephasing gradients (indicated in red) denoted as magnitude stabilizers are introduced before the last tip-up pulse. Magnitude stabilizers are performed immediately before and after every spin echo. A vibration sensitizing preparation was introduced before the diffusion preparation to achieve a similar vibrational pattern in both diffusion sensitizing periods. The bottom row shows the wooden table to eliminate vibration artifacts.
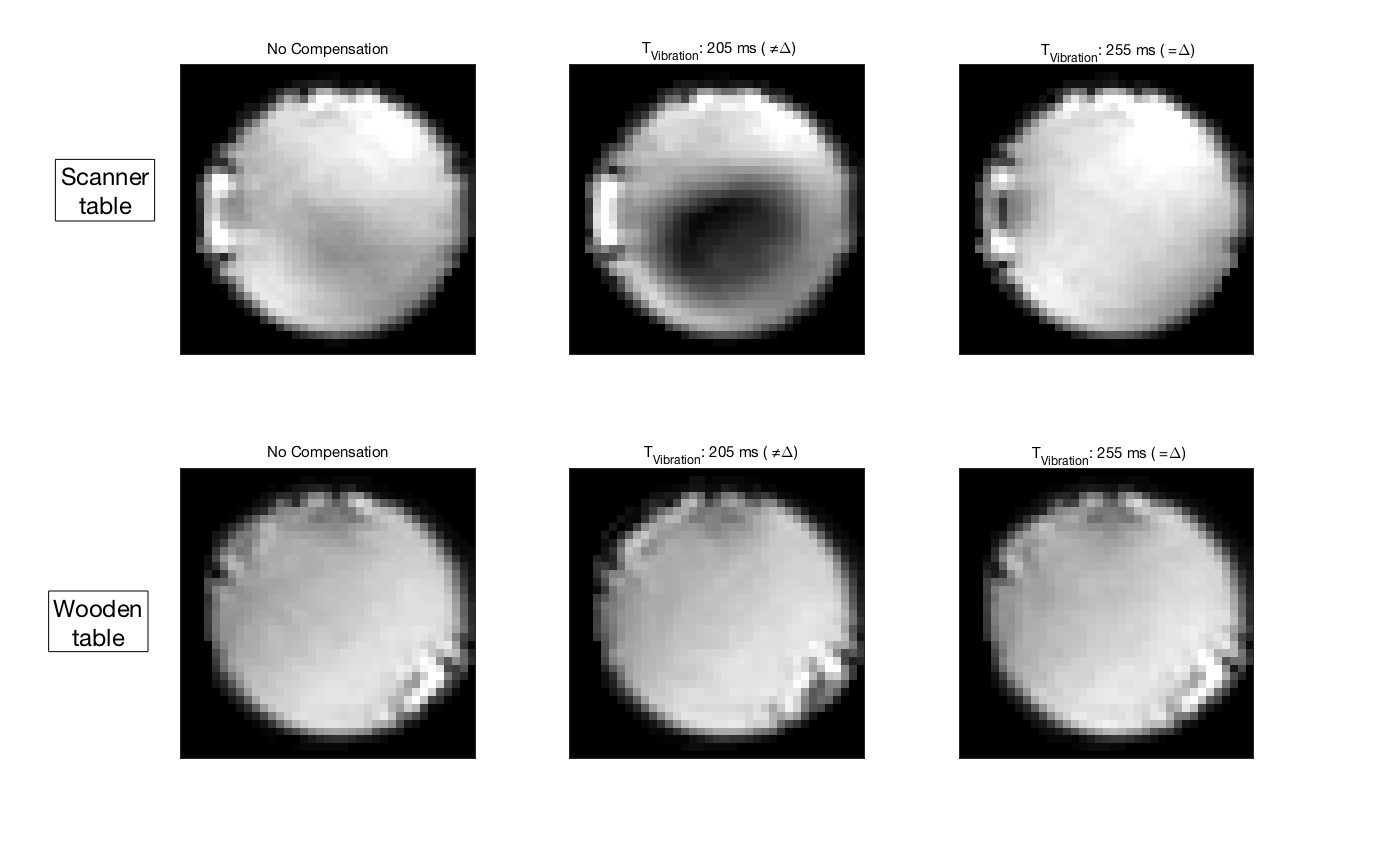
Figure 2:
DW images for different timings between the vibration compensation gradients and the first diffusion gradients acquired on the scanner table (upper row) and the wooden table (bottom row). On the scanner table signal cancellations within the phantom can be observed at certain sequence timings whereas no signal variations are observed on the wooden table.
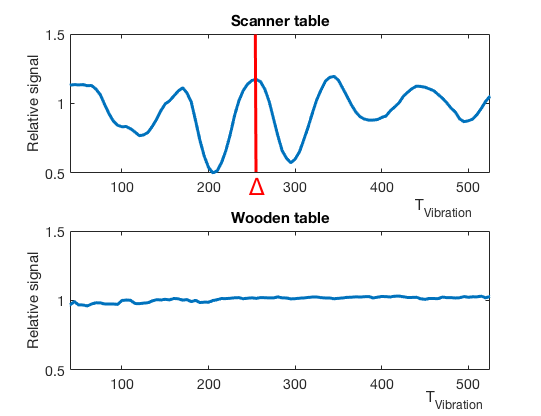
Figure 3:
Mean signal evolution in DW magnitude images at a b-value of 50,000 s/mm2 in water fat phantom for different timings (TVibration) between the vibration compensation gradients and first diffusion sensitizing gradients. A maximum of the signal amplitude (117% of the signal value without compensation) was observed exactly at the diffusion time (Δ). That corresponds to a time interval between the vibration compensation gradients and the first diffusion gradients that is equal to the time interval between the first and second diffusion gradients.
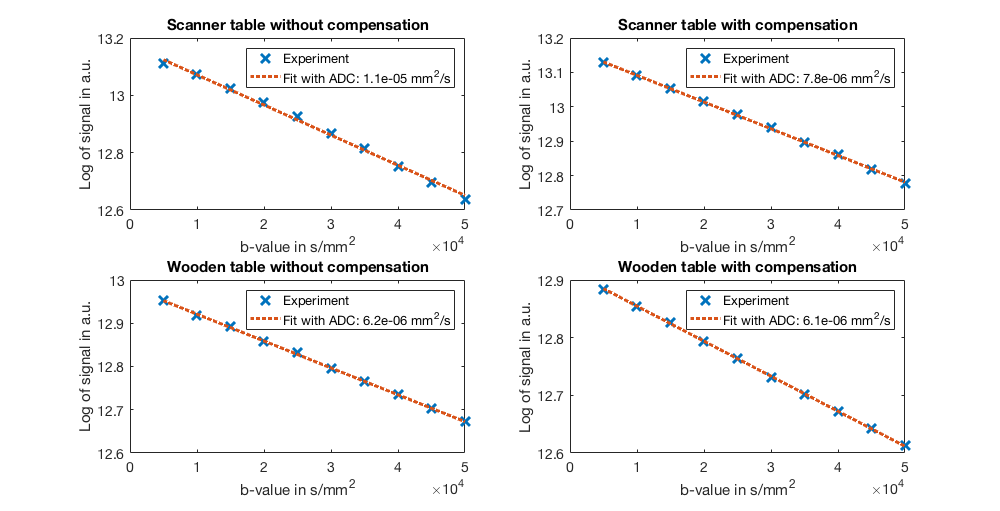
Figure 4:
Measured signal decay curves and mean ADC values on scanner table and wooden table without (a and c) and with (b and d) the vibration compensation gradients. ADC values were 70% higher when comparing the measurements performed on the scanner table with the wooden support table without any compensation. When the vibration compensation gradients were employed a 25% higher ADC value was measured. Only minor differences (2%) were observed on the wooden table with and without vibration compensation gradients.
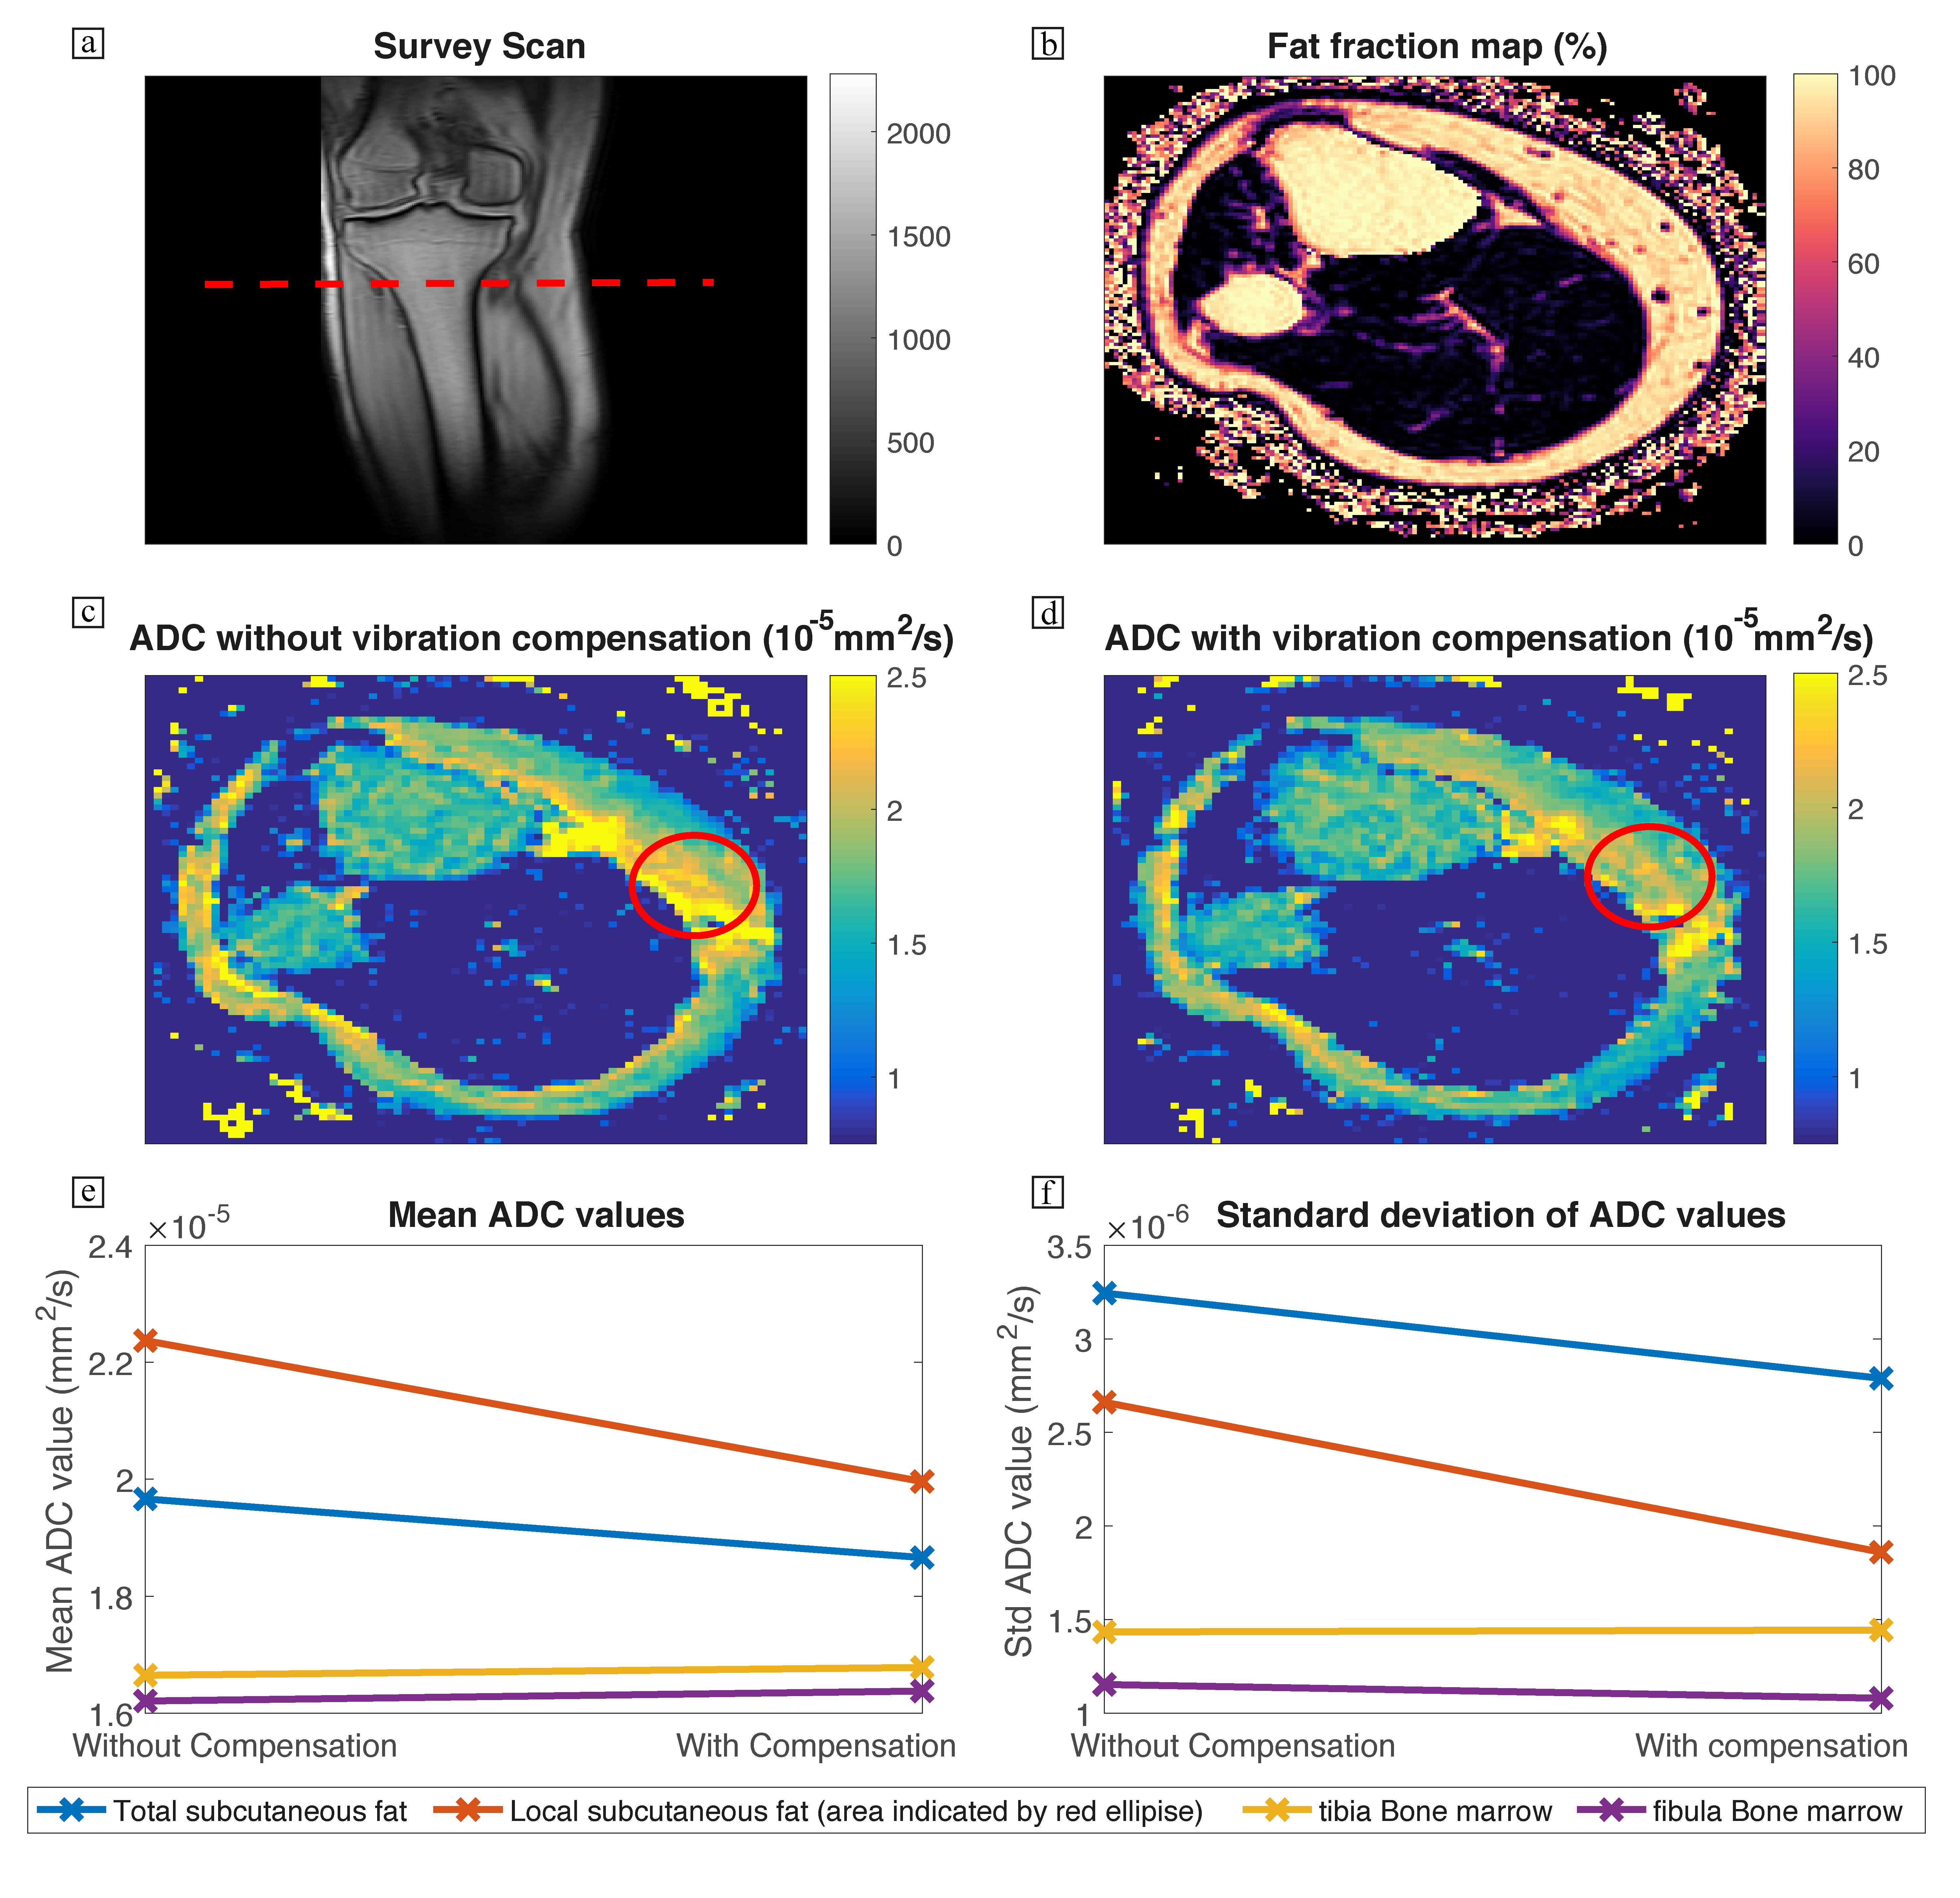
Figure 5:
(a) shows the location of the 2D slice and (b) the corresponding fat fraction map. The ADC map is shown without (c) and with (d) compensation. A more homogenous ADC value in the subcutaneous fat is observed with the vibration compensation. In (e) the mean ADC value and in (f) the corresponding standard deviation are shown for different segmented regions. In the subcutaneous fat, a global and local (in the indicated red ellipse) decrease in the ADC value and standard deviation is observed, whereas the values stay nearly constant for the more rigid region of the tibia and fibula bone marrow.