3387
Spatial Normalization of Fiber Orientation Distribution (FOD) Maps using Mrtrix and an Image-based Non-uniform Gradient Method1Center for Biomedical Imaging (CBI), Department of Radiology, New York University School of Medicine, New York, NY, United States
Synopsis
Diffusion MRI based fiber orientation distribution (FOD) estimates are widely used to examine structural connectivity in the brain. For group comparison using nonlinear spatial normalization, FOD needs to be adjusted based on the estimated degree of rotation and scaling at each voxel. We compared the current method implemented in Mrtrix for spatial normalization of FODs with an image-based method. The results suggest that the method in Mrtrix is accurate for rotation but generates potential bias in FOD peak amplitude and orientation when large anisotropic scaling is present. This knowledge is important for studies to use spatially normalized FOD maps.
Introduction
Fiber orientation distribution (FOD) estimated from diffusion MRI data provides critical information on structural connectivity in the brain [1,2,3]. For group comparison, spatially normalize that maps individual subject images to a common template for voxel-based analysis results in varying degrees of rotation and scaling at each voxel, which requires adjusting the orientation of FODs accordingly [4]. Currently, spatial normalization of FOD data can be performed using MRtrix [5,6,7]. It samples a given FOD with a set of vectors equally distributed over a sphere and, by reorienting the set of vectors based on local linear approximation of the mapping, reconstructs a new FOD followed by amplitude corrections to remove negative peaks. The accuracy of FOD mapping using this method, however, has not been investigated in details. In this study, we compared the FOD normalization method implemented in MRtrix 3.0 with an image-based approach. In our approach, diffusion MRI data are first mapped to the template, reorient the originally uniform gradient table at each pixel to generate a non-uniform gradient table, and perform FOD estimation. We compared the outcomes of the two methods using data from the human connectome project (HCP) datasets under several scenarios (rotation, scaling, and nonlinear normalization) to investigate the accuracy of the two methods.Method
We selected 9 subject data from the HCP dataset to compare the two FOD mapping methods with rotation (5, 15, and 30 degrees), scaling (1.1, 1.5, and 2 times along the left-right axis), and nonlinear image mapping. To remove the effects of interpolation, nearest neighbor interpolation was used in all experiments. Fractional anisotropy (FA) and mean DWI from the original data were used to generate a mapping between subject and template data. The template was selected from one of the HCP datasets. We then use the mapping to transform all DWI data to the template space. We calculated the Jacobian matrix at each voxel from the mapping and used it as a linear approximation of image deformation. Instead of using the Jacobian matrix to reorient FODs as in MRtrix [5], we used it to reorient diffusion gradient table as.
v'i=Tvi Eq. 1
Where vi is the ¡ th gradient corresponding to the ¡ th diffusion encoding vector, T is the Jacobian matrix, and v'i is the output diffusion encoding vector. We then performed FOD fitting with transformed diffusion weighted imaging and adjusted gradient table voxel by voxel.
For the experiments with rotation and scaling, we estimated the ground truth FODs based on the degree of rotation and scaling. For nonlinear image mapping, we compared the differences in FOD peak direction and amplitude between FOD data generated from the two methods.
Results
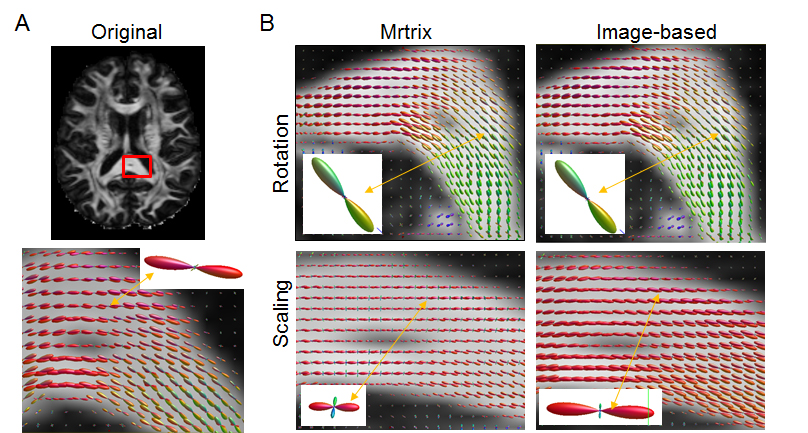
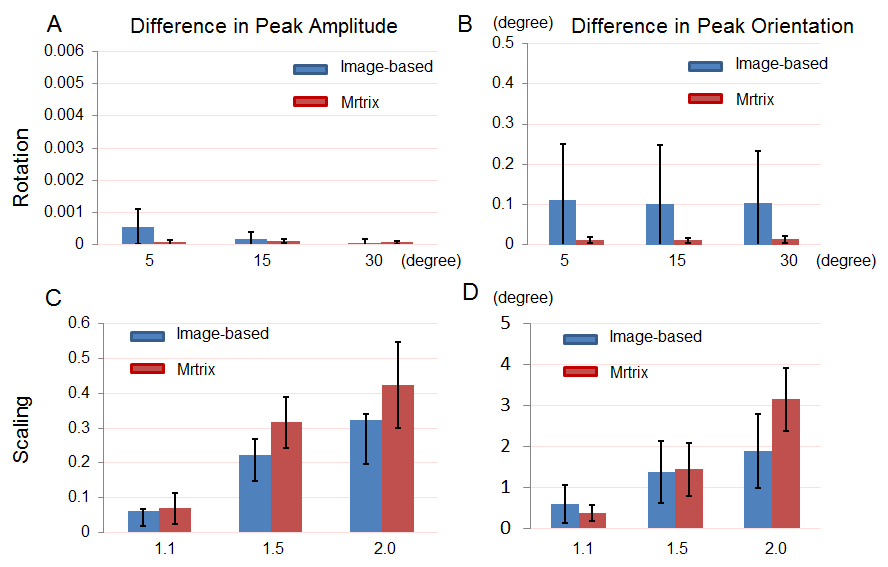
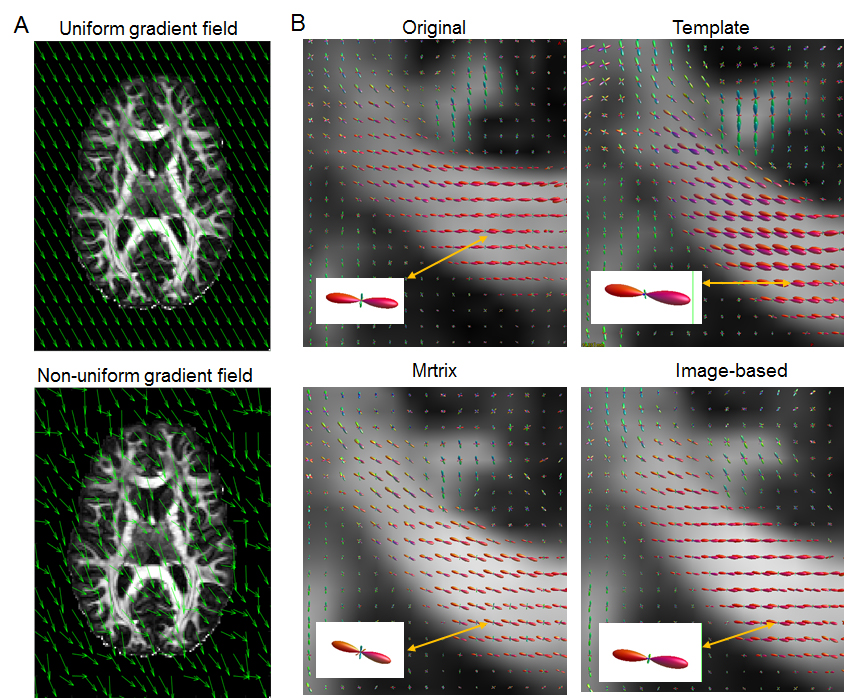
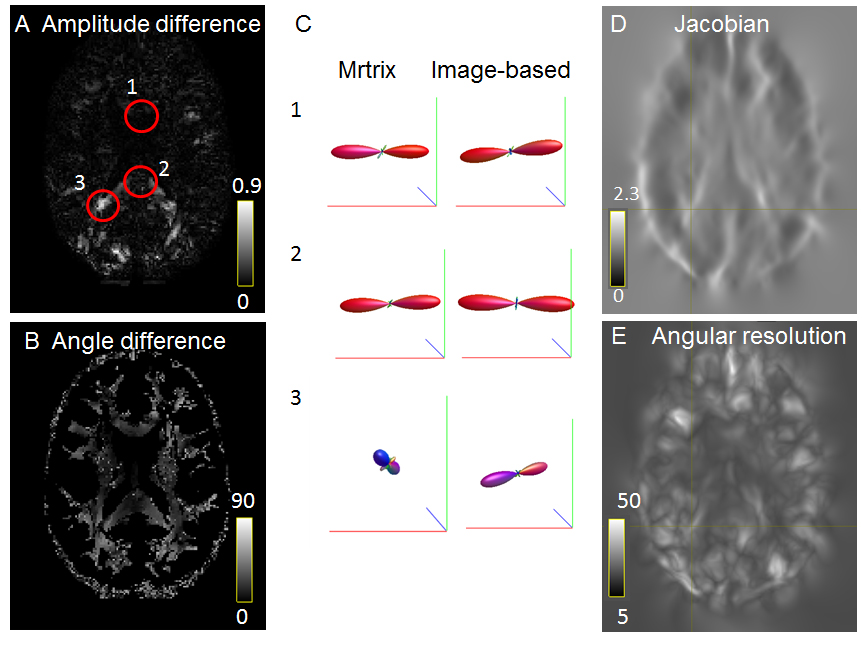
Fig. 1 compares FODs reconstructed using MRtrix and image-based method. After rotation, the reoriented FODs from both methods showed minimal difference from ground truth (Fig. 2A-B). After scaling along the left-right direction, the MRtrix results showed more deviations from the ground truth in terms of peak orientation and amplitude (Fig. 2C-D). In some cases, the orientated FOD from MRtrix showed reduced FOD amplitude along the peak direction and enlarged secondary lobe compared to image-based method produced FOD and the original FODs (Fig. 1B). Fig.3A shows an example of uniform gradient vector fields compared to non-uniform gradient vector fields due to spatial normalization used in the image-based method. Fig. 3B compares the reconstructed FODs from the template and subject data as well as transformed FOD maps using the two methods. Differences in peak amplitude and orientation can be appreciated in the corpus callosum. Large differences in peak amplitude and orientation between the two methods were found in several regions (e.g. region 3 in Fig. 4A-B) and mostly in regions with large deformation (measured using the Jacobian determinant, Fig. 4D).Discussion
In this study, the image-based method used non-uniform gradient tables to estimate FODs, which should provide accurate results. The results suggest that both methods can re-orient FOD after image rotation accurately. For mapping involves large anisotropic scaling, the results from MRtrix can differ from the results from the image-based methods. The image-based method, however, has a much higher computational cost than the method implemented in MRtrix and requires original diffusion MRI data. It is therefore important to understand the potential FOD alterations using MRtrix when there is major anisotropic scaling in the spatial normalization process.Conclusion
When using the method implemented in MRtrix to transform FOD maps, it is important to consider the potential alterations in FOD peak amplitude and orientation due to anisotropic scaling in the image transformation.Acknowledgements
No acknowledgement found.References
[1]. J.-D. Tournier, F. Calamante, D.G. Gadian, and A. Connelly. Direct estimation of the fiber orientation density function from diffusion-weighted MRI data using spherical deconvolution. NeuroImage 23, pp 1176-1185. (2004).
[2]. J. Tournier, F. Calamante and A. Connelly. Robust determination of the fiber orientation distribution in diffusion MRI: Non-negativity constrained super-resolved spherical deconvolution. NeuroImage 35, pp 1459-1472. (2007).
[3]. K.G. Schilling, V. Janve, Y. Gao, I. Stepniewska and B.A. Landman et al. Histological validation of diffusion MRI fiber orientation distributions and dispersion. NeuroImage 165, pp 200-221 (2018).
[4]. X. Hong, L. R. Arlinghaus and A.W. Anderson. Spatial normalization of the fiber orientation distribution based on high angular resolution diffusion imaging data. Magnetic Resonance in Medicine 61. Pp. 1520-1527. (2009).
[5]. D. Raffelt, J.D. Tournier, S. Crozier A. Connelly and O. Salvado. Reorientation of fiber orientation distributions using Apodized Point Spread Functions. Magnetic Resonance in Medicine 67, pp. 844-855 (2012).
[6]. D. Raffelt, J.D. Tournier, S. Rose, G.R. Ridgway, and R. Henderson et al. Apparent Fiber Density: A novel measure for the analysis of diffusion-weighted magnetic resonance images. NeuroImage 59. pp. 3976-3994. (2012).
[7]. D. Haffelt, , J.D. Tournier, J. Fripp, S. Crozier and A. Connelly et al. Symmetric diffeomorphic registration of fiber orientation distributions. NeuroImage 56, pp. 1171-1180. (2011).
Figures