3386
Automated Segmentation of the Cortical Boundaries in Native Diffusion Tensor Imaging Space to Measure Anisotropy of the Cerebral Cortex1Biomedical Engineering, University of Alberta, Edmonton, AB, Canada
Synopsis
Diffusion tensor imaging (DTI) can quantify anisotropic diffusion in the cerebral cortex reflecting its microstructural architecture. However, the analysis is usually performed by defining the inner and outer cortical boundaries on 3D T1-weighted images which are then applied to co-registered DTI, but this is prone to registration errors. Here we present an automatic cortical boundary segmentation method applied directly to 1.5 mm isotropic DTI acquired in 6 minutes at 3T. The cortical surfaces derived from DTI alone demonstrate the radial orientation of the primary eigenvector and appropriate FA/MD showing promise for DTI studies of the cortex in neurological disorders.
Purpose
Diffusion tensor imaging (DTI) of the cerebral cortex reveals diffusion anisotropy, albeit less than white matter, and mostly radial orientation of the primary eigenvectors to the cortical surface in adults 1,2. The sensitivity of diffusion to micro-structure has provided insight into cortical development 3. The inner and outer boundaries of the cortex are usually defined on 3D-T1-weighted images and then applied to the co-registered DTI, but this is prone to registration errors given distortion of diffusion images acquired with the typical 2D-EPI. Here we present an automatic cortical boundary segmentation method that is applied directly on the DTI images and maps. This new method is then used to measure fractional anisotropy (FA), mean diffusivity (MD), and radiality of the primary eigenvector across the cortex on whole-brain 1.5 mm isotropic images acquired in a clinically-relevant six minutes at 3T.Methods
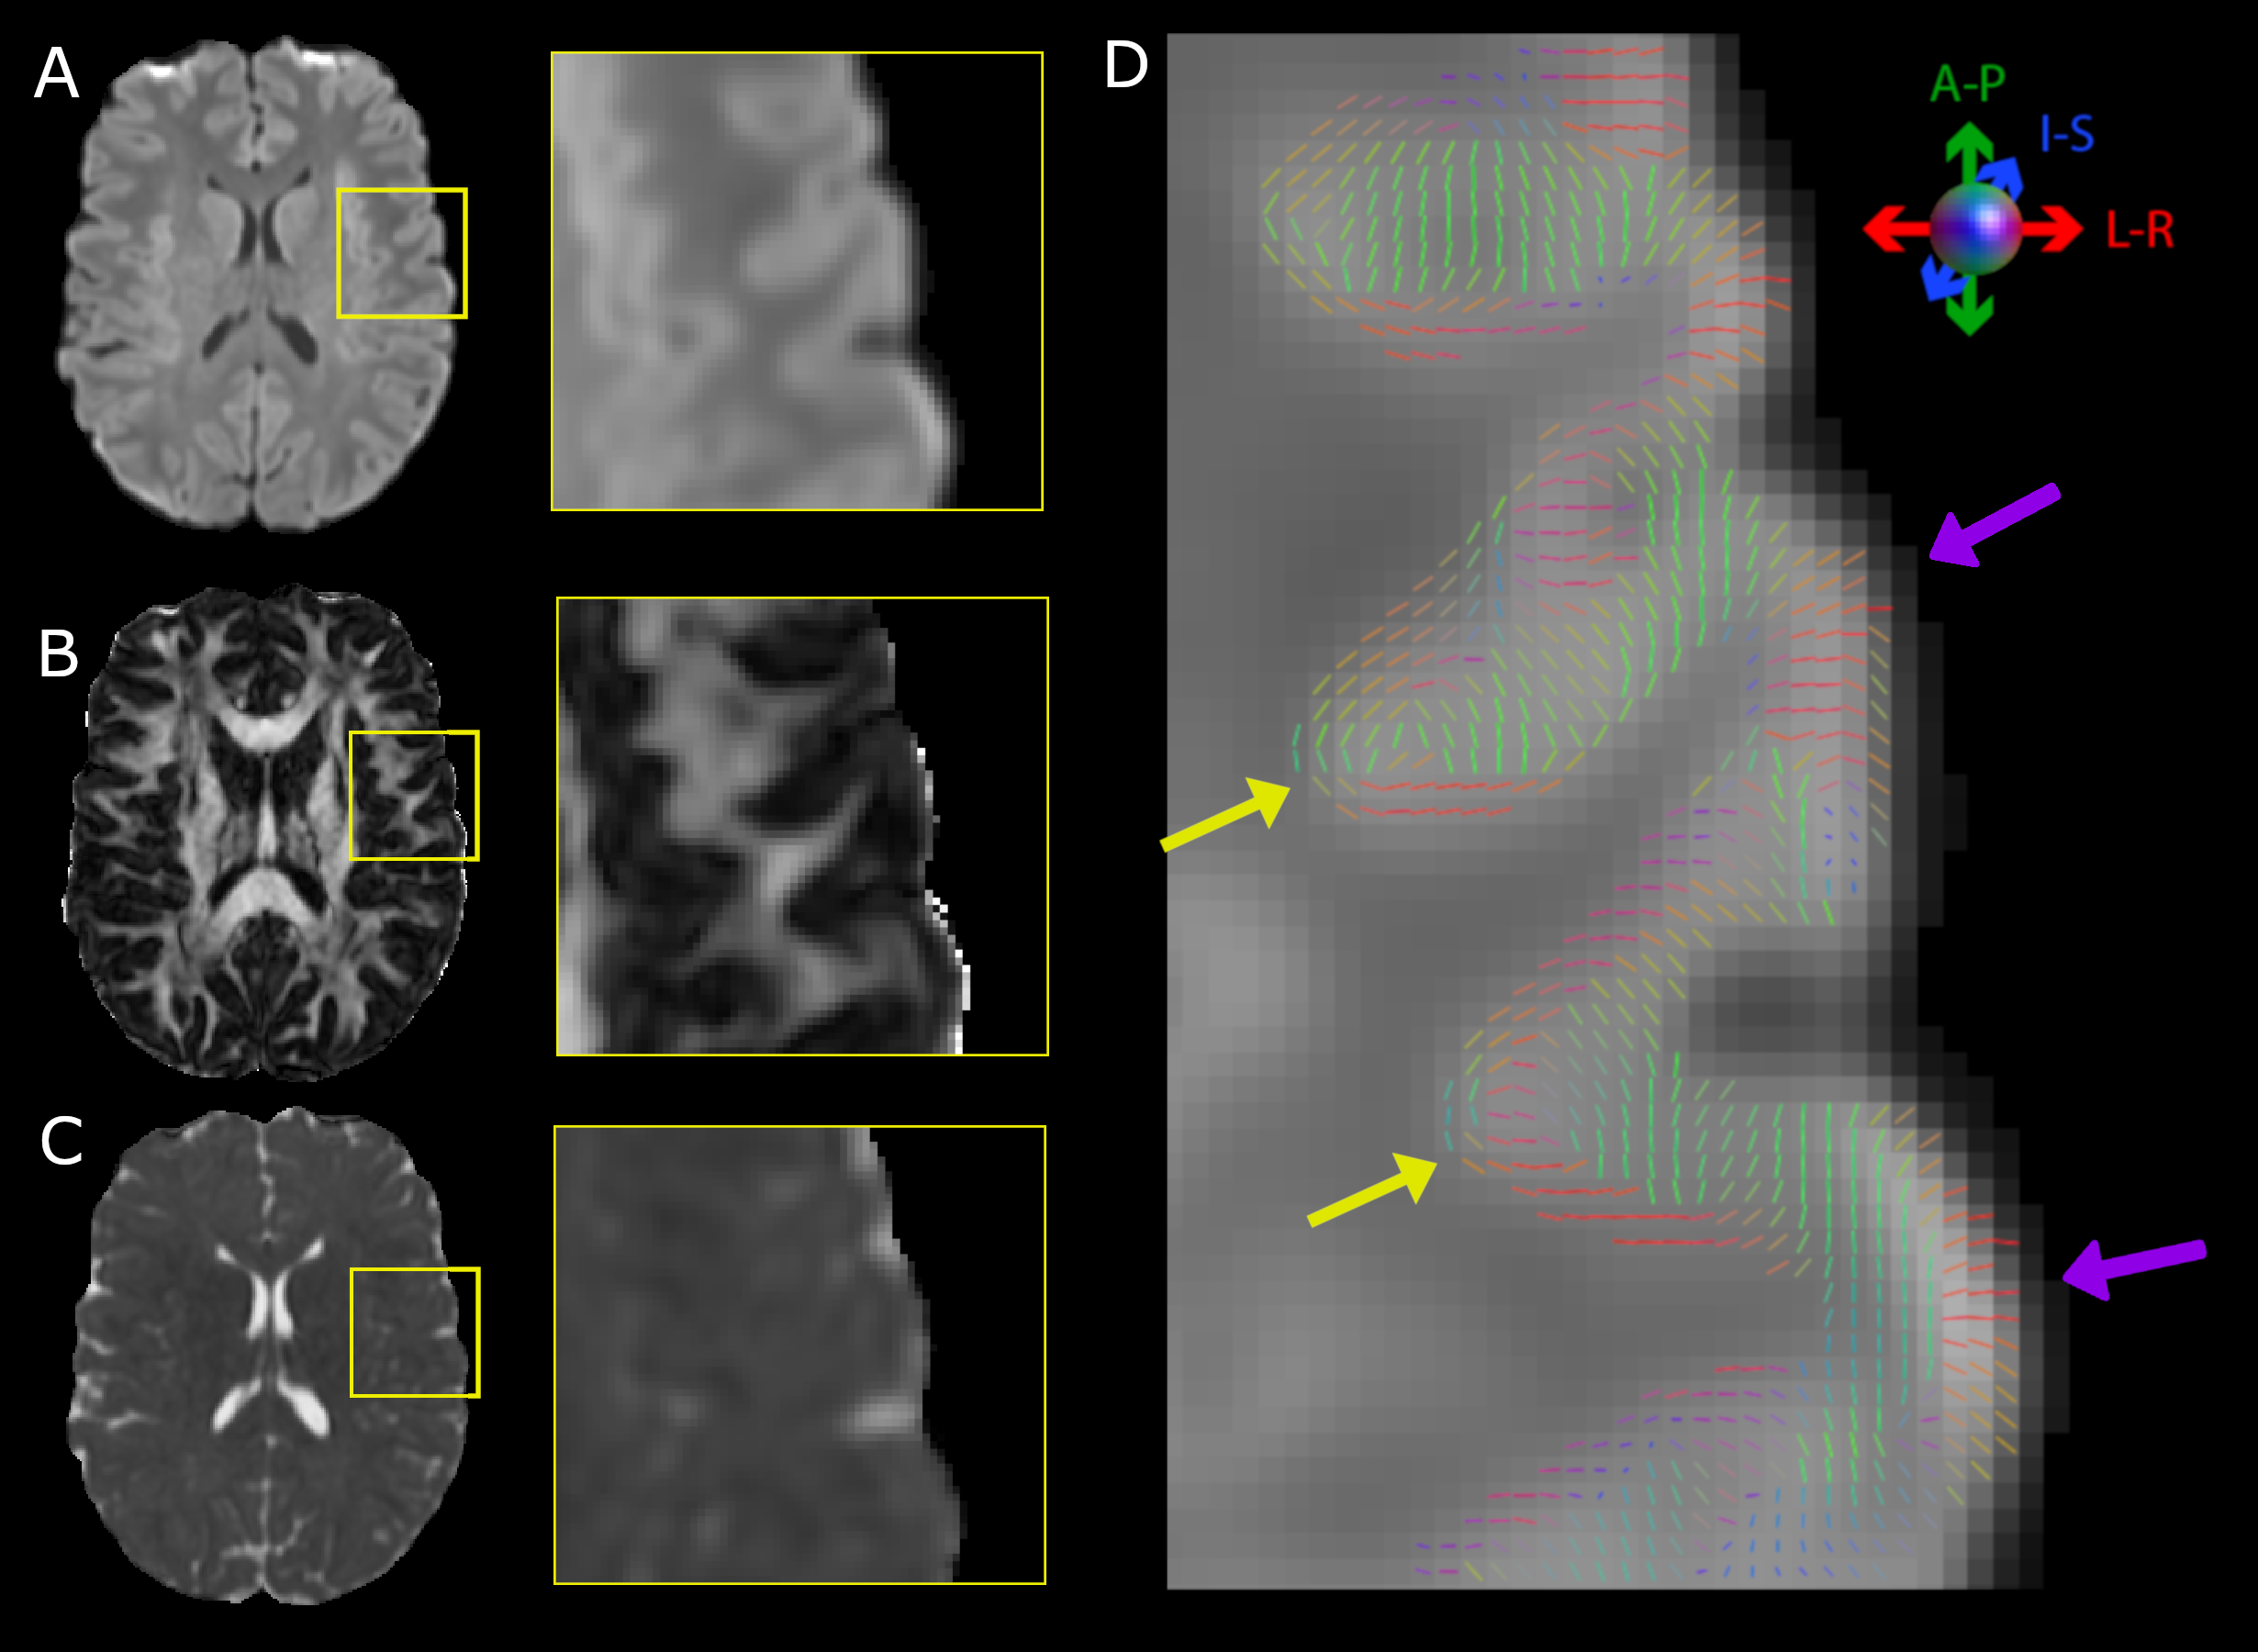
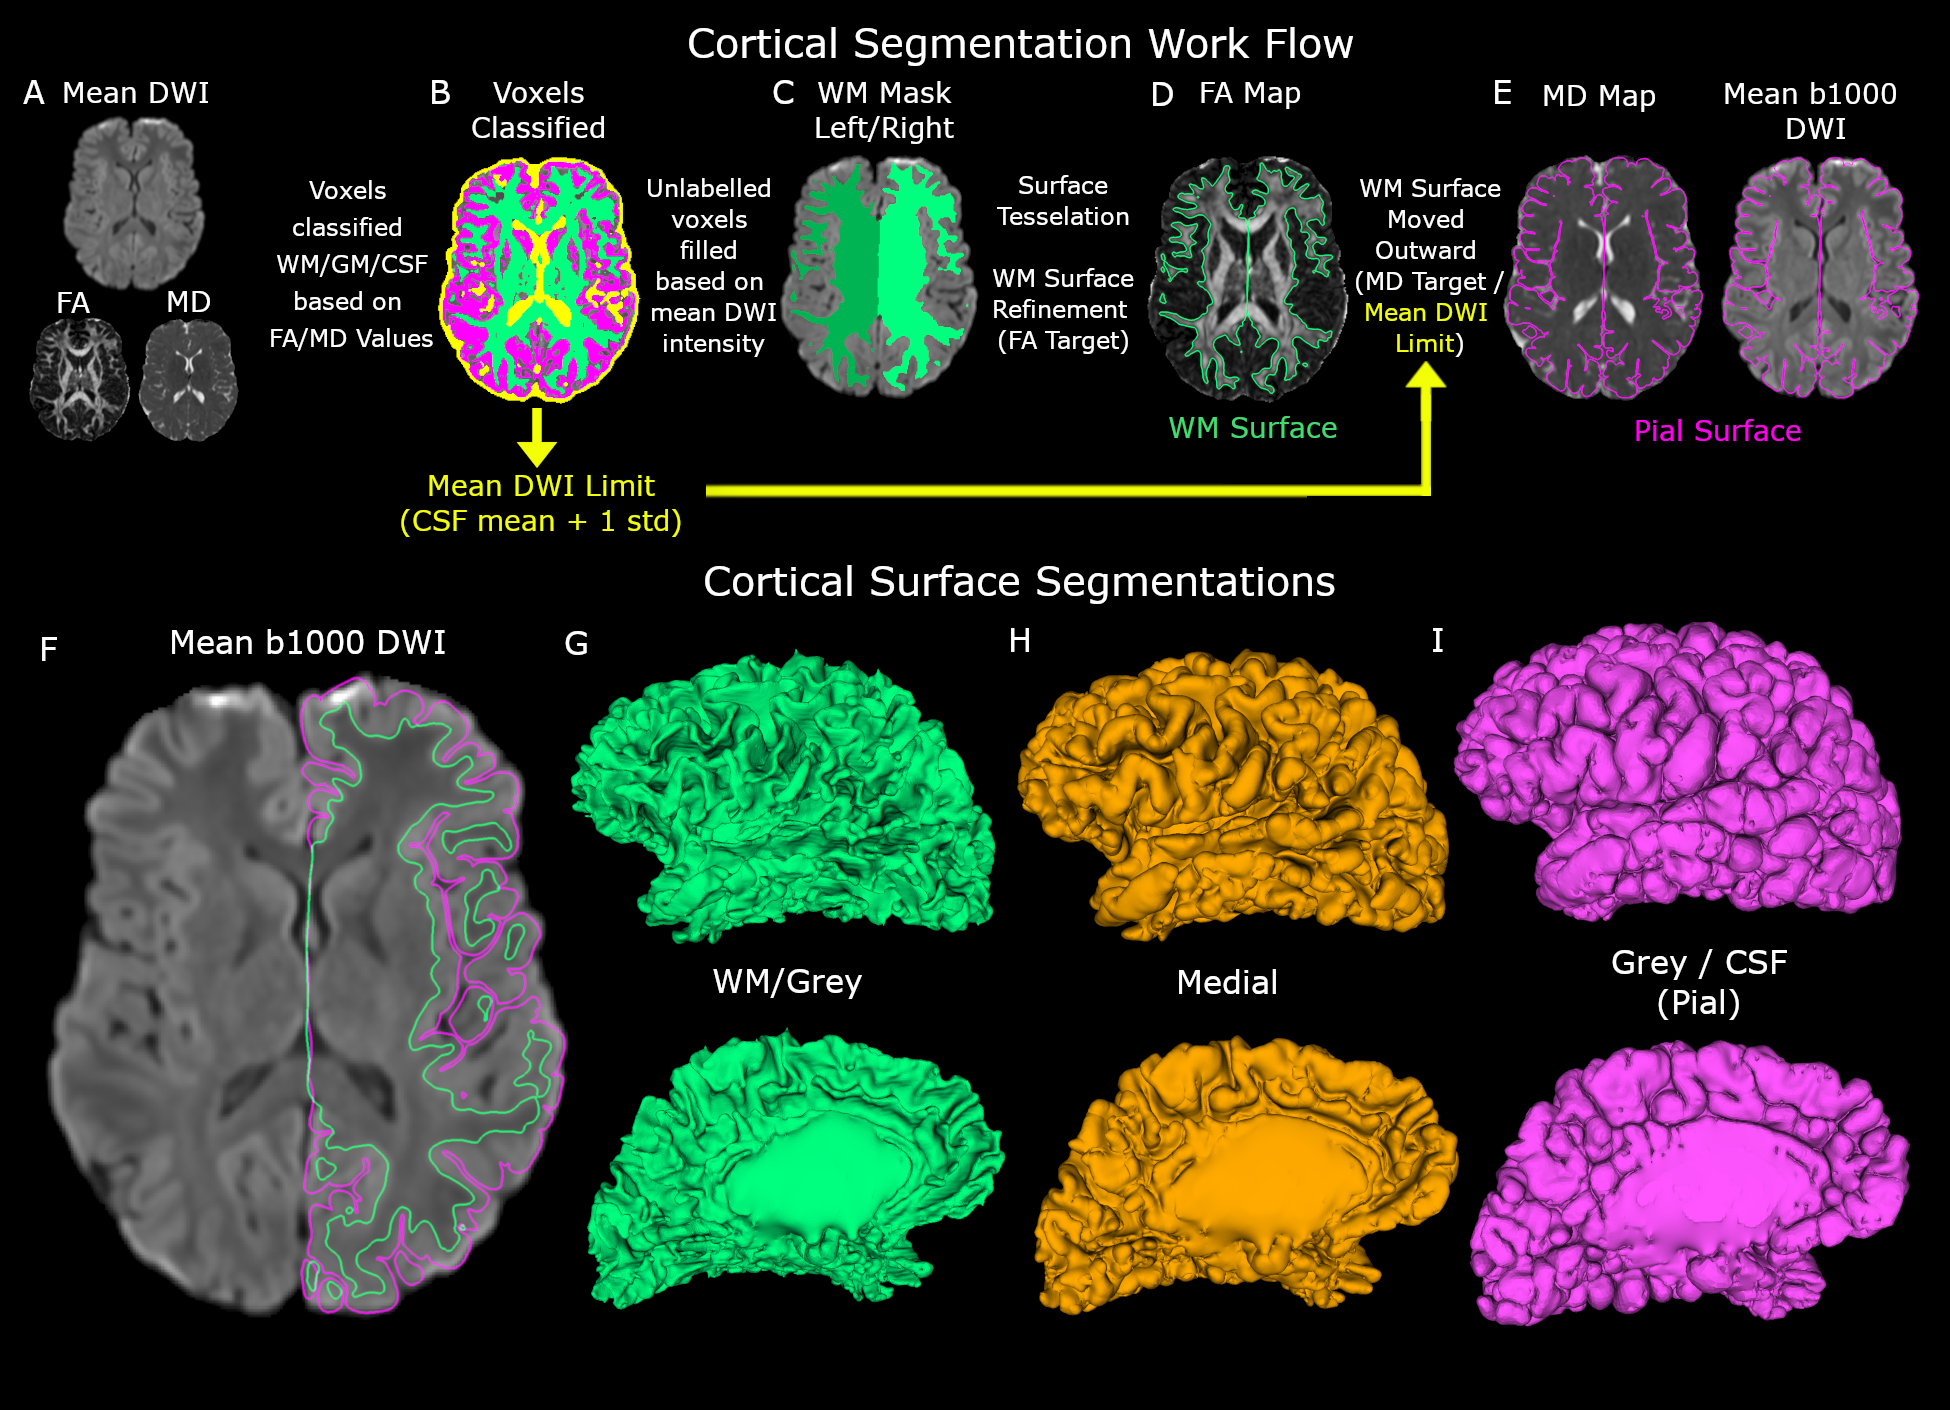
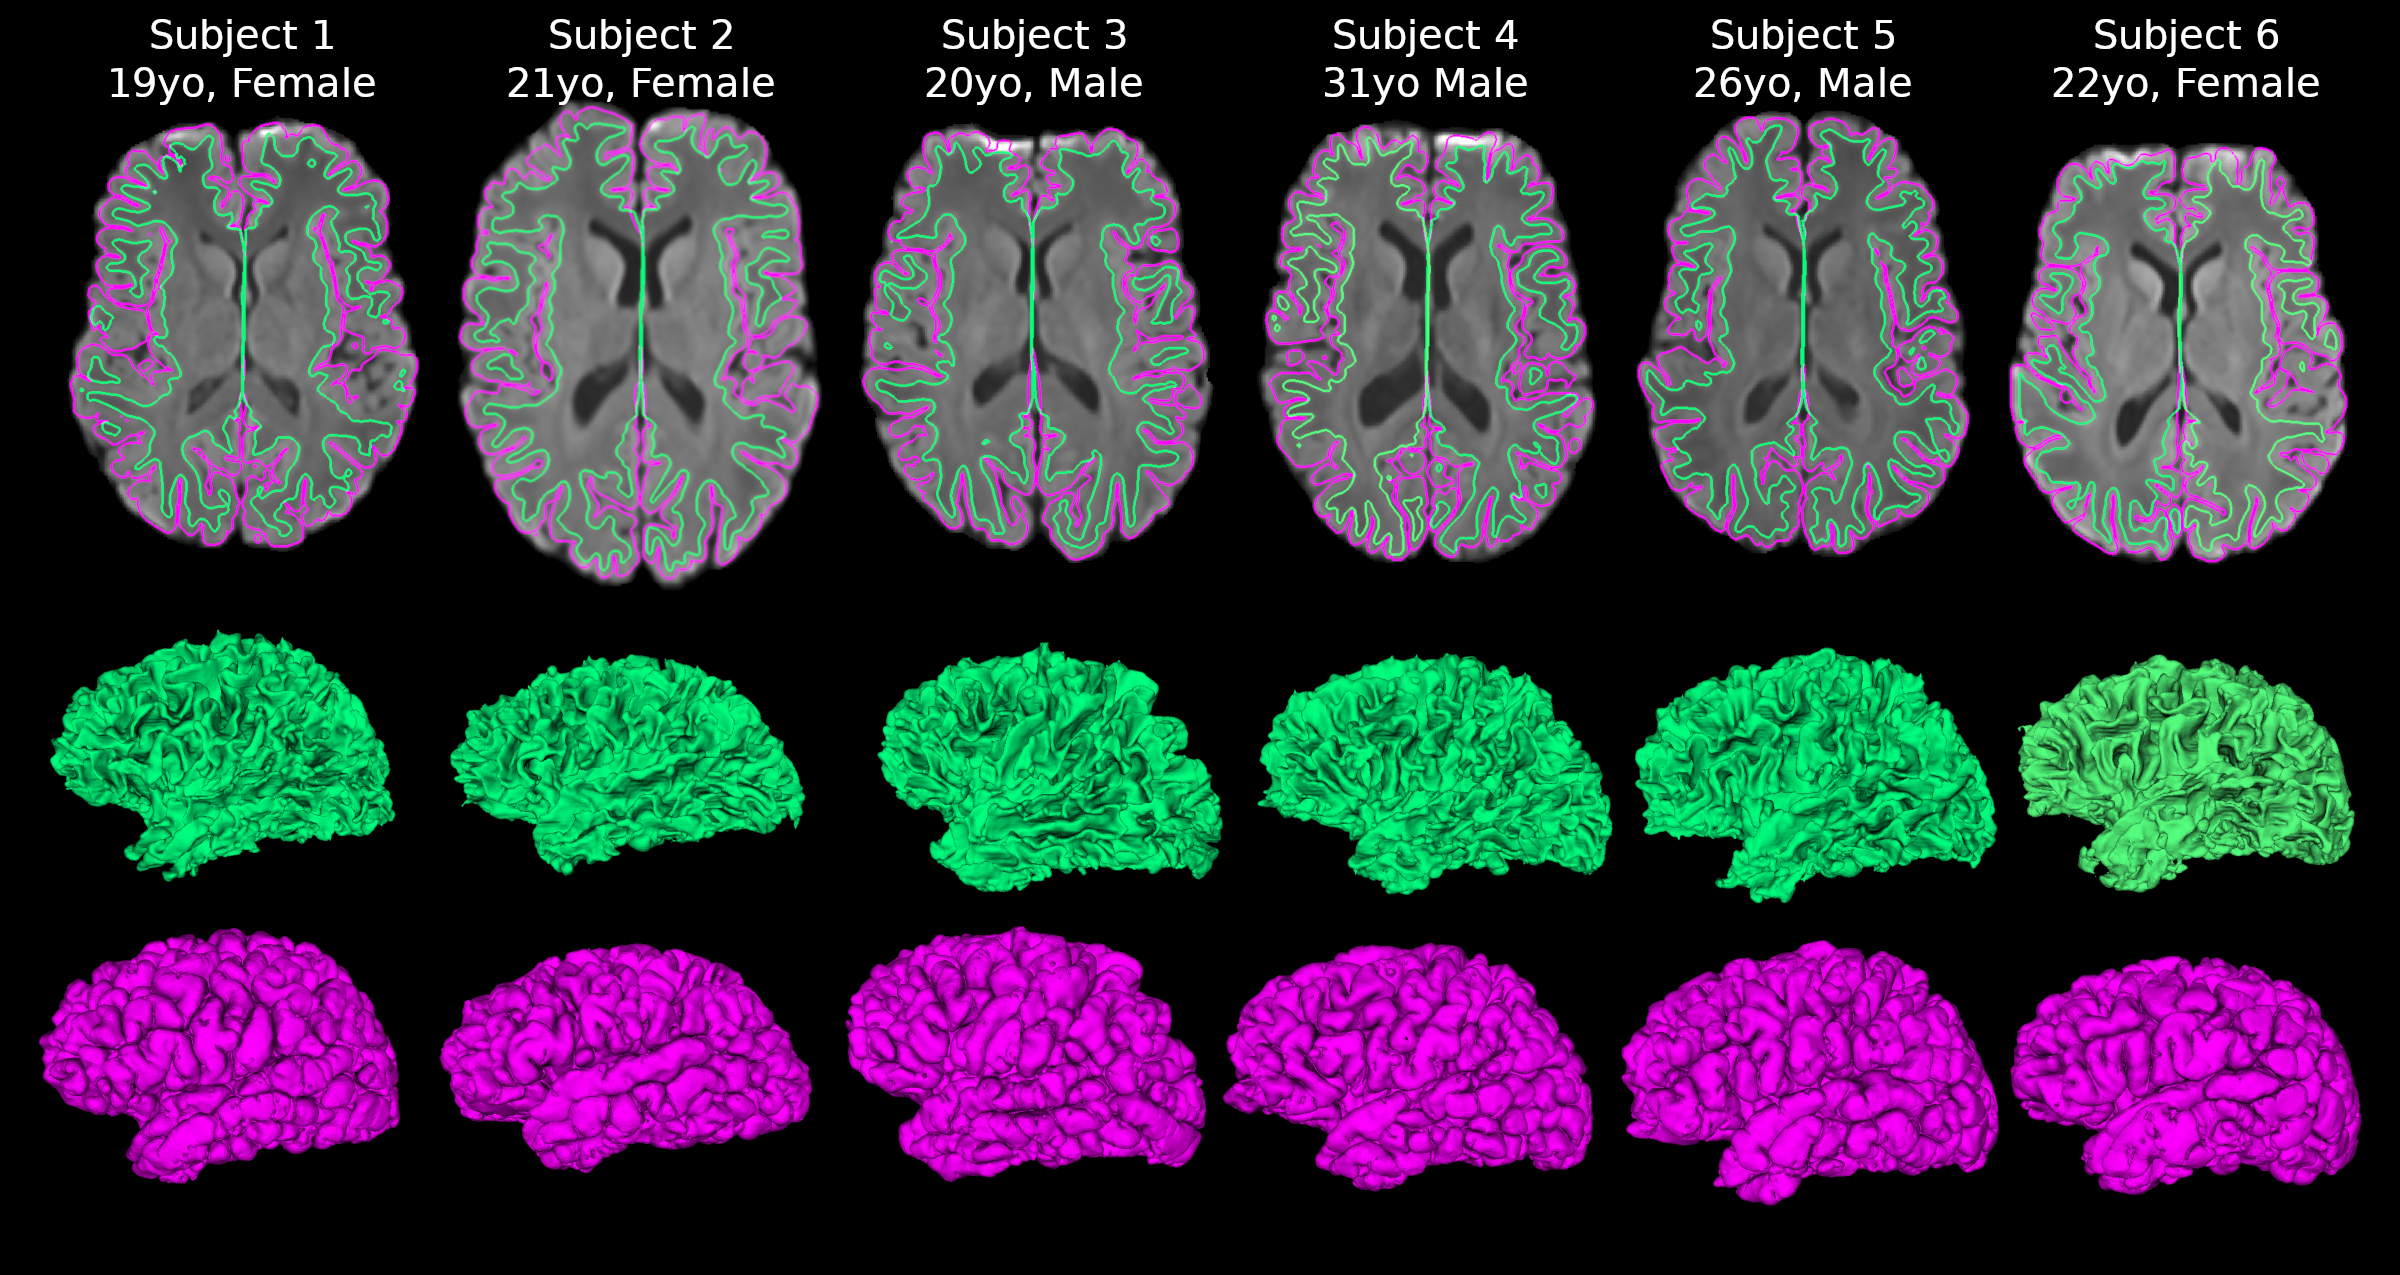
Acquisition / Pre-Processing: Six healthy adult participants (23±4, 19-31 years; 3 females) underwent DTI on a 3T Siemens Prisma (64 channel head coil) with a single-shot EPI spin-echo sequence: multi-band=2, GRAPPA R=2, 6 min scan, 6 b0, 30 b 1000 s/mm2, 30 b2000 s/mm2 (not used here), TR=4700 ms, TE=64 ms, FOV=220 mm, 90 1.5 mm slices with no gap, 1.5x1.5 mm2 zero-filled to 0.75x0.75 mm2 in-plane. The b0 and b1000 images were corrected for Gibbs ringing4, eddy current distortions (FSL v5.0.10), and denoised using adaptive soft coefficient matching5. Tensor models were fit (DIPY v0.14.0) outputting FA, MD, and primary eigenvector maps (Figure 1).
Cortical Segmentation: The flowchart of the proposed method is shown in Figure 2. Voxels were labelled as white matter (FA > 0.25), grey matter (FA = 0.025-0.15 and MD < 1x10⁻³ mm2/s), or cerebrospinal fluid (MD > 1.5x10⁻³ mm2/s). Unlabeled voxels were then labelled using a random walker algorithm with the mean b1000 image outputting a singular cluster of white matter voxels. The Harvard-Oxford subcortical atlas was then registered to native imaging space (FSL v5.0.10) and was used to fill ventricle voxels and split the segmentation into left/right hemisphere masks. Surfaces were generated using the marching cubes algorithm6 outputting a tessellation of ~150,000 vertices per hemisphere.
Typically used cortical segmentation algorithms7,8 on T1-weighted images (not used here) move surface vertices to a target intensity for white/grey matter and grey/CSF (pial) boundaries while constraining the curvature/self-intersection properties of the surface. Here instead diffusion tensor parameter values are used to move vertices to a target FA of 0.2 for the white /grey boundary and move the resulting vertices to a target MD of 1.2x10⁻³ mm2/s while limiting movement past a mean DWI intensity (see Figure 2) for the pial surface. To minimize diffusion measurements from non-cortical voxels, a medial surface was created by finding the half-way point between the inner/outer cortical boundaries along the white matter/cortex surface normal.
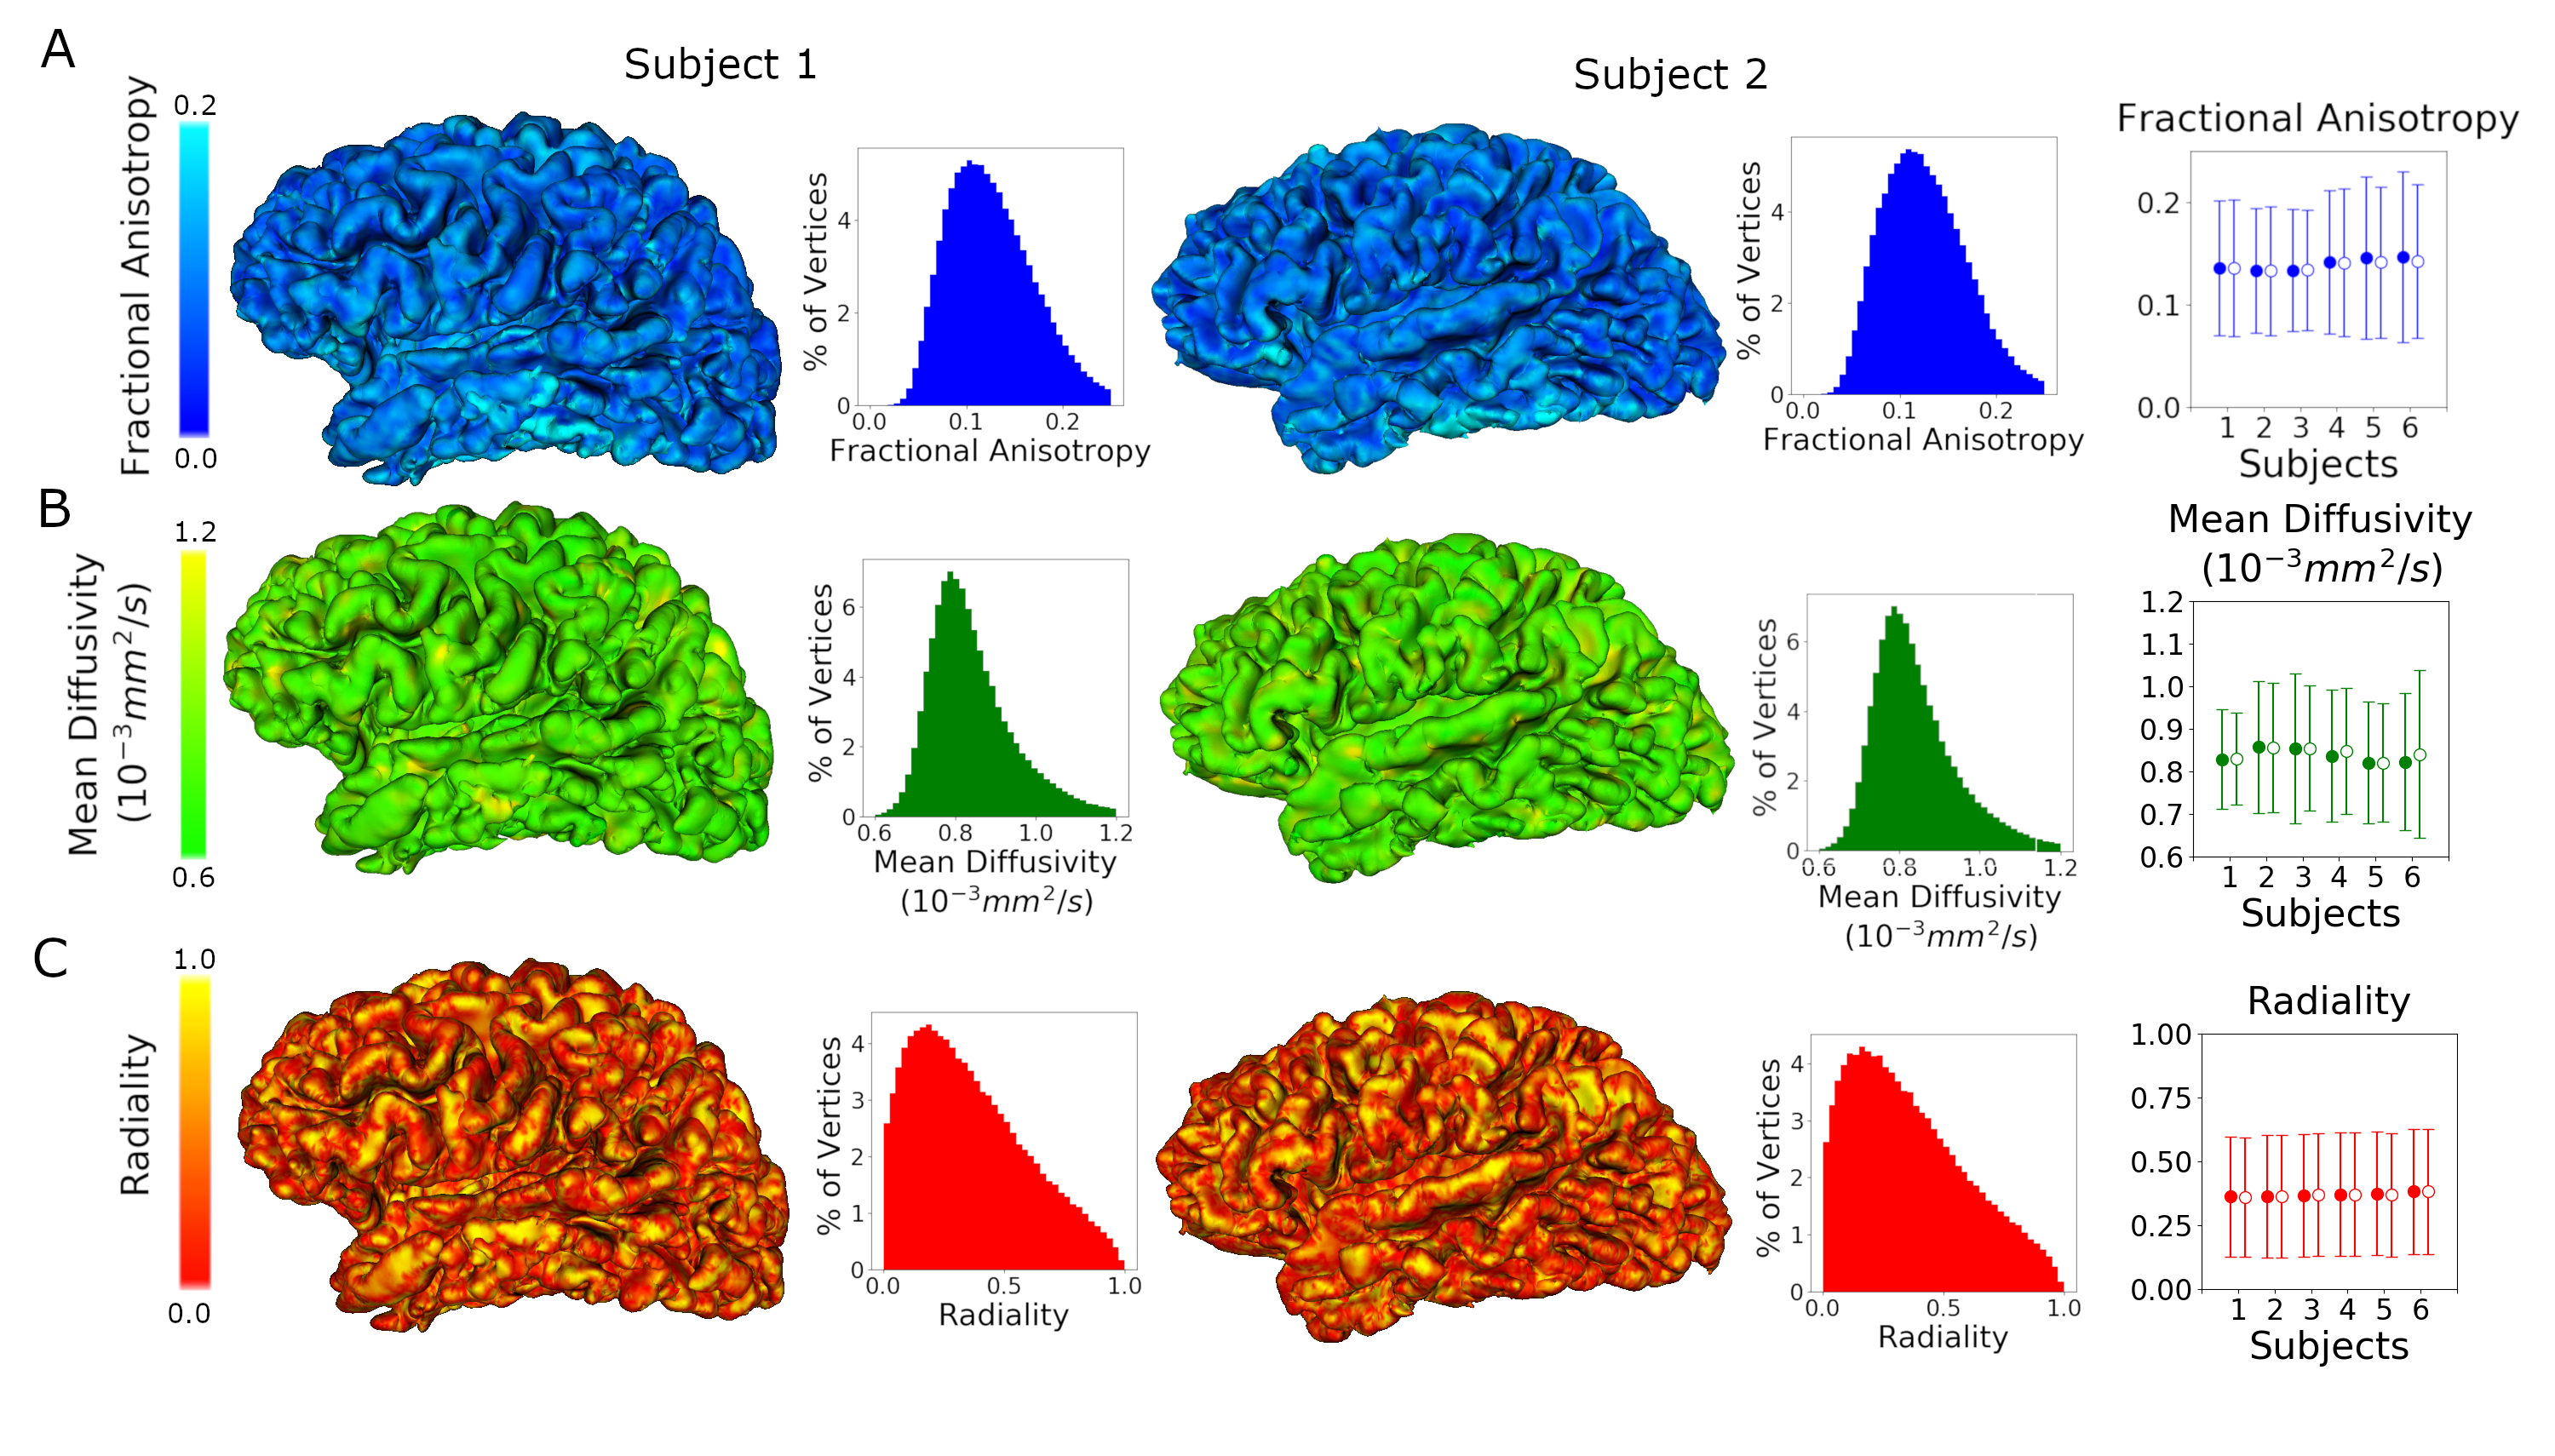
Radiality measures how aligned a tensor is relative to the normal of a surface and is calculated here as the dot product of the white/grey boundary normal and the primary eigenvector interpolated at each medial vertex. In addition, FA and MD values were interpolated onto the medial vertices and FA/MD/radiality values were averaged across each hemisphere (excluding ventricles/white matter) for each participant.
Results and Discussion
The proposed automated cortical segmentation method on DTI images/maps alone yielded accurate surface segmentations of both inner cortical-white matter and outer pial surfaces for all six participants (Figure 3). Example FA, MD, and radiality maps interpolated to the medial surface, their histograms, and their values averaged over the entire cortex (left/right hemispheres) are shown in Figure 4. FA and MD were quite stable across the cortex, but histograms showed peaks of FA ~0.1 and MD ~0.8x10⁻³ mm2/s for the two participants shown. The values averaged across the cortex in each hemisphere showed expected values of FA ~ 0.15 and MD ~ 0.85x10⁻³ mm2/s similar for left and right for all six subjects. A marked increase of radiality was observed on the surfaces in the crowns of the gyrus relative to the sulcal banks/fundus (Figure 4C) in agreement with others1,2. The average radiality here of ~0.35 over the entire cortex is in range of measurements taken at 7T on 1mm isotropic data (~0.3-0.6 over varying sulcal depths)2 and measurements at 3T taken at lower cortical depths1. This study demonstrates the feasibility of cortical diffusion analysis in native diffusion tensor images acquired over the whole brain in six minutes that makes it relevant for future studies in clinical populations.Acknowledgements
This work was funded by the Canadian Institutes of Health Research (CIHR).References
1. J. A. McNab et al. Surface Based Analysis of Diffusion Orientation for Identifying Architectonic Domains in the In Vivo Human Cortex. NeuroImage. 2013;69(1):87-100.
2. M. Kleinnijenhuis, T. van Mourik, D. G. Norris, D. J. Ruiter, A.-M. van Cappellen van Walsum, and M. Barth. Diffusion tensor characteristics of gyrencephaly using high resolution diffusion MRI in vivo at 7T. NeuroImage. 2015;109(1):378-387.
3. C. D. Kroenke. Using diffusion anisotropy to study cerebral cortical gray matter development. J. Magn. Reson. 2018;292(1):106-116.
4. E. Kellner, B. Dhital, V. G. Kiselev, and M. Reisert, Gibbs-ringing artifact removal based on local subvoxel-shifts. Magn. Reson. Med. 2016; 76(5):1574-1581.
5. P. Coupé, J. V. Manjón, M. Robles, and L. D. Collins. Adaptive Multiresolution Non-Local Means Filter for 3D MR Image Denoising. IET Image Process. 2011; 6(5):558-568.
6. T. Lewiner, H. Lopes, A. W. Vieira, and G. Tavares. Efficient Implementation of Marching Cubes’ Cases with Topological Guarantees. J. Graph. Tools. 2003; 8(2):1-15.
7. A. M. Dale, B. Fischl, and M. I. Sereno. Cortical surface-based analysis. I. Segmentation and surface reconstruction. NeuroImage. 1999; 9(2):179-194.
8. J. S. Kim et al. Automated 3-D extraction and evaluation of the inner and outer cortical surfaces using a Laplacian map and partial volume effect classification. NeuroImage. 2005; 27(1):210-221.
Figures