3385
On the regression of intracranial volume in Fixel-Based Analysis1The Florey Institute of Neuroscience and Mental Health, Heidelberg, Australia, 2The Florey Department of Neuroscience and Mental Health, The University of Melbourne, Heidelberg, Australia
Synopsis
Fixel-Based Analysis (FBA) enables robust whole-brain statistical analysis of both microscopic and macroscopic white matter properties that is both sensitive and specific to crossing fibre geometry. Given the influence of macroscopic brain differences in such experiments, interest has been expressed in how best to account for variations in brain volume across participants. Here we demonstrate the effect of brain volume on FBA by synthetically modulating brain sizes within a healthy cohort and statistically testing FBA metrics with various regressions of estimated intracranial volume. We conclude with recommendations for regression of the influence of global brain size differences in FBA when desired.
Introduction
Fixel-Based Analysis (FBA) enables robust whole-brain statistical analysis of both microscopic and macroscopic white matter properties that is both sensitive and specific to crossing fibre geometry1. Given the influence of macroscopic brain differences in such experiments, interest has been expressed in how best to account for variations in brain volume across participants. In particular, the Fibre Cross-section (FC) metric, which quantifies morphological changes orthogonal to the local white matter fibre orientation, may demonstrate a widespread effect that is in fact driven by variations in gross total brain volume; thus it may be desirable within certain contexts to first remove the effect of this global scaling, in order for statistical analysis to be sensitive to local effects only.
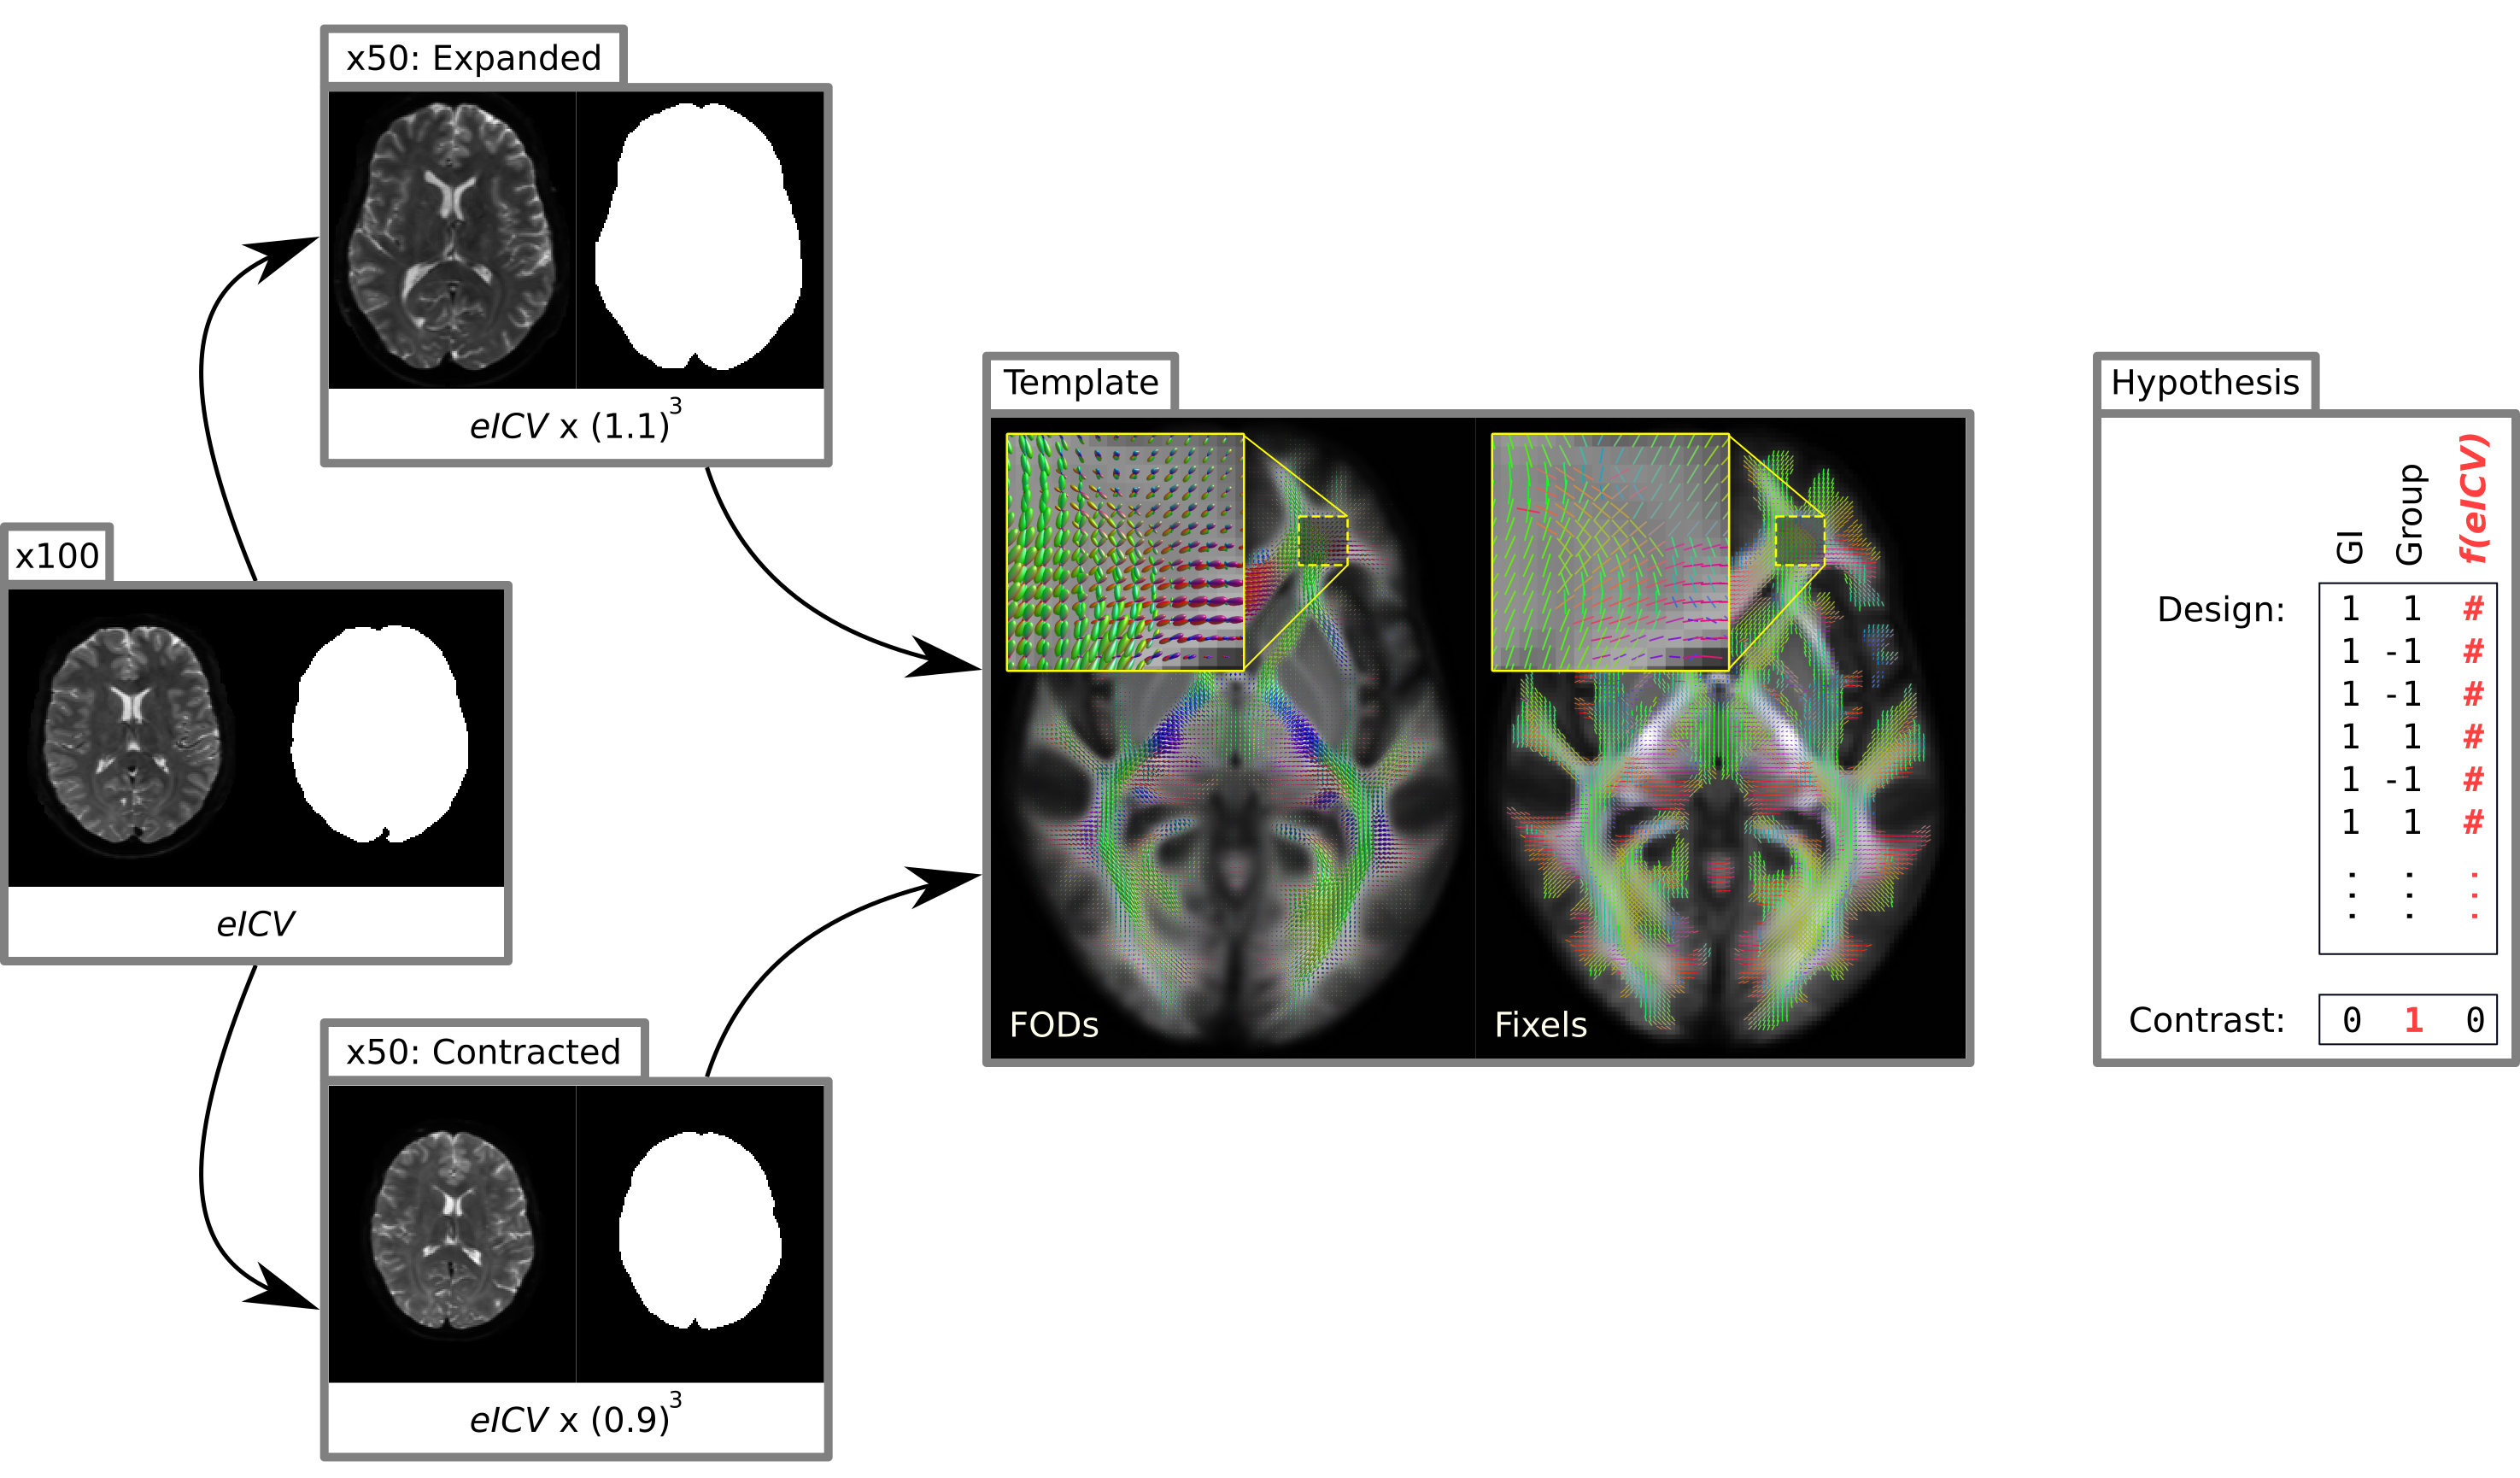
To address this question, we performed an experiment where gross variations in brain size were introduced synthetically. The premise of this experiment is that if the effects of global brain scaling are properly accounted for within the statistical model, based on a scalar estimate of intracranial volume for each subject, then the image data should contain no residual effects of these modulations of brain size following regression of the global scaling effect.
Methods
100 healthy subjects from the Human Connectome Project (HCP) minimally pre-processed data were used2. Subjects were split randomly into “expanded” and “contracted” groups, where the provided DWI and mask images were expanded or contracted by a factor of 10% along each image axis respectively, then re-sampled back onto the original 1.25mm isotropic grid (Figure 1). The estimated intracranial volume (eICV) of each subject was extracted from FreeSurfer processing output3, and modulated appropriately so as to reflect the spatial expansion / contraction of the subject’s DWI data (Figure 1). Processing of this cohort included: multi-shell multi-tissue (MSMT)4 constrained spherical deconvolution (CSD)5 using group-average tissue response functions6,7; multi-tissue intensity normalization8; population-specific Fibre Orientation Distribution (FOD) template generation6 using FOD-based registration9; segmentation of template FODs to define discrete fixels (fibre bundle elements in specific voxels)1; FOD segmentation10 and extraction of subject per-fixel FBA quantitative metrics1; derivation of a template analysis fixel mask based on a combination of fibre density threshold, whole-brain streamlines tractography in template space, and consistency of subject-template fixel correspondence.
For all three conventional FBA metrics (“FD”: an estimate of microscopic Fibre Density; “FC”: the macroscopic modulation of Fibre Cross-section, of which the logarithm is conventionally applied prior to statistical testing; “FDC”: Fibre Density and Cross-section, the product of FD and FC, which provides a combined measure of “the white matter’s capacity to transmit information”)1, we fit the General Linear Model (GLM)11 in each template fixel, incorporating some numerical transformation of the eICV as a nuisance regressor using the Freedman-Lane method12, repeating for different transformations of the eICV. We obtained familywise-error (FWE)-corrected p-values for differences between the expanded and contracted groups using permutation testing11 in each case, and calculated the fraction of fixels in the template for which p<0.05 as a measure of “effectiveness of nuisance regression”. Numerical transformations applied to the eICV values prior to statistical testing included various powers between 0 and 1, and the logarithm transform; tests without the inclusion of eICV as a nuisance regressor were also performed.
Results
Figure 2 presents, for each of the three conventional FBA metrics, the fraction of template fixels for which p<0.05 (i.e. false positives) when different transformations of the subject eICV values were used as nuisance regressors.Discussion / Conclusion
Based both on minimisation of false positives in our experimental results and mathematical derivation, our suggestions for when the regression of intracranial volume is sought in FBA are as follows:
- FD: Unless there is a strong hypothesis that FD will vary across subjects as a function of intracranial volume, we advocate omitting this variable from the design matrix, as the inclusion of non-useful factors within the GLM may lead to false positives.
- FC: Since it is in fact log(FC) that is pre-calculated prior to statistical testing, if FC co-varies with eICV (or some power thereof), then log(FC) is expected to co-vary with log(eICV). Although such regression was not the absolute optimum in our testing, we believe this difference to be within experimental error, and so advocate regressing by log(eICV) in this case.
- FDC: While an initial hypothesis was that regressing by (eICV)1/3 would perform well for this metric (considering brain expansion / contraction as an inflating / deflating sphere, where measurement of FC is akin to the radius being proportional to the cube root of the volume), regression by log(eICV) provided the best empirical performance for this metric.
Acknowledgements
We are grateful to the National Health and Medical Research Council (NHMRC) (400121) of Australia and the Victorian Government’s Operational Infrastructure Support Program for their support.
Data were provided by the Human Connectome Project, WU-Minn Consortium (Principal Investigators: David Van Essen and Kamil Ugurbil; 1U54MH091657) funded by the 16 NIH Institutes and Centers that support the NIH Blueprint for Neuroscience Research; and by the McDonnell Center for Systems Neuroscience at Washington University.
References
- Raffelt, D. A.; Tournier, J.-D.; Smith, R. E.; Vaughan, D. N.; Jackson, G.; Ridgway, G. R. & Connelly, A. Investigating white matter fibre density and morphology using fixel-based analysis. NeuroImage, 2016, 144, 58-73
- Glasser, M. F.; Sotiropoulos, S. N.; Wilson, J. A.; Coalson, T. S.; Fischl, B.; Andersson, J. L.; Xu, J.; Jbabdi, S.; Webster, M.; Polimeni, J. R.; Van Essen, D. C. & Jenkinson, M. The minimal preprocessing pipelines for the Human Connectome Project. NeuroImage, 2013, 80, 105-124
- Fischl, B. FreeSurfer. NeuroImage, 20 years of fMRI, 2012, 62, 774-781
- Jeurissen, B.; Tournier, J.-D.; Dhollander, T.; Connelly, A. & Sijbers, J. Multi-tissue constrained spherical deconvolution for improved analysis of multi-shell diffusion MRI data. NeuroImage, 2014, 103, 411-426
- Tournier, J.-D.; Calamante, F. & Connelly, A. Robust determination of the fibre orientation distribution in diffusion MRI: Non-negativity constrained super-resolved spherical deconvolution. NeuroImage, 2007, 35, 1459-1472
- Raffelt, D.; Tournier, J.-D.; Rose, S.; Ridgway, G. R.; Henderson, R.; Crozier, S.; Salvado, O. & Connelly, A. Apparent Fibre Density: A novel measure for the analysis of diffusion-weighted magnetic resonance images. NeuroImage, 2012, 59, 3976-3994
- Dhollander, T.; Raffelt, D. & Connelly, A. Unsupervised 3-tissue response function estimation from single-shell or multi-shell diffusion MR data without a co-registered T1 image. ISMRM Workshop on Breaking the Barriers of Diffusion MRI, 2016, 5
- Raffelt, D.; Dhollander, T.; Tournier, J.-D.; Tabbara, R.; Smith, R. E.; Pierre, E. & Connelly, A. Bias Field Correction and Intensity Normalisation for Quantitative Analysis of Apparent Fibre Density. Proceedings of the ISMRM, 2017, 3541
- Raffelt, D.; Tournier, J.-D.; Fripp, J.; Crozier, S.; Connelly, A. & Salvado, O. Symmetric diffeomorphic registration of fibre orientation distributions. NeuroImage, 2011, 56, 1171-1180
- Smith, R. E.; Tournier, J.-D.; Calamante, F. & Connelly, A. SIFT: Spherical-deconvolution informed filtering of tractograms. NeuroImage, 2013, 67, 298-312
- Winkler, A. M.; Ridgway, G. R.; Webster, M. A.; Smith, S. M. & Nichols, T. E. Permutation inference for the general linear model. NeuroImage, 2014, 92, 381-397
- Freedman, D. & Lane, D. A Nonstochastic Interpretation of Reported Significance Levels. Journal of Business & Economic Statistics, 1983, 1, 292-298
Figures