3383
A surface-based shape analysis of the human corticospinal tract1Sherbrooke Connectivity Imaging Laboratory (SCIL), Université de Sherbrooke, Sherbrooke, QC, Canada
Synopsis
Traditionally, when examining bundles, comparative methods between measures such as volume, streamline density and mean fractional anisotropy are often used. However, these measures can be biased and do not inform about shape of the white matter bundle. In this work, a new method is proposed to compare bundles based on its surface. Indeed, three measures (area, elongation, irregularity) applied along the cross-sections of the surface enable to highlight shape differences. Here, we illustrate the potential of these surface-based shape measures on the right and the left pyramidal tract in a healthy group of 30 datasets.
Introduction
Conventional comparative studies [1,2,3] use measures such as volume, streamline density and mean fractional anisotropy (FA) to quantify white matter (WM) bundles. As already discussed in [4], such measures can be biased and do not give any shape information about the bundle. Shape analysis is well advanced in other fields, such as Alzheimer’s disease, where the morphology of the hippocampus is well-studied in aging [5]. Some tools already exist to study the shape of white matter, such as a tract-based morphometry, local shape features across the streamlines curves and a framework for shape analysis [6,7,8]. Here, we suggest new, simple and easily-interpretable surface-based shape measures that can be useful to point out differences in shapes of bundles. Three shape measures were computed: i) surface area per section of the bundle quantifying fanning, ii) elongation quantifying the global shape of the convex hull of a closed curve, and iii) irregularity quantifying deformations of a closed curve compared to a perfect circle. These measures were computed to compare the left and right pyramidal tracts (PYT) and better quantify and understand the ‘where’ and ‘how’ these PYT shapes are different.Methods
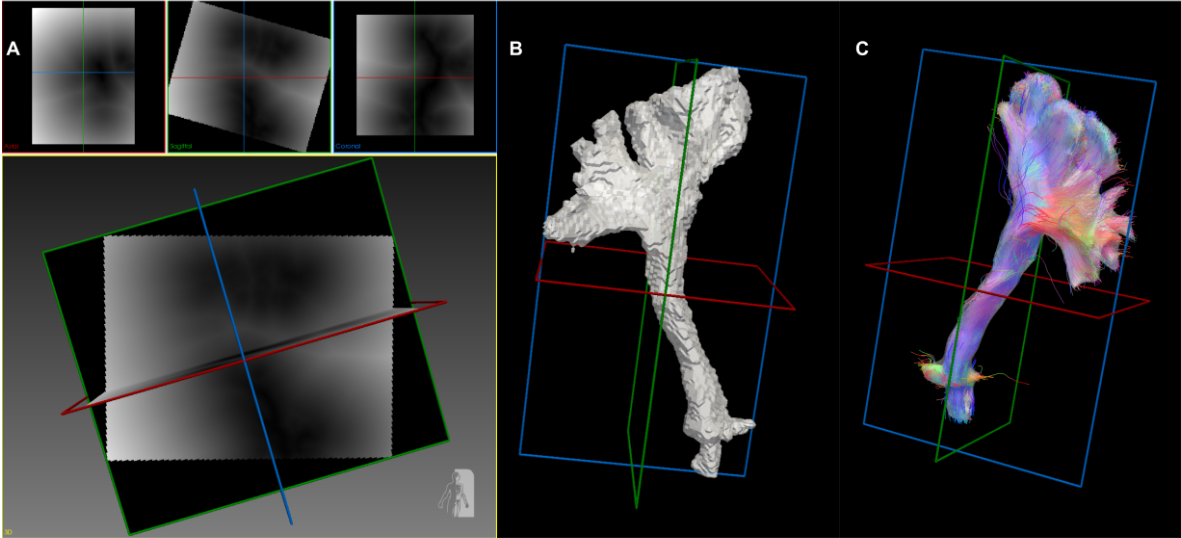
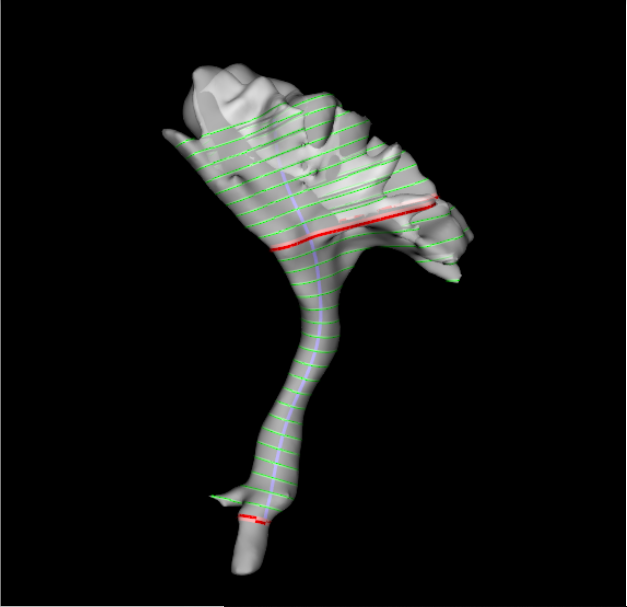
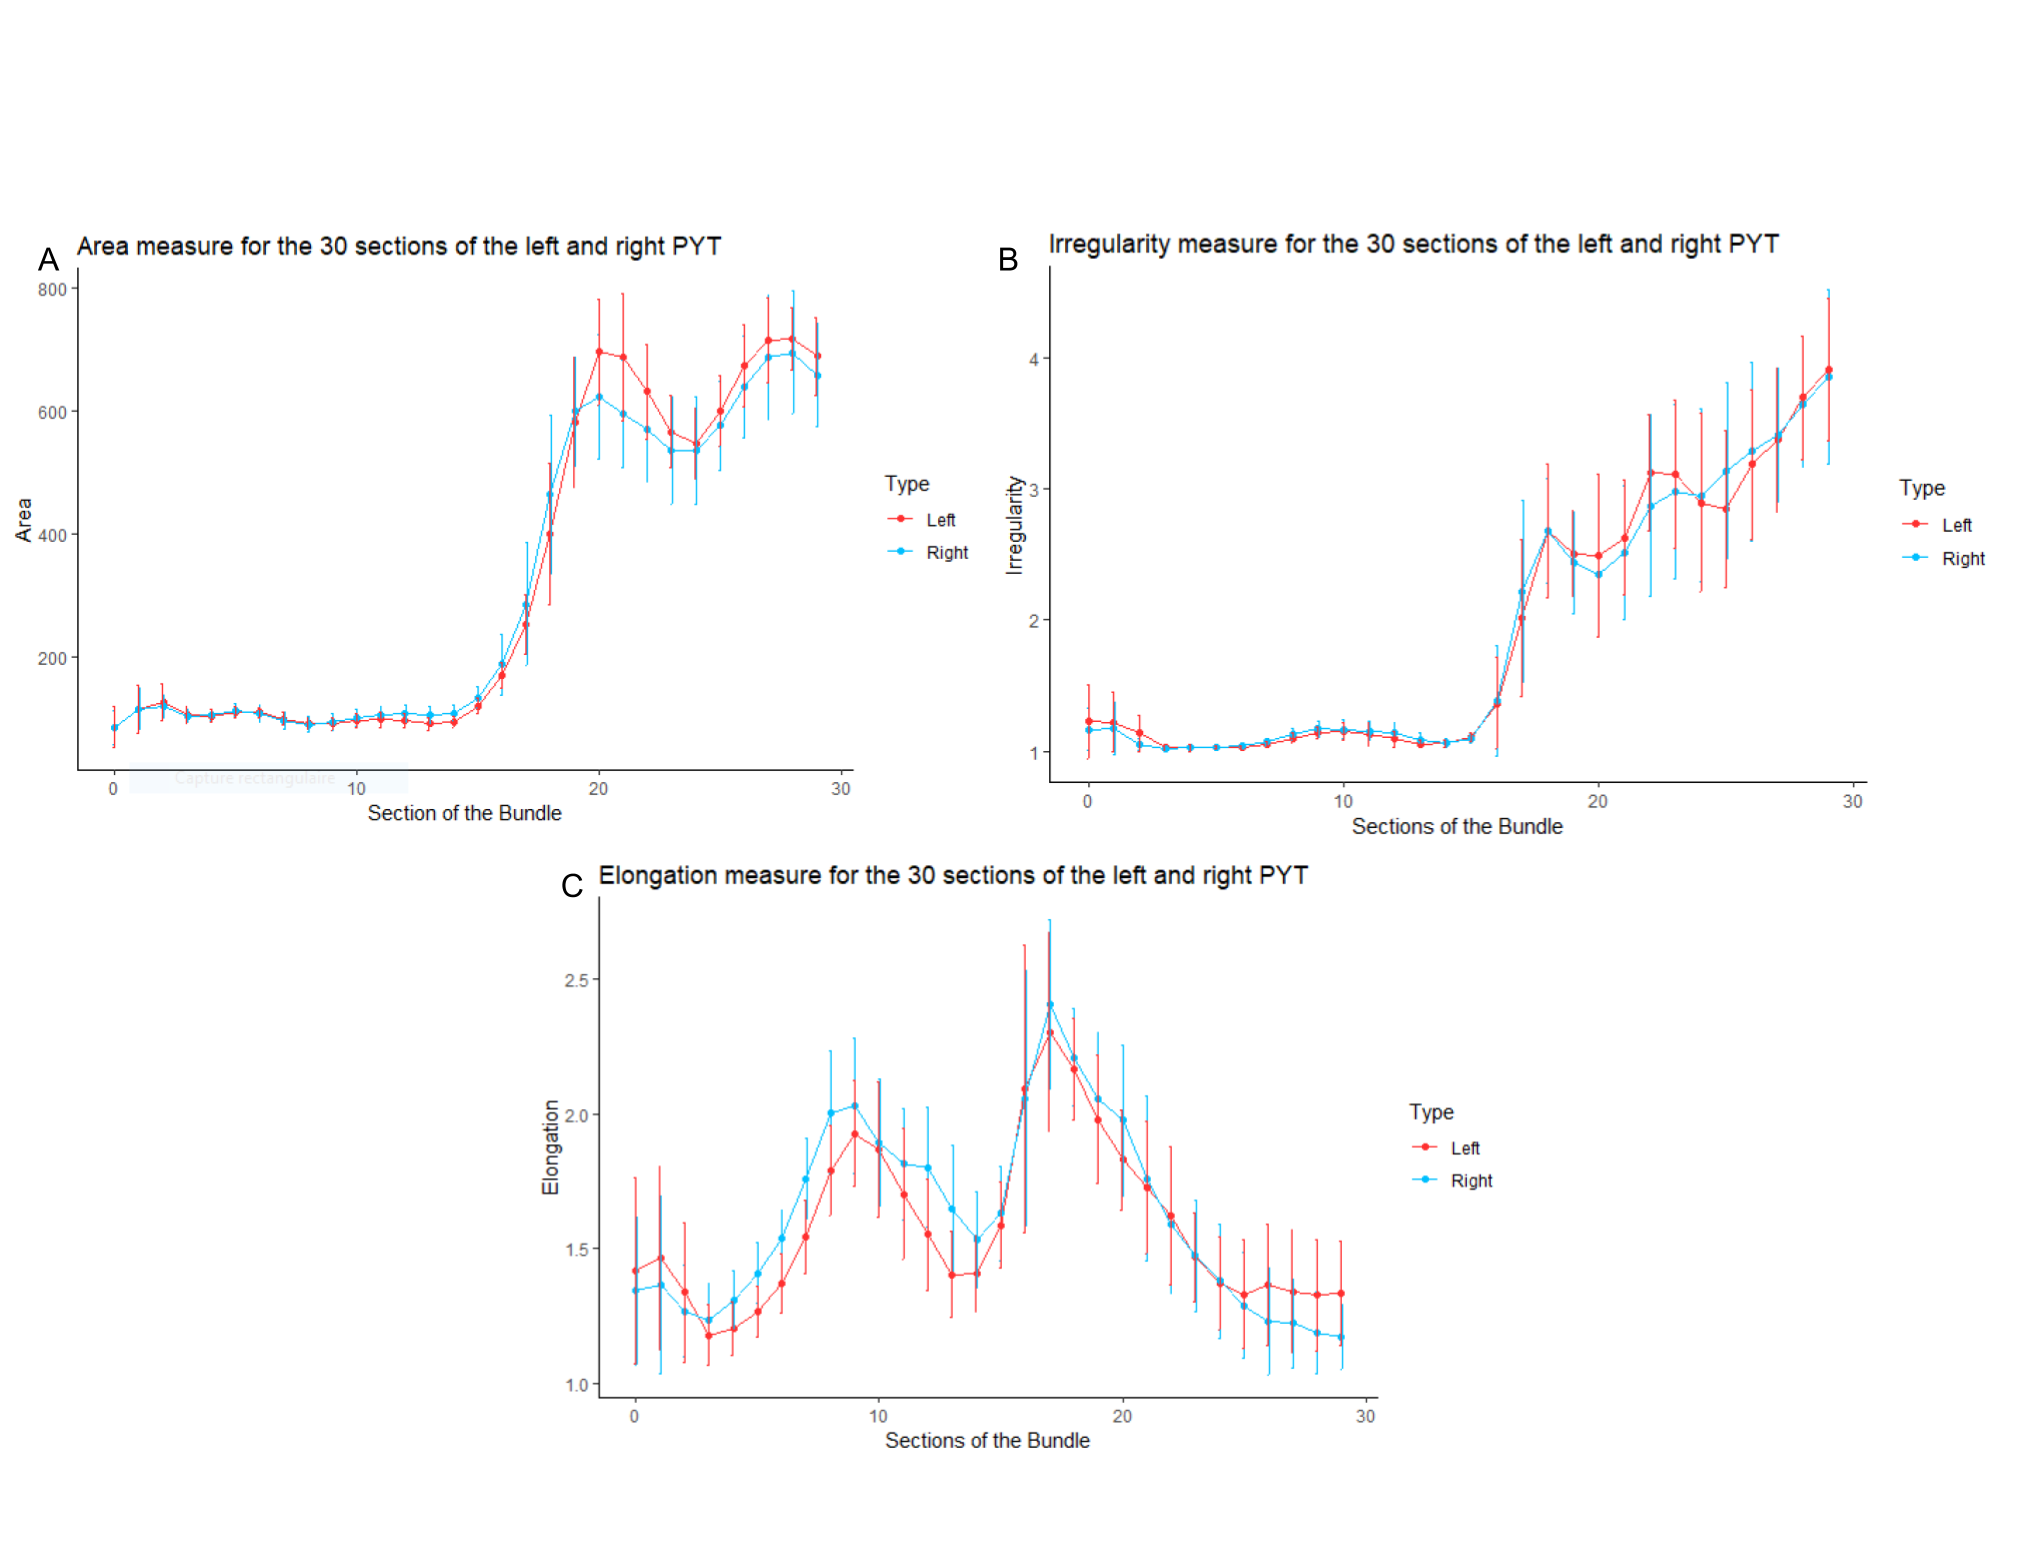
To analyse the shape of a bundle, a surface processing is applied on each bundle. From all streamlines, a binary mask volume is generated. Then, a level set algorithm [9] is employed, which produces an implicit function used afterwards by a marching cube algorithm. The resulting mesh is then processed with a Laplacian smoothing to obtain a final smooth surface, representing the bundle (Figure 1). Then, from 30 points equally sampled along the centroid [10] of the original bundle, the intersections between a plane normal to the centroid at one of the 30 points and the surface were computed, as illustrated in Figure 2. On each of these 30 closed curves, the area, the elongation, and the irregularity are computed. Area is the simple computation of the area formed by the closed curve. Elongation is the ratio between the width and the height of the minimum oriented bounding rectangle. The area A and the perimeter P of the closed curve is used to calculate the irregularity. Irregularity of 1 implies a perfect circle : $I=\frac{P^2}{4 \pi A}$. Finally, this process is applied on the left and right PYT of each of 30 acquisitions. The data comes from a healthy brain dataset using an automatic approach with registration as in [11].Results
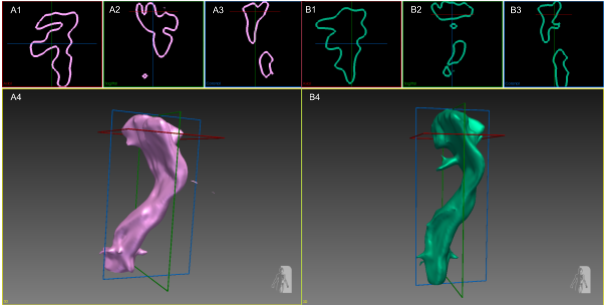
In Figure1, we can observe that the surface produced by the process is closed to the original bundles and that the global shape of the bundle is preserved. Then, when comparing the total WM volume of the left and right PYT, we found a significant asymmetry (p=0.05), i.e. the left PYT has a mean volume of 39 663 土7000 mm³ and the right one of 38 030 土5000mm³. When investigating our three proposed measures (area, elongation, and irregularity), we can deduce that the volume difference by the fanning region of the PYT. Indeed, the area showed an important similarity along the tightly packed sections of the internal capsule. Although it is difficult to draw conclusions with the irregularity and the elongation measures because of the high standard deviation, it is clearly seen that the shape variability is occuring at the fanning of the PYT. Nonetheless, we can conclude from the irregularity measures that the inferior part of the PYTs, before the fanning sections, formed almost a regular cylinder, which is very consistent across the 30 acquisitions.Discussion
Shape analysis is very important in many neuroimaging applications, where advanced shape features of the cortex (cortical thickness), of different deep nuclei or structures such as the hippocampus, lead to richer measures than volumes in several applications [12,13]. In WM neuroanatomy, the potential of shape analysis is similar. Finding asymmetries or volume difference is of interest, but does not say where and how the WM structures are different. Our proposed measures are simple and interpretable. Our preliminary study of the 30 left/right PYTs confirmed the asymmetry of the left/right PYT observed with the volume measurements and illustrated that the difference in volume was driven by the fanning part. Further experiments are needed on other types of bundles to verify if these measures are efficient for a variation of shapes.Conclusion
Using novel surface-based shape measures along the cross-section of white matter bundles opens paths to more precise and specific observations on the shape differences of bundles.Acknowledgements
The authors would like to thank the Fonds de recherche du Québec – Nature et technologies (FRQNT) and Natural Sciences and Engineering Research Council of Canada(NSERC). We also thank the Université de Sherbrooke institutional chair in neuroinformatics for their support and we thank NSERC Discovery grant from Pr Descoteaux.References
[1] Hasan, K. M., Gupta, R. K., Santos, R. M., Wolinsky, J. S., & Narayana, P. A. (2005). Diffusion tensor fractional anisotropy of the normal‐appearing seven segments of the corpus callosum in healthy adults and relapsing‐remitting multiple sclerosis patients. Journal of Magnetic Resonance Imaging, 21(6), 735-743.
[2] Clark, K. A., Nuechterlein, K. H., Asarnow, R. F., Hamilton, L. S., Phillips, O. R., Hageman, N. S., ... & Narr, K. L. (2011). Mean diffusivity and fractional anisotropy as indicators of disease and genetic liability to schizophrenia. Journal of psychiatric research, 45(7), 980-988.
[3] Ma, E., Song, T., Zhang, H., Lu, J., Wang, L., Zhao, Q., ... & Li, K. (2015). The reduction of volume and fiber bundle connections in the hippocampus of EGR3 transgenic schizophrenia rats. Neuropsychiatric disease and treatment, 11, 1625.
[4] Jones, D. K., Knösche, T. R., & Turner, R. (2013). White matter integrity, fiber count, and other fallacies: the do's and don'ts of diffusion MRI. Neuroimage, 73, 239-254.
[5] Scher, A. I., Xu, Y., Korf, E. S. C., White, L. R., Scheltens, P., Toga, A. W., ... & Launer, L. J. (2007). Hippocampal shape analysis in Alzheimer’s disease: a population-based study. Neuroimage, 36(1), 8-18.
[6] O'Donnell, L. J., Westin, C. F., & Golby, A. J. (2009). Tract-based morphometry for white matter group analysis. Neuroimage, 45(3), 832-844.
[7]Corouge, I., Gouttard, S., & Gerig, G. (2004, April). Towards a shape model of white matter fiber bundles using diffusion tensor MRI. In Biomedical Imaging: Nano to Macro, 2004. IEEE International Symposium on (pp. 344-347). IEEE.
[8] Glozman, T., Bruckert, L., Pestilli, F., Yecies, D. W., Guibas, L. J., & Yeom, K. W. (2018). Framework for shape analysis of white matter fiber bundles. NeuroImage, 167, 466-477.
[9] Cohen, R. (2011). The chan-vese algorithm. arXiv preprint arXiv:1107.2782.Chenot, Q., Tzourio-Mazoyer, N., Rheault, F., Descoteaux, M., Crivello, F., Zago, L., ... &
[10] Cousineau, M., Jodoin, P. M., Garyfallidis, E., Côté, M. A., Morency, F. C., Rozanski, V., ... & Descoteaux, M. (2017). A test-retest study on Parkinson's PPMI dataset yields statistically significant white matter fascicles. NeuroImage: Clinical, 16, 222-233.
[11] Petit, L. (2018). A probabilistic atlas of the human pyramidal tract in 410 healthy participants. bioRxiv, 251108.
[12] Coscia, D. M., Narr, K. L., Robinson, D. G., Hamilton, L. S., Sevy, S., Burdick, K. E., ... & Szeszko, P. R. (2009). Volumetric and shape analysis of the thalamus in first‐episode schizophrenia. Human brain mapping, 30(4), 1236-1245.
[13] Gerardin, E., Chételat, G., Chupin, M., Cuingnet, R., Desgranges, B., Kim, H. S., ... & Eustache, F. (2009). Multidimensional classification of hippocampal shape features discriminates Alzheimer's disease and mild cognitive impairment from normal aging. Neuroimage, 47(4), 1476-1486.
Figures