3381
Fibre Tracking of the Arcuate Fasciculus at High Spatial and Angular Resolution1Sydney Translational Imaging Laboratory, Heart Research Institute, The University of Sydney, Sydney, Australia, 2GE Healthcare, Melbourne, Australia, 3Department of Radiology, Mayo Clinic, Rochester, MN, United States, 4GE Global Research, Niksayuna, NY, United States, 5Department of Radiology, Royal Prince Alfred Hospital, Sydney, Australia
Synopsis
We compared fibre tracking performance in the arcuate fasciculus across a range of angular resolutions, as well as a low distortion dataset using diffusion MRI data from a Compact 3T scanner with high-performance gradients. Tracking performance increased approximately linearly with greater angular resolution. Performance was also improved using a low-distortion diffusion sequence at a single relatively low angular resolution acquisition (33 directions).
Introduction
Diffusion MRI tractography has enabled perioperative visualisation and quantification of the connectivity in functionally important or eloquent brain areas through in-vivo delineation of white matter tracts. Currently, only deterministic tractography using a tensor-based model is used clinically but this approach suffers from poor characterization of tracts in regions of crossing fibres 1. Here we applied probabilistic tractography with varying angular resolutions using a Compact 3T scanner with high-performance gradients to test the efficiency of tracking in the arcuate fasciculus (AF), a tract critical to language processing 2. We hypothesised that the improvement in signal would translate to a higher percentage of measured tracks traversing the AF and better qualitative delineation.Methods
One healthy adult was imaged using the GE Compact 3T MRI scanner (peak gradient amplitude 80 mT/m, slew rate 700 T/m/s) 3-5. Frequency shifting 6 and gradient pre-emphasis 7 was applied to account for additional concomitant fields arising from the asymmetric transverse gradients. High-order gradient non-linearity correction with even-order terms was also employed 8. The diffusion acquisitions were as follows:
- High spatial & angular resolution: “Multi-shell” 1.2 mm3, TE=58.6 ms, TR=6000 ms, FA=90°, 750 diffusion-weighted volumes over 3 shells at b=700 (134), 1000 (214) and 2800 (402), plus 42 b=0 volumes, multiband factor=3, in-plane acceleration factor=2, ~80 minutes. This dataset was down-sampled to 700, 560, 420, 280, 140, 64 and 33 directions while retaining uniform angular distribution within shells.
- Low Distortion: “MUSE” 9 1.2mm3, TE=54.5 ms, TR=12500 ms, FA=90°, 33 diffusion-weighted volume at b=1000 mm/s2 plus 1 b=0 volumes, in-plane acceleration factor=3, ~15 minutes.
T1-weighted images were acquired using MPRAGE PROMO: 1 mm3, matrix=256x256 TE=2.4 ms, TR=5752 ms, TI=900 ms, FA=8°.
Diffusion data were de-noised using the MRtrix3 package 10. Susceptibility and eddy current induced distortions were then corrected using the FSL’s topup & eddy 11, 12. Fibre orientation distributions were obtained by first estimating tissue response functions using the Dhollander algorithm, then applying a multi-shell multi-tissue constrained spherical deconvolution on the corrected dataset using the MRtrix3 package 13, 14. Automated segmentation of the T1-weighted image was performed using Freesurfer 15. The AF was tracked using a standardised approach (Figure 1) 2.
Results
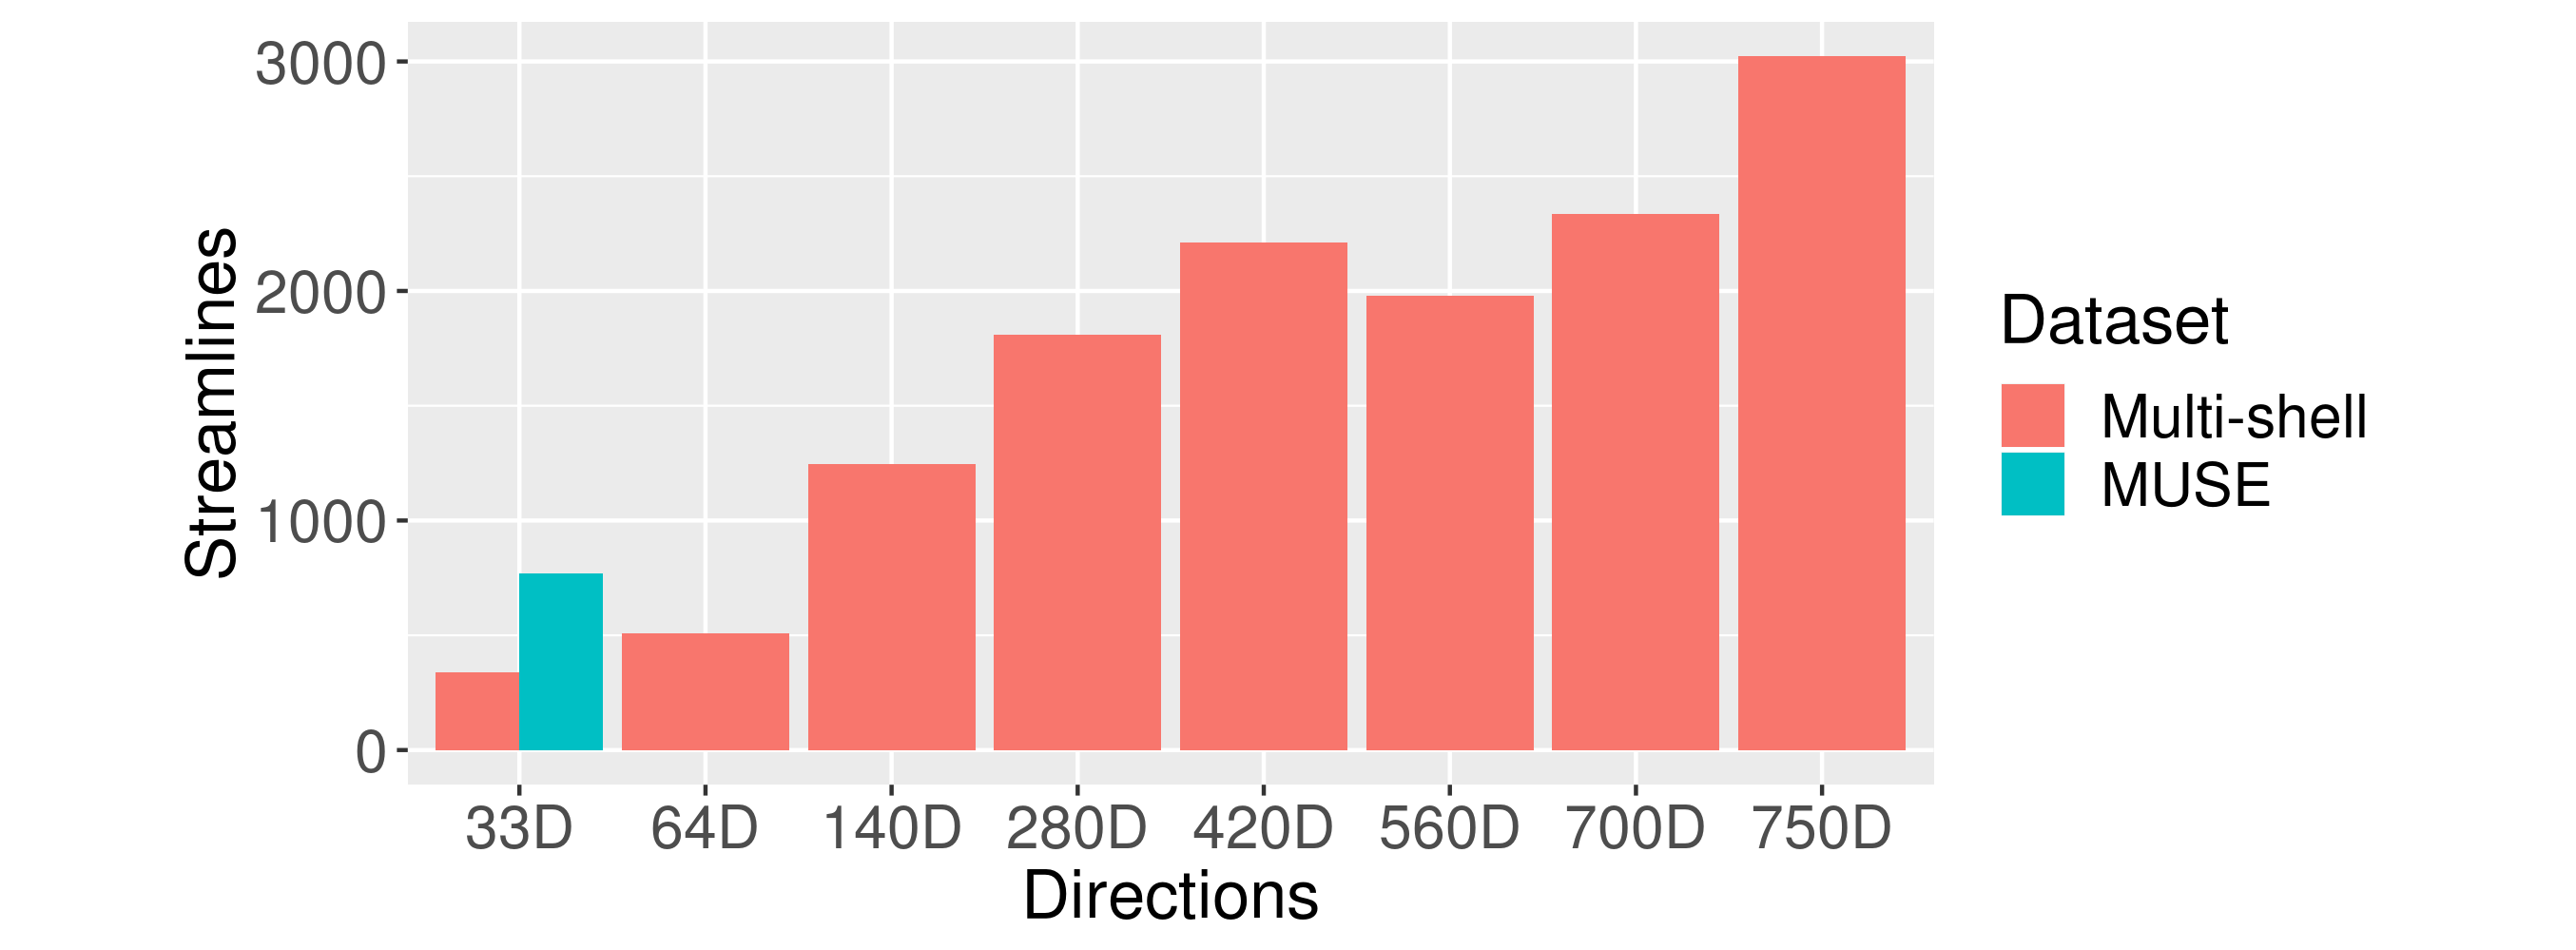
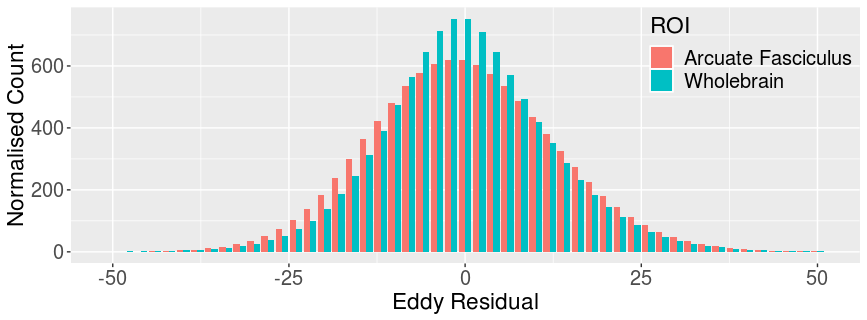
Tracking results are presented in Figure 2, showing a visual improvement in the delineation of the AF with increasing angular resolution and at lower distortion. The Multi-shell 750-dir dataset had the highest proportion of streamlines which were retained within the AF after filtering (0.60%, Figure 3). Within subsamples of the Multi-shell 750-dir dataset, the proportion of tracks reaching both Broca’s and Wernicke’s areas approximately followed a linear progression (33: 0.07%; 64: 0.10%; 140: 0.25%; 280: 0.36%; 420: 0.44%; 560: 0.40%; 700: 0.47%). Inspection of the eddy correction residuals from the Multi-shell 750-dir dataset revealed that the AF experiences slightly greater than “average” distortion effects felt across the whole brain, with a slightly greater spread of residuals demonstrated in the histogram of both AF compared to global ROIs (Figure 4). The low distortion dataset showed an increase in tracking efficiency by a factor of ~2 in AF tracking compared to the same angular resolution down-sampled Multi-shell dataset (33-directions; efficiency change from 0.07% to 0.15%).Discussion
Our data show that probabilistic tractography of the AF improves with greater angular resolution, with no obvious plateau in the number of successfully reconstructed AF tracks towards 750 directions. Although only a single angular resolution was possible for the MUSE acquisition, the increase in tracking efficiency suggests that tractography benefits from a lower distortion acquisition, which is supported by the residuals created during correction (Figure 4). The relatively low distortion and signal dropout in the Compact 3T 4 may translate into improved efficiency of tracking in the AF. The low ratio of retained AF tracks to total tracks in the superior longitudinal fasciculus seed region is likely due to the relatively long tract length, but is representative of many similar tracks across brain networks.Conclusion
Increasing angular resolution at a high spatial resolution is beneficial for tracking performance in the arcuate fasciculus, even for datasets with as many as 750 gradient directions. This is enabled by MRI scanners equipped with high-performance gradients, such as the Compact 3T. At low angular resolution, low distortion acquisitions improve tracking efficiency, although further research is needed to confirm this trend for higher angular resolutions.Acknowledgements
No acknowledgement found.References
- Tournier JD, Calamante F, Connelly A. Robust determination of the fibre orientation distribution in diffusion MRI: non-negativity constrained super-resolved spherical deconvolution. Neuroimage. 2007;35(4):1459-72.
- Glasser MF, Rilling JK. DTI tractography of the human brain's language pathways. Cereb Cortex. 2008;18(11):2471-82.
- Foo TKF, Laskaris E, Vermilyea M, Xu M, Thompson P, Conte G, et al. Lightweight, compact, and high-performance 3T MR system for imaging the brain and extremities. Magn Reson Med. 2018;80(5):2232-45.
- Tan ET, Lee SK, Weavers PT, Graziani D, Piel JE, Shu Y, et al. High slew-rate head-only gradient for improving distortion in echo planar imaging: Preliminary experience. J Magn Reson Imaging. 2016;44(3):653-64.
- Weavers PT, Shu Y, Tao S, Huston J, 3rd, Lee SK, Graziani D, et al. Technical Note: Compact three-tesla magnetic resonance imager with high-performance gradients passes ACR image quality and acoustic noise tests. Med Phys. 2016;43(3):1259-64.
- Weavers PT, Tao S, Trzasko JD, Frigo LM, Shu Y, Frick MA, et al. B0 concomitant field compensation for MRI systems employing asymmetric transverse gradient coils. Magn Reson Med. 2018;79(3):1538-44.
- Tao S, Weavers PT, Trzasko JD, Shu Y, Huston J, 3rd, Lee SK, et al. Gradient pre-emphasis to counteract first-order concomitant fields on asymmetric MRI gradient systems. Magn Reson Med. 2017;77(6):2250-62.
- Tao S, Trzasko JD, Gunter JL, Weavers PT, Shu Y, Huston J, et al. Gradient nonlinearity calibration and correction for a compact, asymmetric magnetic resonance imaging gradient system. Phys Med Biol. 2017;62(2):N18-N31.
- Chen NK, Guidon A, Chang HC, Song AW. A robust multi-shot scan strategy for high-resolution diffusion weighted MRI enabled by multiplexed sensitivity-encoding (MUSE). Neuroimage. 2013;72:41-7.
- Veraart J, Novikov DS, Christiaens D, Ades-Aron B, Sijbers J, Fieremans E. Denoising of diffusion MRI using random matrix theory. Neuroimage. 2016;142:394-406.
- Andersson JLR, Sotiropoulos SN. An integrated approach to correction for off-resonance effects and subject movement in diffusion MR imaging. Neuroimage. 2016;125:1063-78.
- Andersson JL, Skare S, Ashburner J. How to correct susceptibility distortions in spin-echo echo-planar images: application to diffusion tensor imaging. Neuroimage. 2003;20(2):870-88.
- Dhollander T, Raffelt D, Connelly A. Accuracy of response function estimation algorithms for 3-tissue spherical deconvolution of diverse quality diffusion MRI data2018.
- Jeurissen B, Tournier J-D, Dhollander T, Connelly A, Sijbers J. Multi-tissue constrained spherical deconvolution for improved analysis of multi-shell diffusion MRI data. NeuroImage. 2014;103:411-26.
- Reuter M, Schmansky NJ, Rosas HD, Fischl B. Within-subject template estimation for unbiased longitudinal image analysis. Neuroimage. 2012;61(4):1402-18.
- Tournier J-D, Calamante F, Connelly A. Improved probabilistic streamlines tractography by 2nd order integration over fibre orientation distributions2010.
- Smith RE, Tournier JD, Calamante F, Connelly A. Anatomically-constrained tractography: improved diffusion MRI streamlines tractography through effective use of anatomical information. Neuroimage. 2012;62(3):1924-38.
Figures