3379
Comparison of diffusion MRI data with different b-values in trigeminal nerve tracking with unscented Kalman filter tractography1Nuclear Industry 215 Hospital of Shaanxi Province, Xianyang, China, 2Brigham and Women's Hospital, Harvard Medical School, Boston, MA, United States, 3Cantonal Hospital St. Gallen, St. Gallen, Switzerland
Synopsis
Diffusion MRI enables improved identification of the trigeminal nerve by tracking of its 3-D trajectory. To explore optimal methods for trigeminal nerve tracking using diffusion MRI, we compared tracking results from acquisitions with different b-values using single- and multi-fiber tractography methods. We found that the trigeminal nerve can be best tracked using b=3000 data with a two-tensor fiber model. We suggest that these settings can potentially be suitable for clinical applications, e.g., diagnosis and evaluation of trigeminal neuralgia.
INTRODUCTION
The trigeminal nerve (TGN) is affected in diseases such as trigeminal schwannoma and multiple sclerosis1–3. Accurate identification of TGN in advance provides important information for differential diagnosis and intraoperative protection of TGN. While structural MRI provides voxel-wise localization of TGN, diffusion MRI (dMRI), via a process called tractography4, enables tracking of the 3-D trajectory of TGN5–9.
To date, dMRI work on tracking TGN has mostly used data from clinical acquisitions with a b-value of 1000 s/mm2 using standard single-fiber tractography methods6,7. Research studies on tractography have suggested better performance using higher b-value acquisitions and/or multi-fiber tractography methods, e.g., for neurosurgery10–13. Nevertheless, no studies have been conducted to investigate whether such advanced data acquisition and tractography methods can improve TGN tracking.
In this work, we sought to compare TGN tracking results from dMRI acquisitions with different b-values (b=1000, 2000 and 3000 s/mm2) using single- and multi-fiber tractography methods. Our goal is to explore an appropriate method of TGN tracking for clinical practice. We hypothesize that using a higher b-value acquisition and a multi-fiber tractography method can be beneficial for tracking through crossing fiber regions, e.g. where TGN and the cerebral peduncle cross, and reducing false positive TGN tracts, e.g. fibers that deviate from the known anatomy of TGN.
METHODS
We used dMRI data from 10 Human Connectome Project (HCP)14 subjects for experimental evaluation. HCP provides multi-shell dMRI data at b=1000/2000/3000 s/mm2. To investigate TGN tracking at certain b values, we separated the multi-shell data into single-shell b=1000, b=2000 and b=3000 datasets. Unscented Kalman filter (UKF) tractography15,16 was applied because of its good performance in white matter fiber tracking10–12. For each subject, one-tensor (1T) and two-tensor (2T) UKF tractography were performed on each single-shell dataset. Tractography parameters were tuned for each individual method and b-value. A mask, covering the possible region through which the TGN passes, was used to seed the tracking.
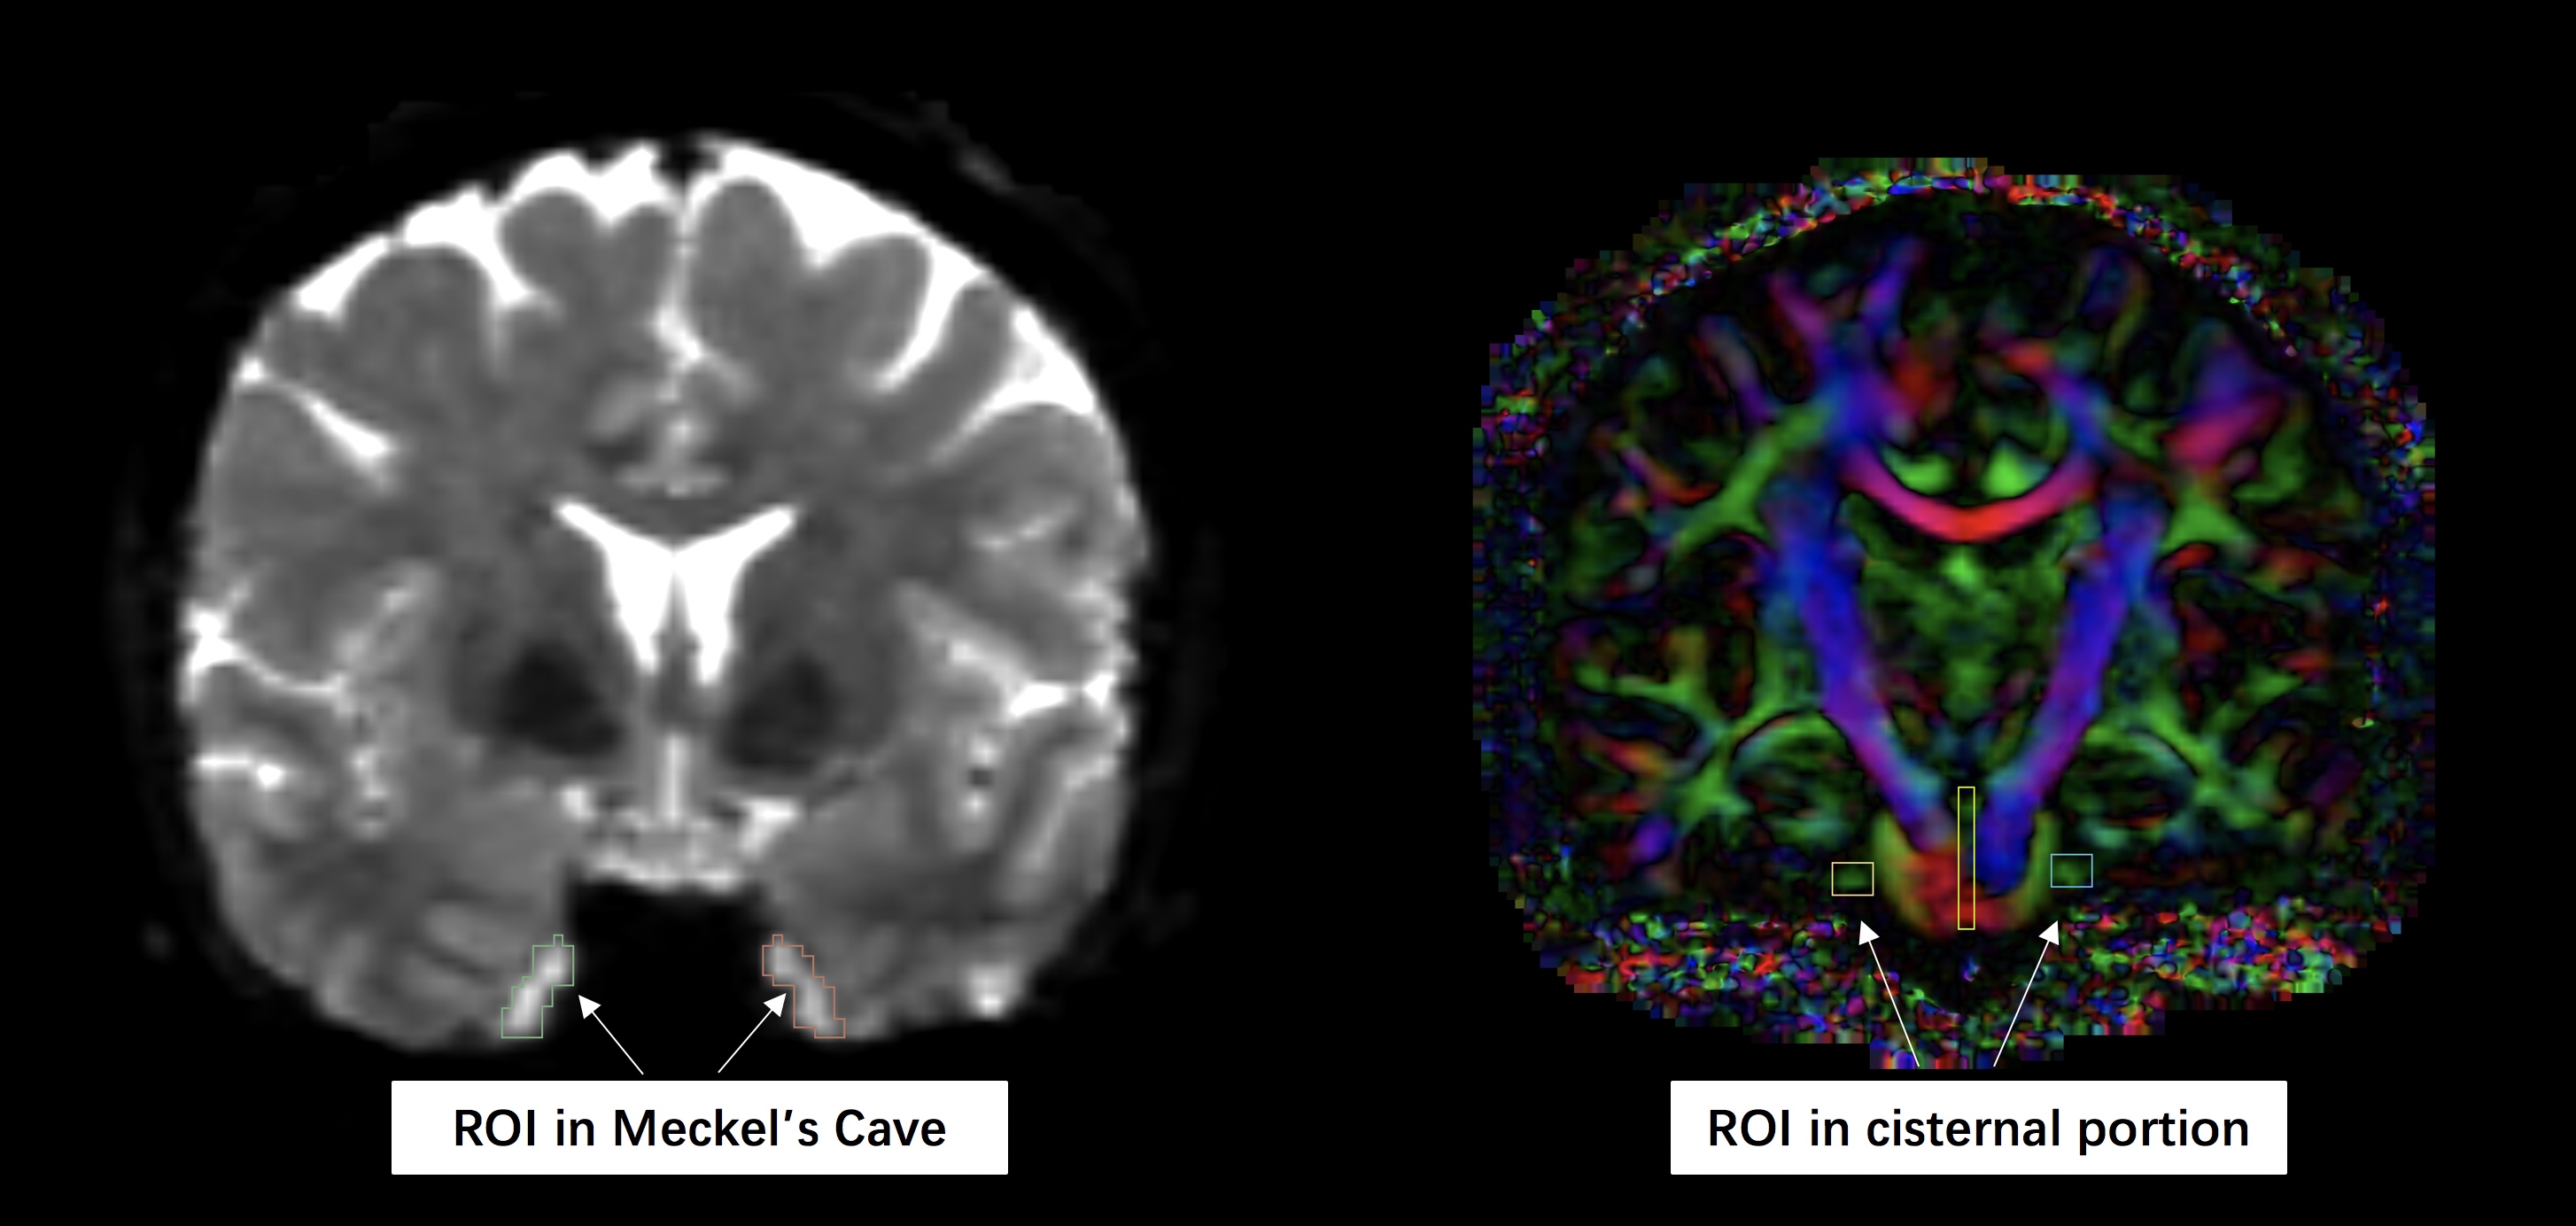
Then, TGN was selected from the seeded tractography using a region-of-interest (ROI) selection. Two ROIs (Figure-1) were drawn to detect the TGN in each hemisphere. This gave 6 TGN results including 1T-b1000, 1T-b2000, 1T-b3000, 2T-b1000, 2T-b2000 and 2T-b3000.
To compare the TGN results, we performed visual and quantitative evaluations. An expert reader (GX) visually checked each TGN tract by overlaying it on the structural T2-weighted image (on which TGN was more visually apparent than on dMRI). The following criteria were used based on the anatomy of TGN, including 1) whether the TGN fibers avoided the temporal lobe, 2) whether TGN entered the brainstem as anatomically expected, and 3) whether the trajectory of the TGN was consistent with the TGN anatomical pathway as apparent on the T2-weighted image. For quantitative analysis, we computed the percentage of fibers that correctly headed toward the brainstem and did not terminate in the cerebellar peduncle.
RESULTS
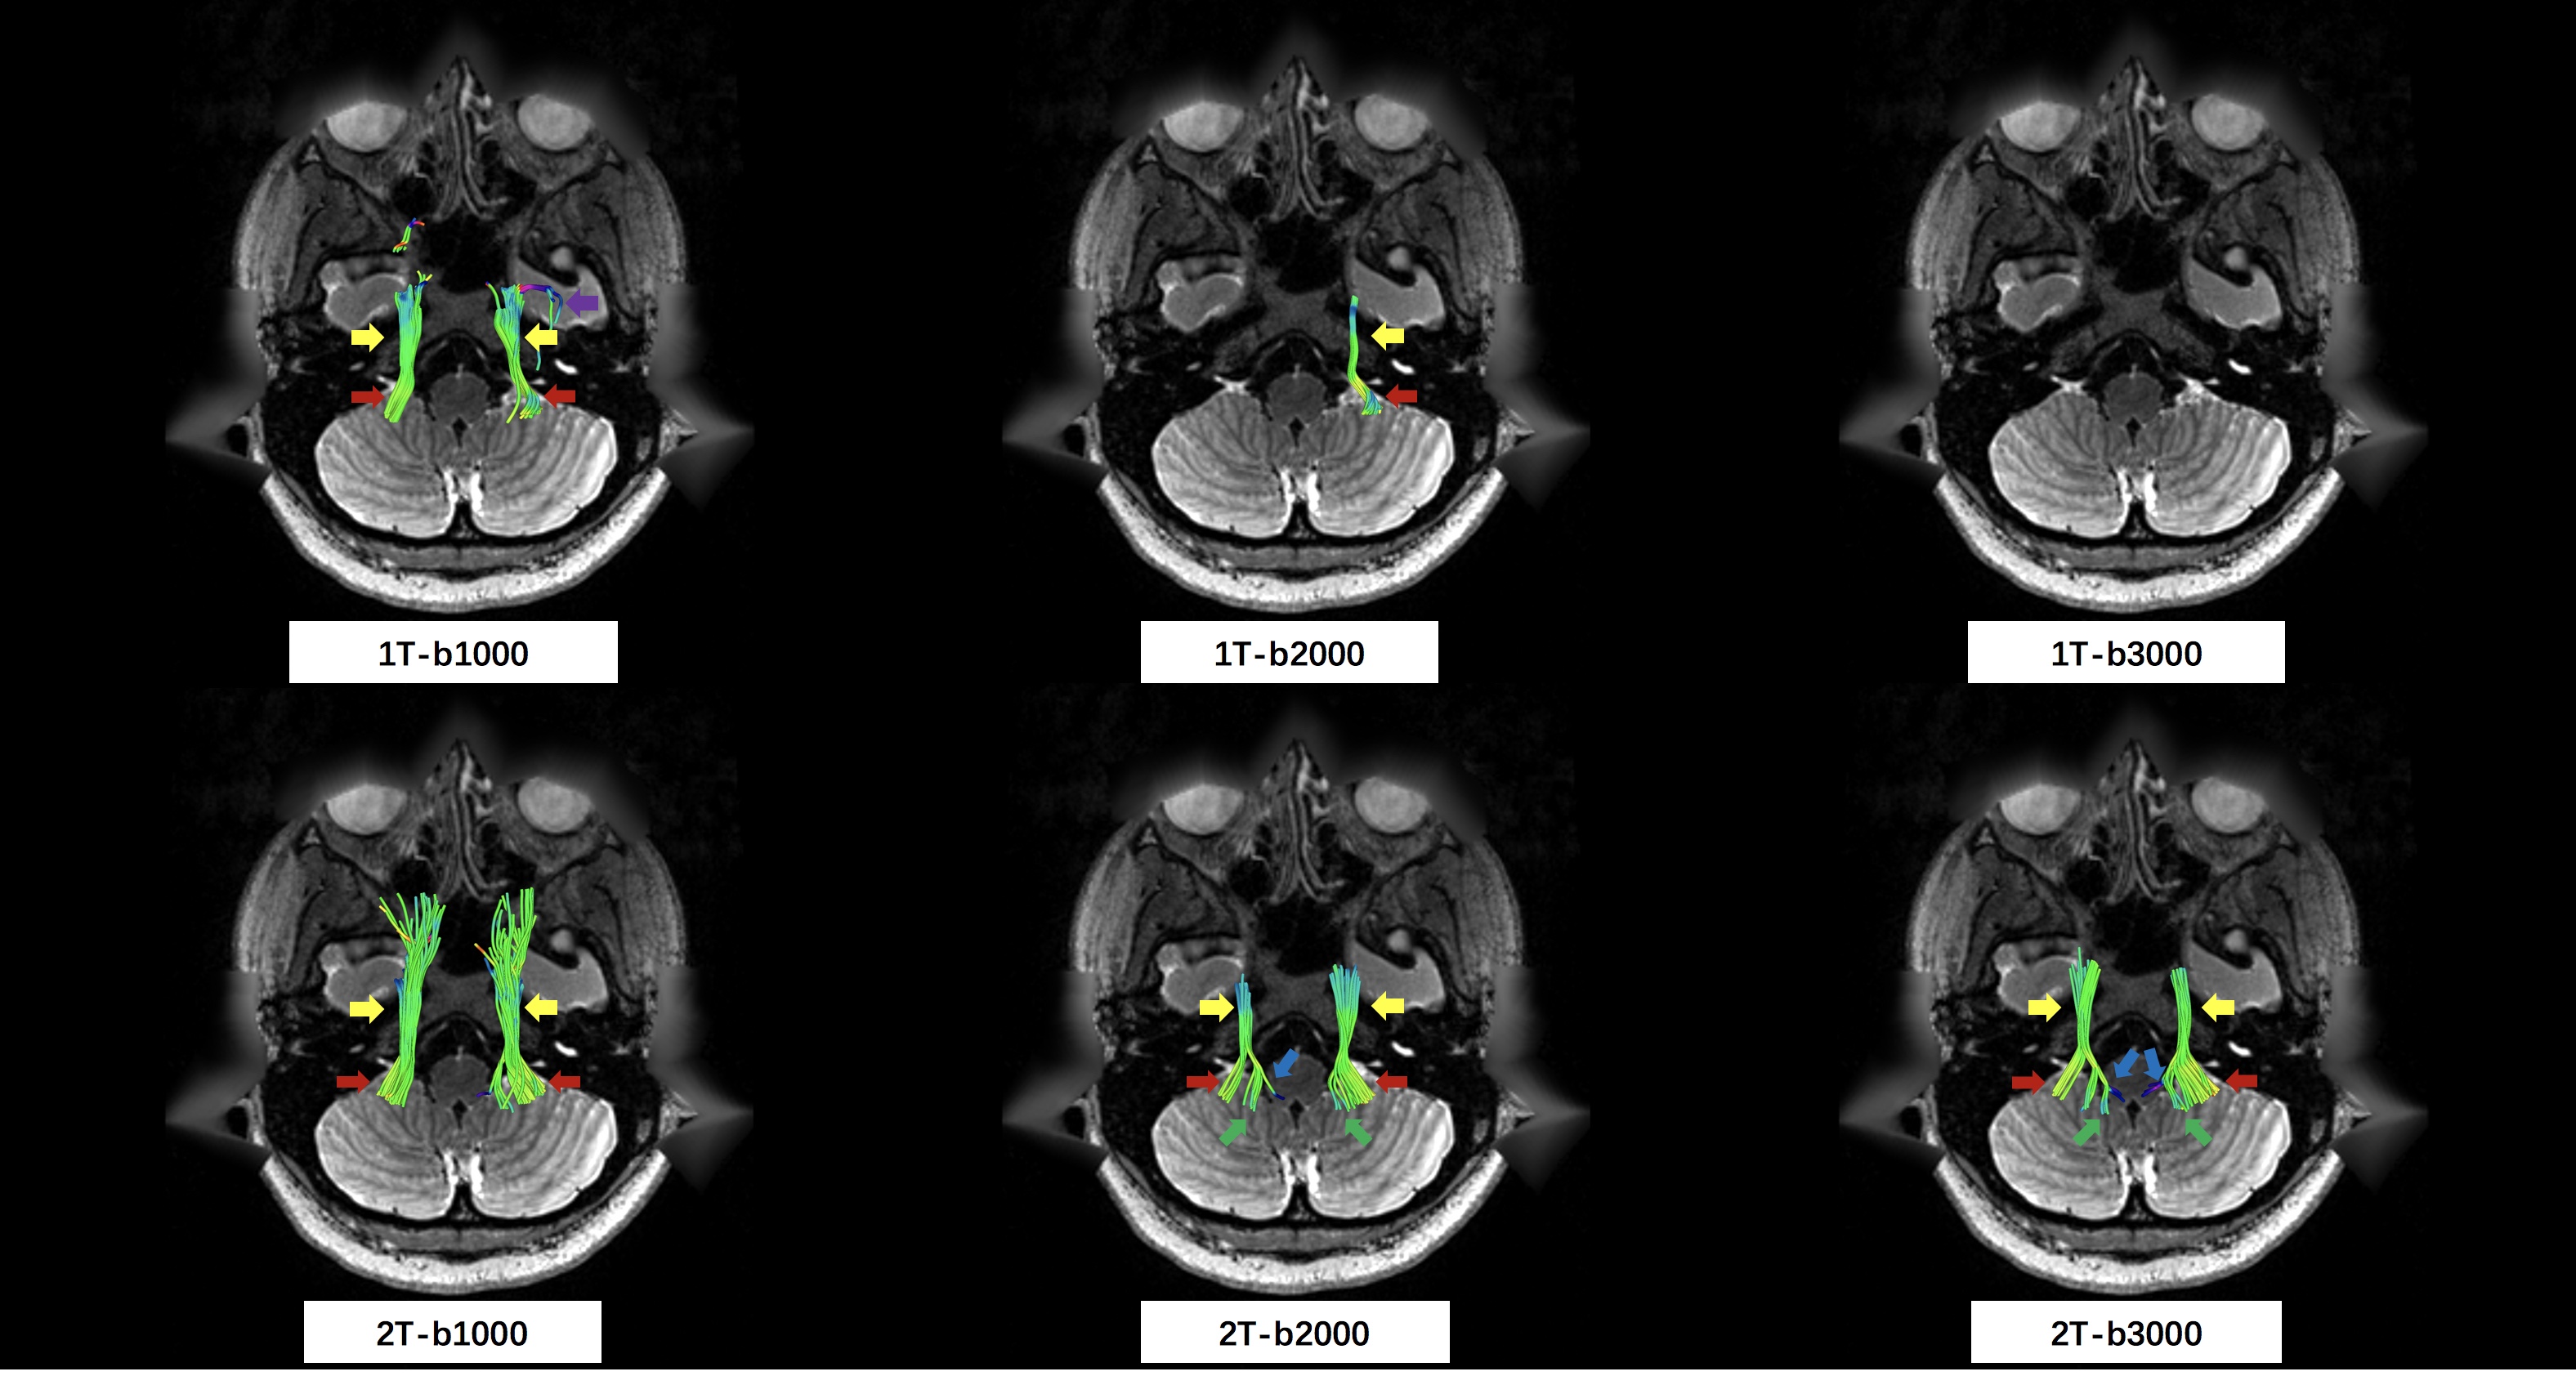
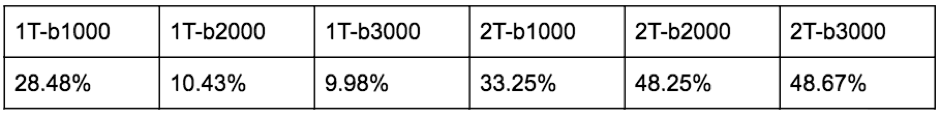
All 20 TGN tracts (bilateral per subject) could be detected in 1T-b1000, 2T-b1000, 2T-b2000 and 2T-b3000, but only 8 were detected in 1T-b2000 and 3 were detected in 1T-b3000. Results from visual inspection are as follows. The TGN results from the b=1000 shells (1T-b1000 and 2T-b1000) generally entered the cerebellar peduncle rather than the brainstem. The 2T-2000 TGN tract looked visually reasonable but with many false positive fibers, e.g. entering the temporal lobe. The 2T-3000 tract gave the best result in terms of the anatomy of TGN following the aforementioned three criteria. The 2T-3000 tract also gave the best quantitative result, in which 48.6% of fibers headed toward the brainstem, following the correct anatomical pathway (Figure-3).DISCUSSION
In general, we found that a two-tensor tractography method could better track TGN than a single-tensor method. This is likely because TGN crosses the cerebellar peduncle, and the single tensor model cannot resolve fiber crossings. Across the different shells, we found that b=3000 gave a TGN tract that was the most anatomically correct according to our proposed criteria. This could potentially be explained by the fact that angular resolution is better at higher b-values17,18. In the 1T-b2000 and 1T-b3000 results, TGN tracking frequently stopped before entering the MC so many tracks were not detected.CONCLUSION
We compared TGN tracking results from dMRI acquisitions with different b-values using single- and multi-fiber UKF tractography methods. We found that the trigeminal nerve can be best tracked using b=3000 data with a two-tensor fiber model. We suggest that these settings can potentially be suitable for clinical applications, e.g., diagnosis and evaluation of trigeminal neuralgia.Acknowledgements
We gratefully acknowledge funding provided by the following National Institutes of Health (NIH) grants: P41 EB015902, P41 EB015898, R01 MH074794, R01 MH097979, U01 CA199459, and R03 NS088301.References
1. Woolfall, P. & Coulthard, A. Pictorial review: Trigeminal nerve: anatomy and pathology. Br. J. Radiol. 74, 458–467 (2001).
2. Bathla, G. & Hegde, A. N. The trigeminal nerve: an illustrated review of its imaging anatomy and pathology. Clin. Radiol. 68, 203–213 (2013).
3. Agarwal, A. Intracranial trigeminal schwannoma. Neuroradiol. J. 28, 36–41 (2015).
4. Basser, P. J., Pajevic, S., Pierpaoli, C., Duda, J. & Aldroubi, A. In vivo fiber tractography using DT-MRI data. Magn. Reson. Med. 44, 625–632 (2000).
5. Chen, D. Q. et al. Diffusivity signatures characterize trigeminal neuralgia associated with multiple sclerosis. Mult. Scler. 22, 51–63 (2016).
6. Rousseau, A. et al. Diffusion tensor magnetic resonance imaging of trigeminal nerves in relapsing herpetic keratouveitis. PLoS One 10, e0122186 (2015).
7. Fujiwara, S. et al. High-resolution diffusion tensor imaging for the detection of diffusion abnormalities in the trigeminal nerves of patients with trigeminal neuralgia caused by neurovascular compression. J. Neuroimaging 21, e102–8 (2011).
8. Herweh, C. et al. Loss of anisotropy in trigeminal neuralgia revealed by diffusion tensor imaging. Neurology 68, 776–778 (2007).
9. Yoshino, M. et al. Visualization of Cranial Nerves Using High-Definition Fiber Tractography. Neurosurgery 79, 146–165 (2016).
10. Gong, S. et al. Free water modeling of peritumoral edema using multi-fiber tractography: Application to tracking the arcuate fasciculus for neurosurgical planning. PLoS One 13, e0197056 (2018).
11. Chen, Z. et al. Corticospinal tract modeling for neurosurgical planning by tracking through regions of peritumoral edema and crossing fibers using two-tensor unscented Kalman filter tractography. Int. J. Comput. Assist. Radiol. Surg. 11, 1475–1486 (2016).
12. Zhang, F. et al. An anatomically curated fiber clustering white matter atlas for consistent white matter tract parcellation across the lifespan. Neuroimage 179, 429–447 (2018).
13. Nimsky, C. Fiber tracking--we should move beyond diffusion tensor imaging. World Neurosurg. 82, 35–36 (2014).
14. Van Essen, D. C. et al. The WU-Minn Human Connectome Project: an overview. Neuroimage 80, 62–79 (2013).
15. Malcolm, J. G., Shenton, M. E. & Rathi, Y. Filtered multitensor tractography. IEEE Trans. Med. Imaging 29, 1664–1675 (2010).
16. Reddy, C. P. & Rathi, Y. Joint Multi-Fiber NODDI Parameter Estimation and Tractography Using the Unscented Information Filter. Front. Neurosci. 10, 166 (2016).
17. Descoteaux, M., Angelino, E., Fitzgibbons, S. & Deriche, R. Regularized, fast, and robust analytical Q-ball imaging. Magn. Reson. Med. 58, 497–510 (2007).
18. Ning, L. et al. Sparse Reconstruction Challenge for diffusion MRI: Validation on a physical phantom to determine which acquisition scheme and analysis method to use? Med. Image Anal. 26, 316–331 (2015).
Figures