3378
Optimized DTI acquisition and tractography pipeline for a reliable reconstruction of the facial nerve in patients with vestibular schwannomaManuela Moretto1,2, Valentina Baro3, Sabrina Brigadoi4, Marco Castellaro1,2, Mariagiulia Anglani5, Antonio Mazzoni3, Elisabetta Zanoletti3, Andrea Landi3, Luca Denaro3, Francesco Causin5, Domenico D'Avella3, and Alessandra Bertoldo1,2
1Padova Neuroscience Center, University of Padova, Padova, Italy, 2Department of Information Engineering, University of Padova, Padova, Italy, 3Department of Neurosciences, University of Padova, Padova, Italy, 4Department of Developmental Psychology and Socialisation, University of Padova, Padova, Italy, 5Neuroradiology Unit, University of Padova, Padova, Italy
Synopsis
Vestibular schwannomas (VS) are
intracranial tumors that can cause the dislocation of the facial nerve (FN).
The location of the FN is therefore a priori unknown to the surgeon and this is
the main reason why patients with VS may experience FN damage during the
surgery, leading to facial paralysis. In this work we used a multi-shell DTI
acquisition to perform probabilistic fiber tracking for the preoperative
determination of FN course in patients with VS. High-resolution anatomical scans were
used to help the fiber tracking algorithm to obtain a reliable reconstruction also
when the FN course had a complex configuration.
INTRODUCTION
Vestibular schwannomas (VS) are intracranial tumors that affect 1% of the population1. Most of VS are treated surgically with the aim to excise the tumor and preserve the functions of the nerves located nearby, including the facial nerve (FN), which controls the muscles responsible for facial expressions2. However, 20% of the treated patients experience a partial or total damage to the FN, since it can be dislocated by the tumor and therefore its location is a priori unknown to the surgeon. Diffusion tensor imaging (DTI) tractography has been shown to have the potential to predict the location of the FN3,4. Previous studies4,5 employed single-shell DTI with no correction for distortion and deterministic tractography. In this work we optimized both the acquisition protocol, employing a multi-shell DTI acquisition scheme, and the tractography pipeline aiming to a more accurate preoperative reconstruction of the FN course.METHODS
Pre-surgical data of 5 patients with VS were acquired on a 3T Philips Inginia scanner. Patients were administered the standard pre-surgical MR protocol, including high-resolution T2-weighted (TR/TE 1500/241ms; 0.2x0.2x0.2mm) and post-contrast T1-weighted (TR/TE 5.8/3ms; 0.4x0.4x0.5mm), and a multi-shell DTI acquisition. For the DTI sequences two phase-encoding were acquired: antero-posterior (AP) and postero-anterior (PA). The scanning parameters of the AP-DTI sequence (TR/TE 5408/98ms; 2x2x2mm) included three b-values [300-1000-2000]s/mm2, and [8-32-64] non-collinear directions, while the PA-DTI sequence included two b-values [300-1000]s/mm2, and [8-32] non-collinear directions (total acquisition time 23:25 min). DTI preprocessing included image denoising performed with MRtrix dwidenoise function6 and motion, distortion and eddy currents correction performed with FSL topup and eddy tools7,8. The T2-weighted and T1-weighted images were registered with the preprocessed DTI using ANTs Registration tool9. Fiber tracking was performed with MRtrix, using the probabilistic Constrained Spherical Deconvolution method, thus obtaining the distribution of fiber orientations for each voxel10. The parameters of the probabilistic iFOD2 algorithm11 were set as follows: number of streamlines=500000, step size=1mm, maximum angle=45°, fractional anisotropy cutoff=0.1, radius of spherical seeds=2mm. The seeds were selected in the T2-weighted image by an expert neuroradiologist and set at the origin of the FN in the brainstem, at the passage in the cerebellopontine cistern and in the auditory canal as ending point for FN tracking (Figure 1). The T1-weighted image was used to segment the tumor (using ITK-SNAP software12), which was provided to the iFOD2 algorithm as exclusion region.RESULTS AND DISCUSSION
To validate the fiber tracking results, the position of the FN with respect to the tumor location found in-vivo was compared with that obtained with DTI tractography. The in-vivo analysis was carried out by the medical team watching the videos recorded during the surgeries. The qualitative analysis showed that in three of the five patients, the FN reconstructions confirmed the real FN course seen during the surgery (Figure 2). For the other two patients described as limit cases, the FN course found in vivo had a complex geometry. In the first case, the FN was found located on the posterior part of the tumor, a rare location (9.9% of occurrence) since it is usually found on the anterior portion of the tumor. Furthermore, the FN was spread out on the tumor itself, so that the FN, and not the tumor, was the first structure encountered, unbeknown to the surgeon (Figure 3). Our DTI tractography tracked only a portion of the FN, which was compatible with the in vivo findings. In the second limit case, the FN originated in a direction perpendicular to that of the vestibular nerve, instead of the usual parallel one. In this case, the tracking algorithm is likely to fail due to the high curvature angle. Although not providing a perfect reconstruction of the entire FN course, our DTI tractography was able to partially track the FN course yielding a location compatible with in-vivo findings. For these two limit cases, having informed the surgeons before the surgery of the complex pattern and location of the FN fibers, would have allowed a better planning of the surgery and the possibility to inform the patients a priori about the highly likely post-surgery complications.CONCLUSION
We have shown that by employing a multi-shell DTI protocol, distortion correction and a probabilistic tracking algorithm it is feasible to track the FN course also in cases where its geometry and location is complicated. The iFOD2 algorithm, exploiting anatomical information, managed to solve complex fiber patterns and provided a faithful reconstruction of the FN course. Therefore, this study showed that DTI fiber tracking can be a powerful aid for a better presurgical planning of VS removal.Acknowledgements
No acknowledgement found.References
- Albera R., Rossi G.; Otorinolaringoiatria, Edizioni Minerva Medica, 2008, 2nd edition, p.74-77.
- Daroff R.B., Jankovic J., Mazzotta J.C., Pomeroy S.L.; Bradley's Neurology in Clinical Practice, Elsevier, 2016, 7th edition, vol. I.
- Song F., Hou Y., Sun G., Chen X., Xu B., Huang J.H., Zhang J.; In vivo visualization of the facial nerve in patients with acoustic neuroma using diffusion tensor imaging-based fiber tracking, Journal of Neurosurgery, vol.125, 2016, p.787-794.
- Yoshino M., Kin T., Ito A., Saito T., Nakagawa D., Ino K., Kamada K., Mori H., Kunimatsu A., Nakatomi H., Oyama H., Saito N.; Feasibility of diffusion tensor tractography for preoperative prediction of the location of the facial and vestibulocochlear nerves in relation to vestibular schwannoma, Acta Neurochirurgica, vol.157, 2015, p.939-946.
- Yoshino M., Kin T., Ito A., Saito T., Nakagawa D., Kamada K., Mori H., Kunimatsu A., Nakatomi H., Oyama H., Saito N.; Diffusion tensor tractography of normal facial and vestibulocochlear nerves, Int J Comput Assist Radiol Surg., 2014.
- Veraart J., Novikov D.S., Christiaens D., Ades-aron B., Sijbers J., Fieremans E.; Denoising of diffusion MRI using random matrix theory, NeuroImage, vol.142, 2016, p.394-406.
- Andersson J.L.R., Skare S., Ashburner J.; How to correct susceptibility distortions in spin-echo echo-planar images: application to diffusion tensor imaging, NeuroImage, vol.20(2), 2003, p.870-888.
- Andersson J.L.R., Sotiropoulos S.N.; An integrated approach to correction for off-resonance effects and subject movement in diffusion MR imaging, NeuroImage, vol. 125, 2016, p.1063-1078.
- Avants B.B., Tustison N.J., Song G., Cook P.A., Klein A., Gee J.C.; A reproducible evaluation of ANTs similarity metric performance in brain image registration, NeuroImage, vol.54, 2011, p.2033-2044.
- Tournier J.D., Calamante F., Gadian G.D., Connelly A.; Direct estimation of the fiber orientation density function from diffusion-weighted MRI data using spherical deconvolution, NeuroImage, vol.23, 2004, p.1176-1185.
- Tournier J.D., Calamante F., Gadian G.D., Connelly A.; Improved probabilistic streamlines tractography by 2nd order integration over fibre orientation distributions, Proc. Intl. Soc. Mag. Reson. Med. (ISMRM), vol.18, 2010, p.1670.
- Yushkevich P.A., Piven J., Hazlett H.C., Smith R.G., Ho S., Gee J.C., Gerig G.; User-guided 3D active contour segmentation of anatomical structures: Significantly improved efficiency and reliability, Neuroimage, vol.31, 2006, p.1116-1128.
Figures
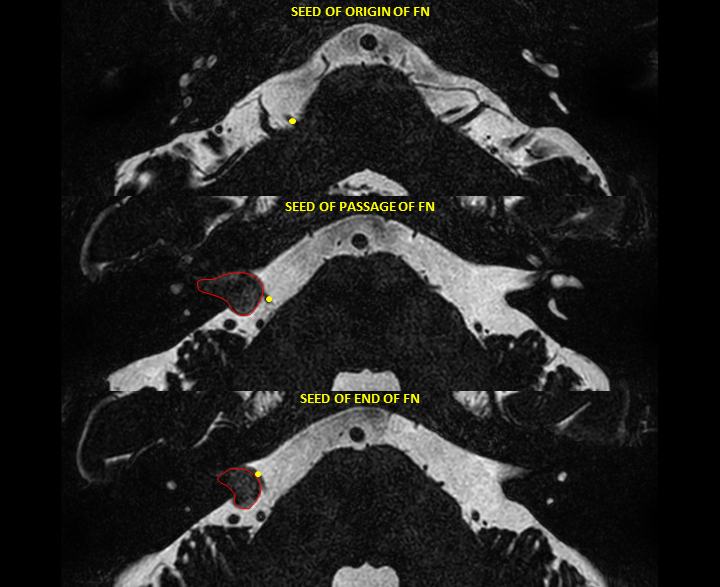
Figure 1. Axial view of the high-resolution T2-weighted image of
one of the acquired patients. The yellow points indicate the position, provided
by an expert neuroradiologist, of the initial seed set at the origin of the FN
in the brainstem (top image), of the passage seed set in the cerebellopontine
cistern (center image) and of the terminal seed set in the auditory canal (bottom
image). The tumor mass is circled out by the red line.
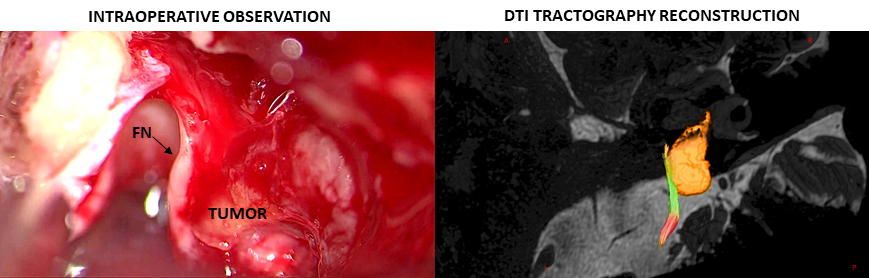
Figure 2. (Left) Intraoperative image of an acquired representative patient.
FN was found in the antero-medial portion of the tumor capsule. (Right) 3D
reconstruction of the facial nerve course using the iFOD2 algorithm. The
streamlines are displayed superposed to the high-resolution T2-weighted image. Fibers
can follow three possible directions: antero-posterior (green), right-left
(red), superior-inferior (blue). The segmented tumor mass is represented in red
scale.
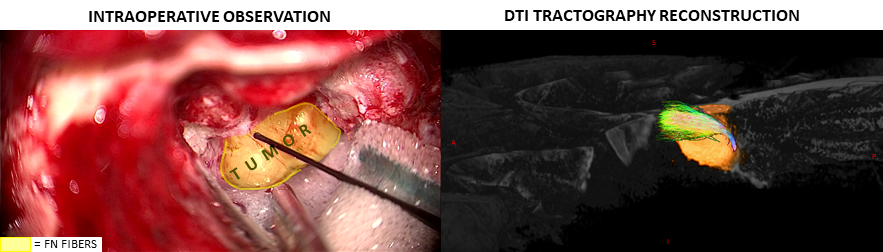
Figure 3. (Left) Intraoperative
image of one of the acquired patients described as limit case. The posterior
part of the tumor was wrapped by the fibers of the facial nerve. The nerve was
found to consist of a set of tiny fibers, represented in the figure by the yellow
area. (Right) 3D reconstruction of the facial nerve course using the iFOD2
algorithm. The streamlines are displayed superposed to the high-resolution T2-weighted
image. The fibers result in a very confused configuration on the posterior part
of the tumor capsule. The segmented tumor mass is represented in red scale.