3377
Brain tumors: a challenge for tracking algorithms1Sherbrooke Connectivity Imaging Laboratory (SCIL), Université de Sherbrooke, Sherbrooke, QC, Canada, 2Division of Neurosurgery and Neuro-Oncology, Faculty of Medicine and Health Science, University of Sherbrooke, Sherbrooke, QC, Canada, 3Imeka Solutions Inc, Sherbrooke, QC, Canada
Synopsis
In tumor cases, several fiber bundles are displaced, destroyed, or infiltrate the tumor zone. For surgical planning, it is important to have the best estimation of the bundles near the tumor and in the edema. In neurosurgical tractography, DTI is the clinical standard and most used tractography method in publications. DTI does not correctly estimate local crossing fibers and is limited by edema contamination. In this work, we compare 4 tracking algorithms (DTI, HARDI deterministic, probabilistic, a new probabilistic edema-informed) applied to tumor cases, show differences and advise on the choice of tractography algorithm to be used in neurosurgical cases.
Introduction
In diffusion MRI (dMRI), most of algorithms used are developed on healthy subjects. Applying these algorithms to neurosurgical subjects does not guarantee success and leads to difficulties due to the tumor zone affecting mask definition needed by tractography. In neurosurgical tractography, 98% of studies are based on the diffusion tensor imaging (DTI)1. The main problems of the DTI is a bad estimation of crossing fibers and also a poor reconstruction of the tensor in edema-contaminated voxel. In tumor cases, it is complicated to obtain optimal tractography in and around degenerated brain tissues (edema, necrosis, infiltrated tissue). To advice which tracking algorithm to use, this abstract compares classical methods (DTI, HARDI deterministic, HARDI probabilistic) and one new method (HARDI probabilistic edema-informed) of tractography in tumor case.Methods
- Dataset
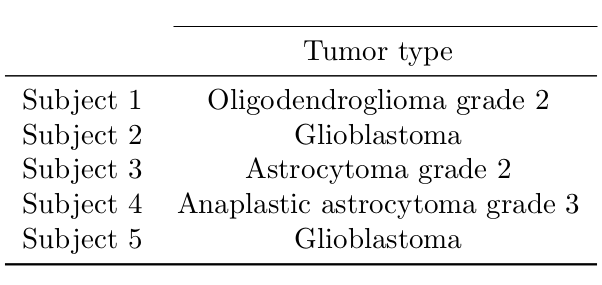
In this study, 5 tumor cases were selected. Table 1 summarizes the tumor type for each subject. Four subjects were acquired on a 1.5T MRI (Siemens, Magnetom), acquiring a 1mm T1-weighted image, dMRI with 64 directions distributed at b=1000 mm2/s and one b=0 image. One subject was done on a 3T MRI (Philips, Ingenia) with an isotropic 1mm T1 weighted image and a dMRI with 64 directions distributed at b=1500mm2/s, and one b=0 image and a reversed phase encoded b=0 image. The preprocessing performed on the dMRI (denoising, topup/eddy, N4 bias correction, DTI and fODF2,3 metrics) and the T1 (denoising, N4 correction, registration, tissue segmentation) is based on healthy subject algorithms4,5,6,7,8. For each subject, the edema and tumor regions were manually segmented and validated by our neurosurgeon.
- Tractography
Three tracking algorithms often used in healthy and neurosurgery cases were performed: DTI9, multi-peak (with the maxima extracted from the fODF)10, local fODF probabilistic tractography2,3 and one probabilistic tractography algorithm developed for tumor cases: Edema-informed anatomically constrained particle filter tractography (EI-PFT)11. The 4 tracking techniques use the same, step size, angular constraint and seeding mask as the sum of the edema and the white matter (WM) mask, with 5 seeds per voxels. Then, DTI, multi-peak and local fODF tracking use the sum of the WM and edema masks as the tracking mask. The EI-PFT uses the include and exclude maps to implement the anatomical constraints11,12.
- Bundling
For each tracking algorithm, fiber bundles were automatically extracted to evaluate the quality of the tractography. They were also visualized and selected if they were near or traversing the edema region. The fiber bundle extraction is performed with Recobundle13 and extracts 32 large WM bundles.
Results
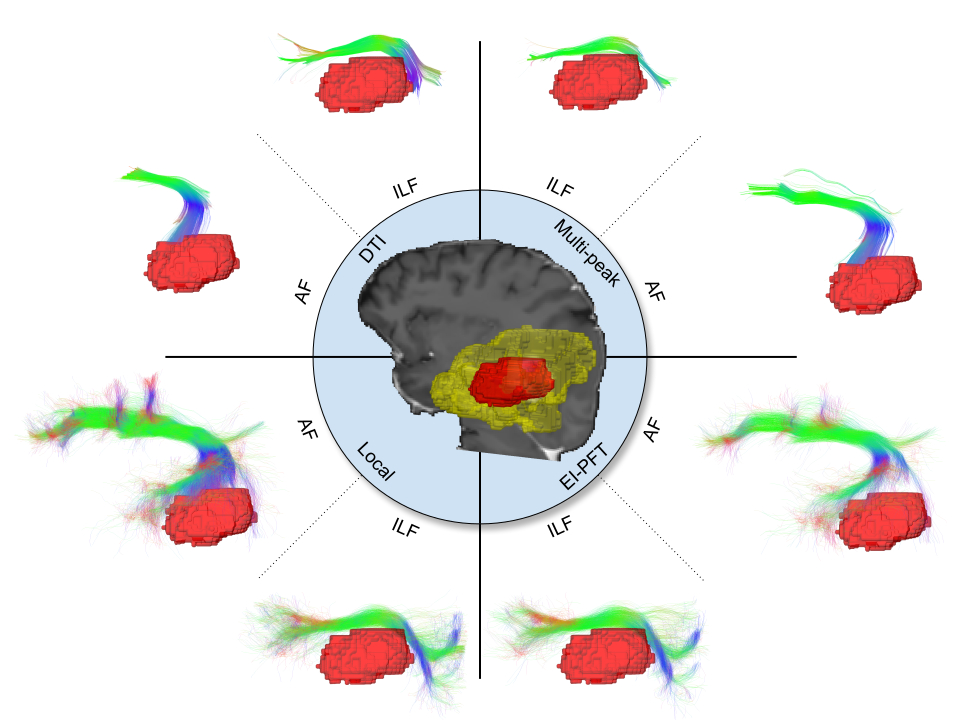
In Figure 1, the left inferior longitudinal fasciculus (ILF) and left arcuate fasciculus (AF) are displayed for each tracking method for the subject 5. The bottom part of the AF is impacted by the core of the tumor. The expected ILF shape was not recovered due to tumor deformation. The core of the tumor pushes the ILF or destroys a part of the ILF. For DTI tracking, the ILF and AF have a wrong shape (lack of fanning and bending respectively). For the multi-peak tracking, the shape of the ILF and AF is also wrong. Now for the local fODF and the EI-PFT tracking, the two bundles have an anatomically coherent shape.
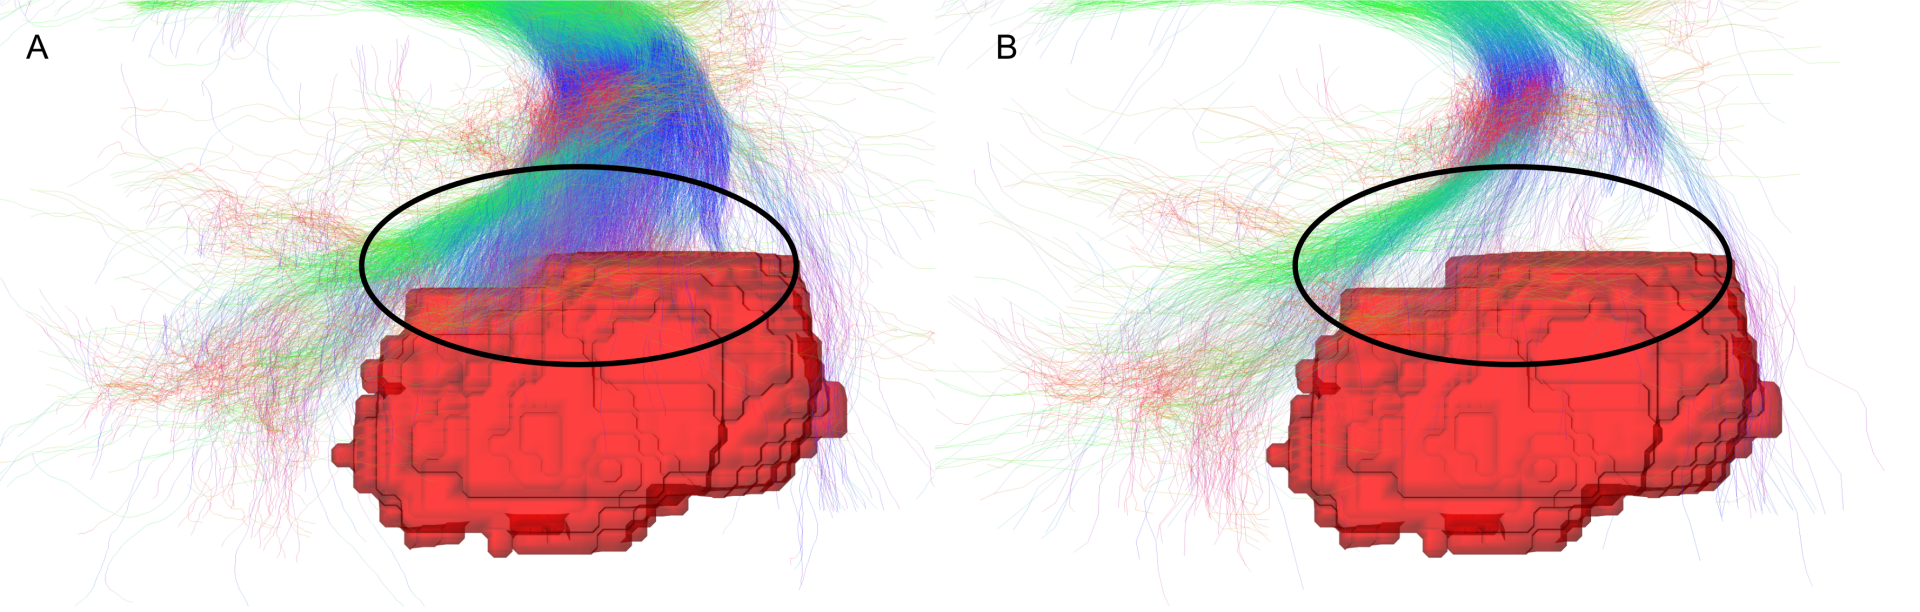
To compare the local fODF and EI-PFT tracking, the part of bundles near the tumor core and in the edema are analyzed. In Figure 2.A, streamlines from local fODF tracking are stopped by the tumor (in the circle) and unable to terminate at the cortex. In Figure 2.B, the EI-PFT tracking shows less streamlines that are stopped by the tumor and the streamlines connect the cortex, by the design of EI-PFT with ACT.
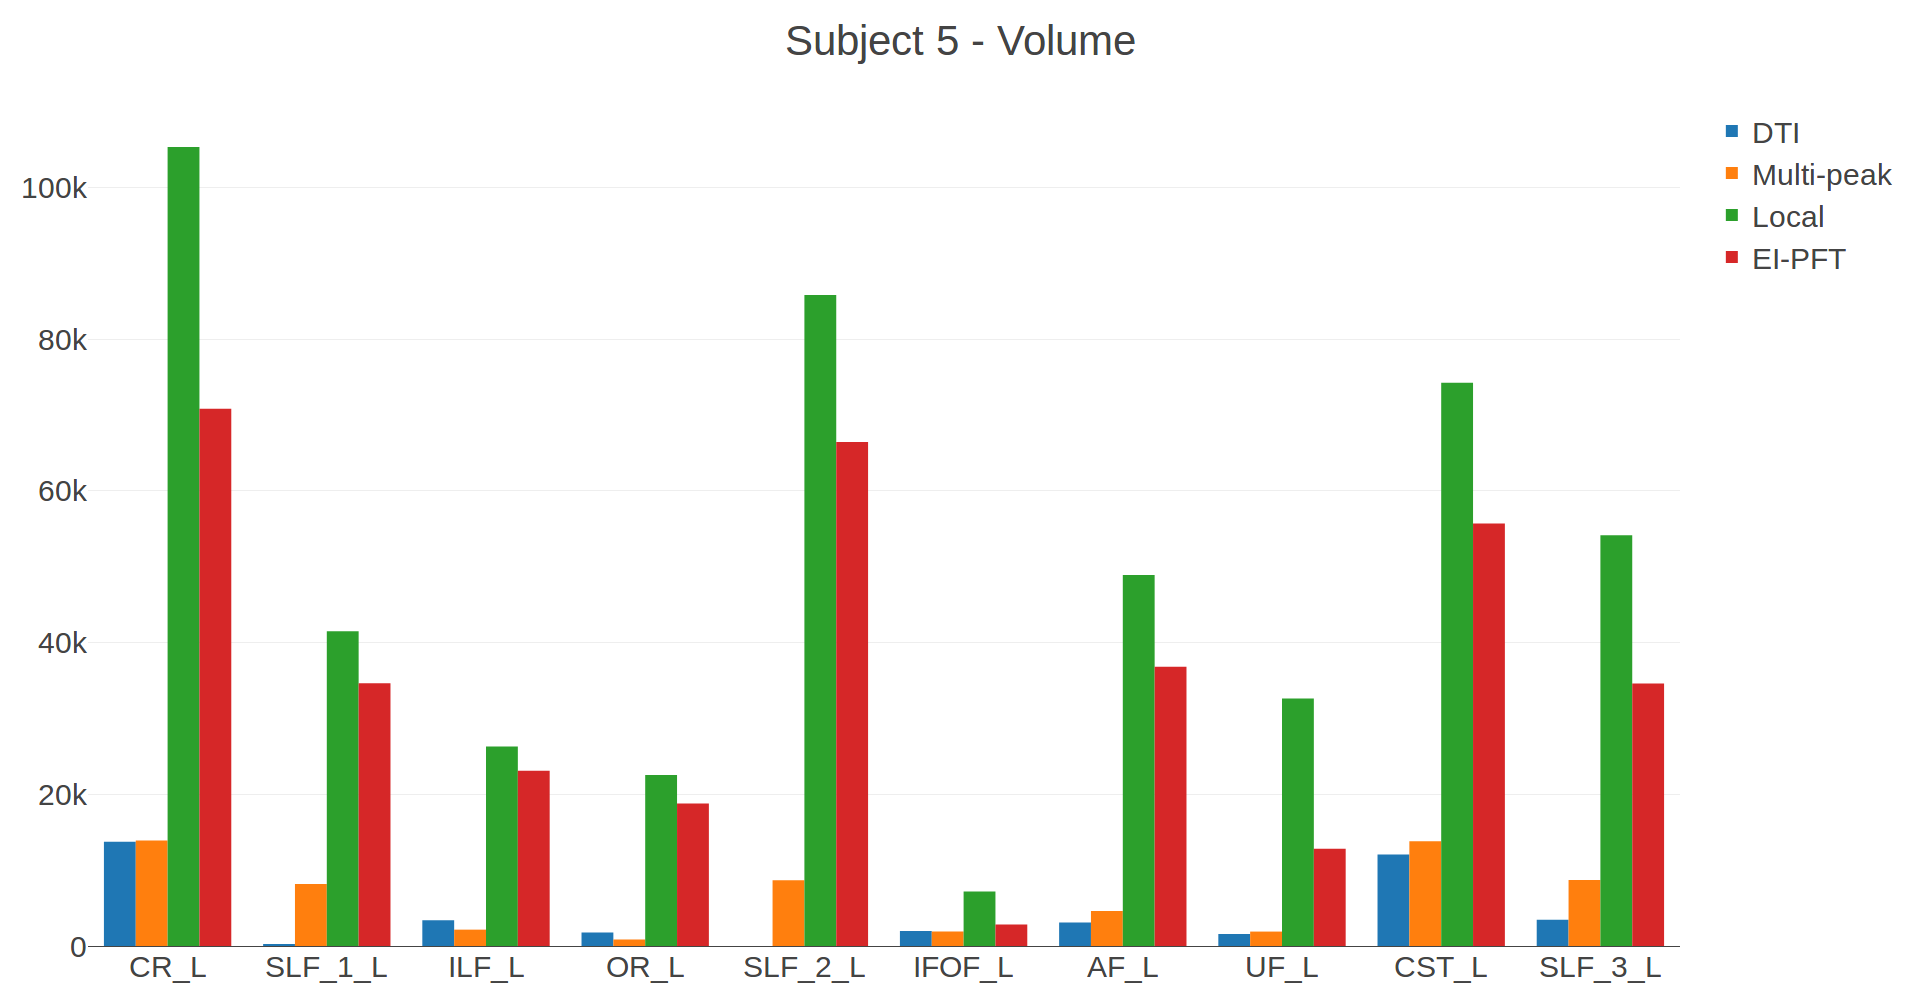
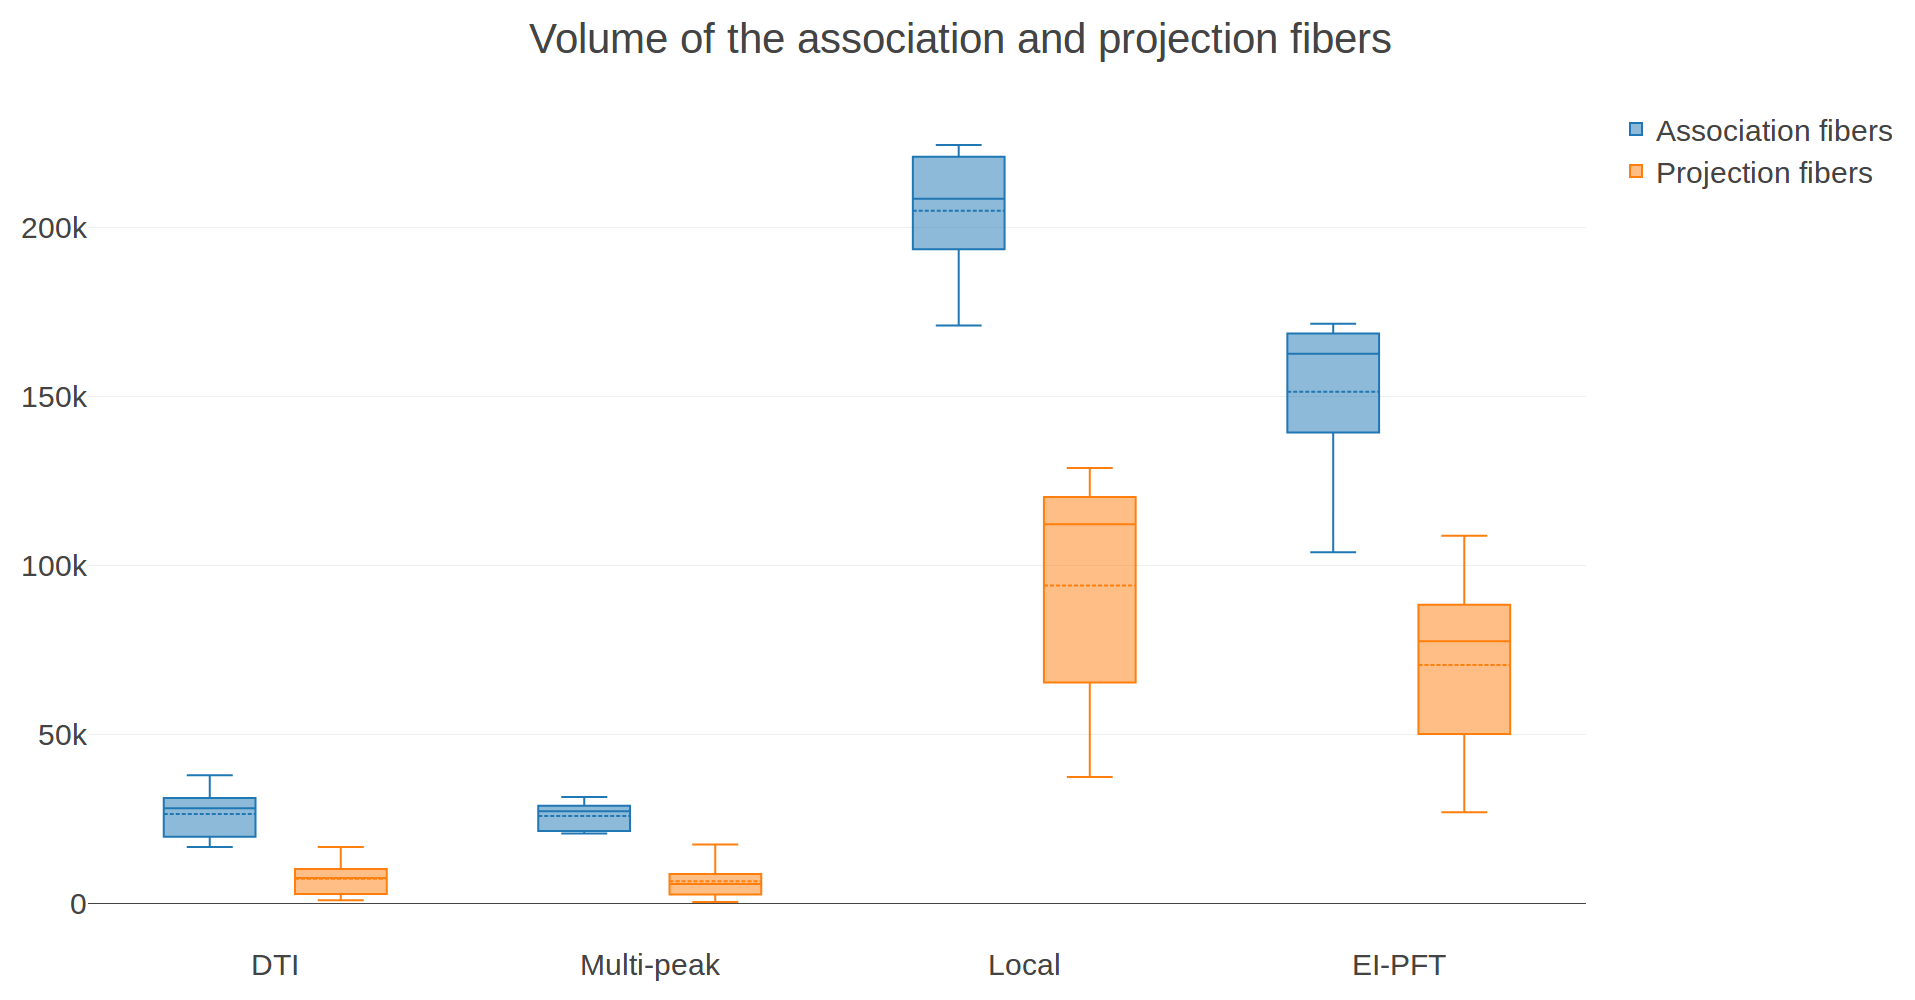
In Figure 3, for the subject 5, the volume of the bundles that are in the edema is computed. The volume of the local fODF tracking is higher than the volume of the EI-PFT tracking. The volume of the DTI and multi-peak tracking is low. In Figure 4, the volume of the association and projection fibers across the 5 subjects confirm the volume pattern shown in Figure 3.
Discussion & Conclusion
The local fODF and EI-PFT tracking are the most appropriate methods in neurosurgical tractography. These two methods give bundles with an anatomically coherent shape and a larger volume than DTI and multi-peak tracking. The local fODF tracking gives an idea about the underlying shape of the bundle but does not guarantee that streamlines connect cortex. EI-PFT tracking produces streamlines that are anatomically correct with less broken fibers than the local fODF tracking. This study shows that we need to go beyond simplistic methods and include tissue information into a surgery-robust tractography pipeline.Acknowledgements
The authors would like to thank the Fonds de recherche du Québec – Nature et technologies (FRQNT), the NSERC Discovery grant from Pr Descoteaux and Mitacs Accelerate for funding this research. We also thank the Université de Sherbrooke institutional chair in neuroinformatics for their support.References
[1] S. Farquharson, J.-D. Tournier, F. Calamante, G. Fabinyi, M. Schneider-Kolsky, G. D. Jackson, and A. Connelly, “White matter fiber tractography: why we need to move beyond dti,” Journal of neurosurgery, vol. 118, no. 6, pp. 1367–1377, 2013.
[2] J.-D. Tournier, F. Calamante, and A. Connelly, “Robust determination of the fibre orientation distribution in diffusion mri: non-negativity constrained super-resolved spherical deconvolution,” Neuroimage, vol. 35, no. 4, pp. 1459–1472, 2007.
[3] M. Descoteaux, R. Deriche, T. R. Knosche, and A. Anwander, “Deterministic and probabilistic tractography based on complex fibre orientation distributions,” IEEE transactions on medical imaging, vol. 28, no. 2, pp. 269–286, 2009.
[4] M. Jenkinson, C. F. Beckmann, T. E. Behrens, M. W. Woolrich, and S. M. Smith, “Fsl,” Neuroimage, vol. 62, no. 2, pp. 782–790, 2012.
[5] B. B. Avants, N. Tustison, and G. Song, “Advanced normalization tools (ants),” Insight j, vol. 2, pp. 1–35, 2009.
[6] E. Garyfallidis, M. Brett, B. Amirbekian, A. Rokem, S. Van Der Walt, M. Descoteaux, and I. Nimmo-Smith, “Dipy, a library for the analysis of diffusion mri data,” Frontiers in neuroinformatics, vol. 8, p. 8, 2014.
[7] J. L. Andersson, S. Skare, and J. Ashburner, “How to correct susceptibility distortions in spin-echoecho-planar images: application to diffusion tensor imaging,” Neuroimage, vol. 20, no. 2, pp. 870–888, 2003.
[8] S. M. Smith, M. Jenkinson, M. W. Woolrich, C. F. Beckmann, T. E. Behrens, H. Johansen-Berg,P. R. Bannister, M. De Luca, I. Drobnjak, D. E. Flitney, et al., “Advances in functional and structural mr image analysis and implementation as fsl,” Neuroimage, vol. 23, pp. S208–S219, 2004.
[9] P. J. Basser and D. K. Jones, “Diffusion-tensor mri: theory, experimental design and data analysis a technical review,” NMR in Biomedicine: An International Journal Devoted to the Development and Application of Magnetic Resonance In Vivo, vol. 15, no. 7-8, pp. 456–467, 2002.
[10] M. Chamberland, K. Whittingstall, D. Fortin, D. Mathieu, and M. Descoteaux, “Real-time multi-peak tractography for instantaneous connectivity display,” Frontiers in neuroinformatics, vol. 8, p. 59, 2014.
[11] S. Deslauriers-Gauthier, D. Parker, F. Rheault, R. Deriche, S. Brem, M. Descoteaux, and R. Verma, “Edema-informed anatomically constrained particle filter tractography,” in International Conference on Medical Image Computing and Computer-Assisted Intervention, pp. 375–382, Springer, 2018.
[12] G. Girard, K. Whittingstall, R. Deriche, and M. Descoteaux, “Towards quantitative connectivity analysis: reducing tractography biases,” Neuroimage, vol. 98, pp. 266–278, 2014.
[13] E. Garyfallidis, M.-A. Cˆot ́e, F. Rheault, J. Sidhu, J. Hau, L. Petit, D. Fortin, S. Cunanne, and M. Descoteaux, “Recognition of white matter bundles using local and global streamline-based registration and clustering,” NeuroImage, 2017
Figures