3376
Tractostorm: Evaluation of intra and inter rater reproducibility in tractography dissection1Computer Sciences, Université de Sherbrooke, Sherbrooke, QC, Canada, 2IMN UMR 5293, Université de Bordeaux, Bordeaux, France
Synopsis
Investigative studies of white matter structures using tractography often require manual virtual bundle dissection to be performed. Human errors and personal decisions make these manual segmentations hard to reproduce. Reproducibility assessment of raters is common practice in other neuroimaging field where segmentation protocols were refined to maximize reproducibility. However, this has not been done in the field of diffusion tractography. The contribution of this study is to provide the first large-scale, multi-center variability assessment of virtual dissection of tractography dataset.
Introduction
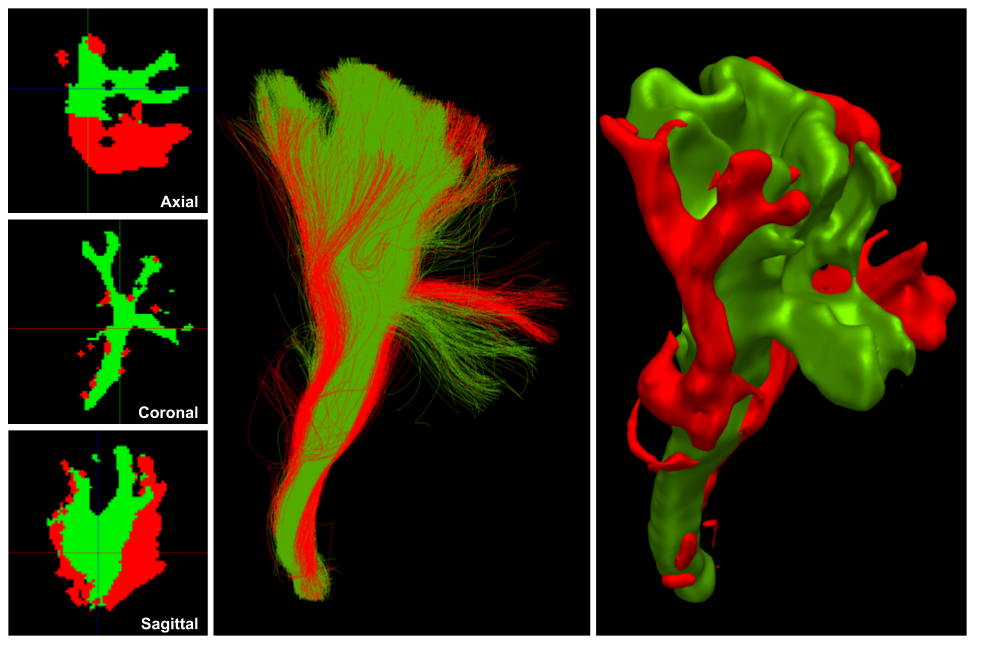
Studies of white matter (WM) neuroanatomy using diffusion MRI tractography often require manual bundle segmentation performed by neuroanatomical experts. This manual process is often called virtual dissection. Inclusion and exclusion regions-of-interests (ROIs) are drawn and defined at the voxel-level using structural images, which are then used to select streamlines produced by tractography [1, 2]. The aim of the work is i) to quantify the reproducibility of raters performing manual bundle segmentation and ii) to explore quantitative approaches for bundle comparisons. [3]Methods
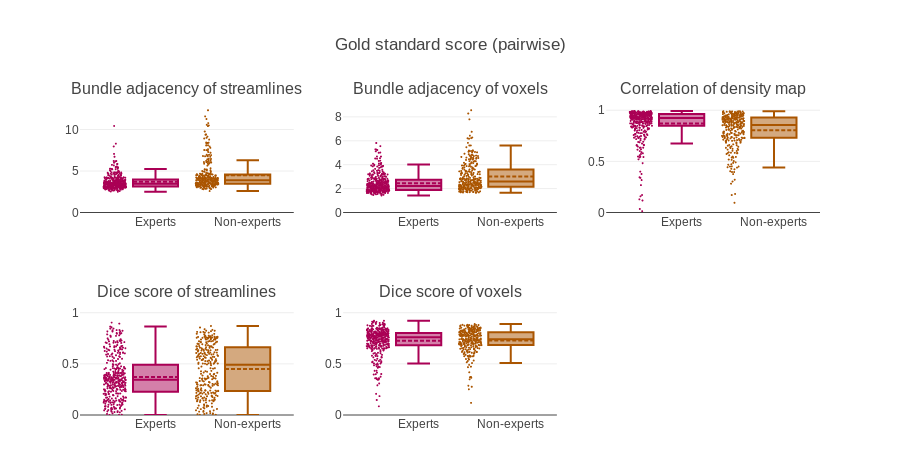
Twenty-four participants were recruited and divided into two groups: experts and non-experts. The division was based on their neuroanatomical educational background. Five independent tractograms were used, each was triplicated (total of 15). One was left untouched, one was flipped in the X axis (left/right) and one was translated. All datasets were randomly named so the tasks could be performed blindly for each participant. Duplicated datasets were used to score the intra-rater agreement and the multiple participants to evaluate inter-rater agreement. Each participant received a document containing instructions for the segmentation of the pyramidal tract (PyT left and right) and a general overview of the segmentation as example. Segmentation involved using 3 WM inclusions ROIs (Internal capsule, Midbrain and Medulla Oblongata) and 2 exclusion ROIs (one plane anterior to the precentral gyrus and one plane posterior to the postcentral gyrus). [4] Each participant performed the same tasks on each triplicate (to evaluate intra-rater reproducibility) and all participants had access to the same datasets (to evaluate inter-rater reproducibility). When multiple raters provide segmentation from an identical dataset, it is interesting to produce a gold standard. Using the voxel or streamlines representation it is possible to assign a value to each voxel or streamline representing the probability of being counted in by the raters.
Results
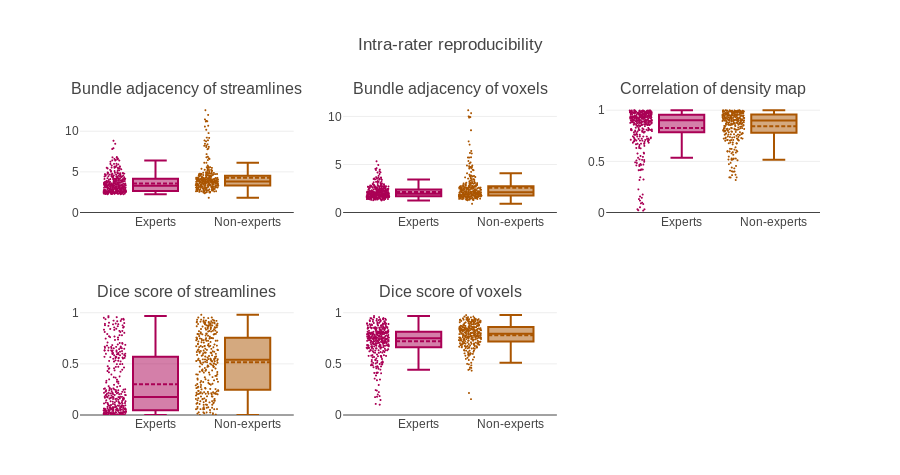
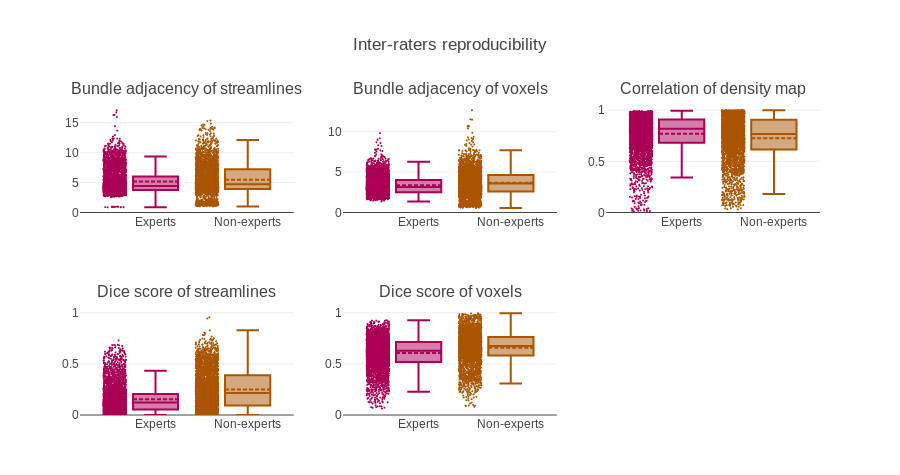
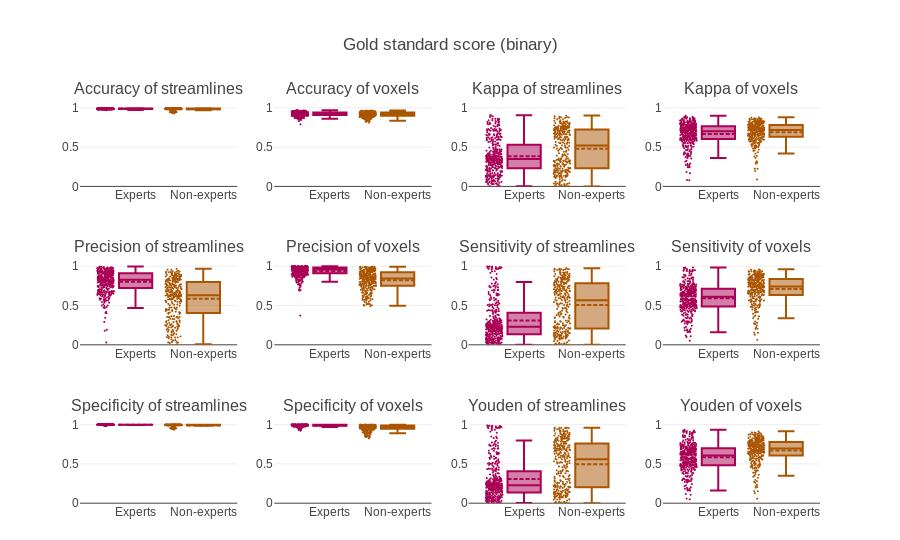
For this project intra-rater overlap (Dice) scored around 75% while inter-rater overlap scored approximately at 65%. Bundle-adjacency was approximately 2.5mm and 3.5mm for intra-rater and inter-rater respectively [5]. Correlation was approximately 0.85 and 0.75 for intra-rater and inter-rater respectively. When compared to the group average (gold standard) most true negatives and a moderate amount of true positives are obtained with relative ease but the results depict a lack of precision, i.e. 99% specificity, 60-70% sensitivity and 85% precision. More measures (median and interquartile range) are available in the figures. The values reported above are for the voxel-wise representation.Discussion
A single measure is often used to portray a complex phenomenon, e.g. overlap of voxels, represented by the Dice coefficient. However, using the full streamline representation could be insightful. In this work, the Dice score (overlap), distance (similarity) and the correlation (density coherence) ended up being the main measures used to quickly interpret agreement between datasets. However, streamlines-wise measures show lower agreement, meaning that reproducible results are likely more difficult to achieve with the streamlines representation. This indicates a strong need for clear protocols for each bundle or at least detailed documents coming with publications that used manual segmentation. In this work, a single bundle of interest was investigated, the extension to other bundles of interest or other segmentation plan is not trivial and the only conclusion that stand is that agreement is never 100%. The desire to simplify measures or have only one value to describe quality or reproducibility of segmentation need to be repressed. The nature of our datasets makes this task much more complex to interpret than 2D or 3D images.
Conclusion
Similarly to other neuroimaging field, such as deep nuclei segmentation, standardized protocols for tractography segmentation need to be developed and designed to be used across multiple center without active collaboration or micromanagement.In situations where a segmentation plan can be defined in groups and techniques can be improved along iterations of the plan, the intra-rater and inter-rater agreement would likely go up.Acknowledgements
We would like to thank Jasmeen Sidhu from the Sherbrooke Connectivity Imaging Lab (SCIL) for her help during the design of the study. The authors would like to thank the Fonds de recherche du Québec – Nature et technologies (FRQNT) and NSERC Collaborative Research and Training Experience Program in Medical Image Analysis (CREATE-MIA) for funding this research. We also thank the Université de Sherbrooke institutional chair in neuroinformatics for their support.
References
[1] Catani, M., Howard, R.J., Pajevic, S. and Jones, D.K., 2002. Virtual in vivo interactive dissection of white matter fasciculi in the human brain. Neuroimage, 17(1), pp.77-94.
[2] Catani, M. and De Schotten, M.T., 2008. A diffusion tensor imaging tractography atlas for virtual in vivo dissections. cortex, 44(8), pp.1105-1132.
[3] Gwet, K.L., 2014. Handbook of inter-rater reliability: The definitive guide to measuring the extent of agreement among raters. Advanced Analytics, LLC.
[4] Chenot, Q., Tzourio-Mazoyer, N., Rheault, F., Descoteaux, M., Crivello, F., Zago, L., Mellet, E., Jobard, G., Joliot, M., Mazoyer, B. and Petit, L., 2018. A probabilistic atlas of the human pyramidal tract in 410 healthy participants. bioRxiv, p.251108
[5] Garyfallidis, E., Côté, M.A., Rheault, F., Sidhu, J., Hau, J., Petit, L., Fortin, D., Cunanne, S. and Descoteaux, M., 2017. Recognition of white matter bundles using local and global streamline-based registration and clustering. NeuroImage.
Figures