3375
Towards a deep learning model for diffusion-aware tractogram filtering1KTH Royal Institute of Technology, Stockholm, Sweden, 2Université de Sherbrooke, Sherbrooke, QC, Canada
Synopsis
We propose a deep learning model that is able to separate a tractogram into sets of anatomically plausible and implausible streamlines. In contrast to existing methods, our model relies solely on the measured diffusion signal as an input ensuring independence of potential misalignments between subjects. The model is shown to generalize to different tractography methods and has the potential to simultaneously learn from multiple supervisor methods.
Introduction
Despite decades of active research, it has been shown that state-of-the-art diffusion magnetic resonance imaging (dMRI) tractography methods produce tractograms that contain large amounts of anatomically implausible streamlines.1 Methods for tractogram filtering address this issue by retrospectively extracting a subset of anatomically plausible streamlines from a given tractogram. While classical strategies follow atlas-based2,3 or simulation-based approaches,4,5 new machine learning (ML) methods have recently been proposed.6,7 These are binary classifiers which take as input a series of $$$(x, y, z)$$$ tractogram feature points and output a binary class label. In contrast to that, we propose a classifier which implements a convolutional neural network (CNN) that relies solely on the diffusion signal as input. By doing so, our method is a) independent of potential misalignments between subjects, and b) able to learn characteristics of the actual diffusion signal along anatomically plausible white matter bundles.Dataset
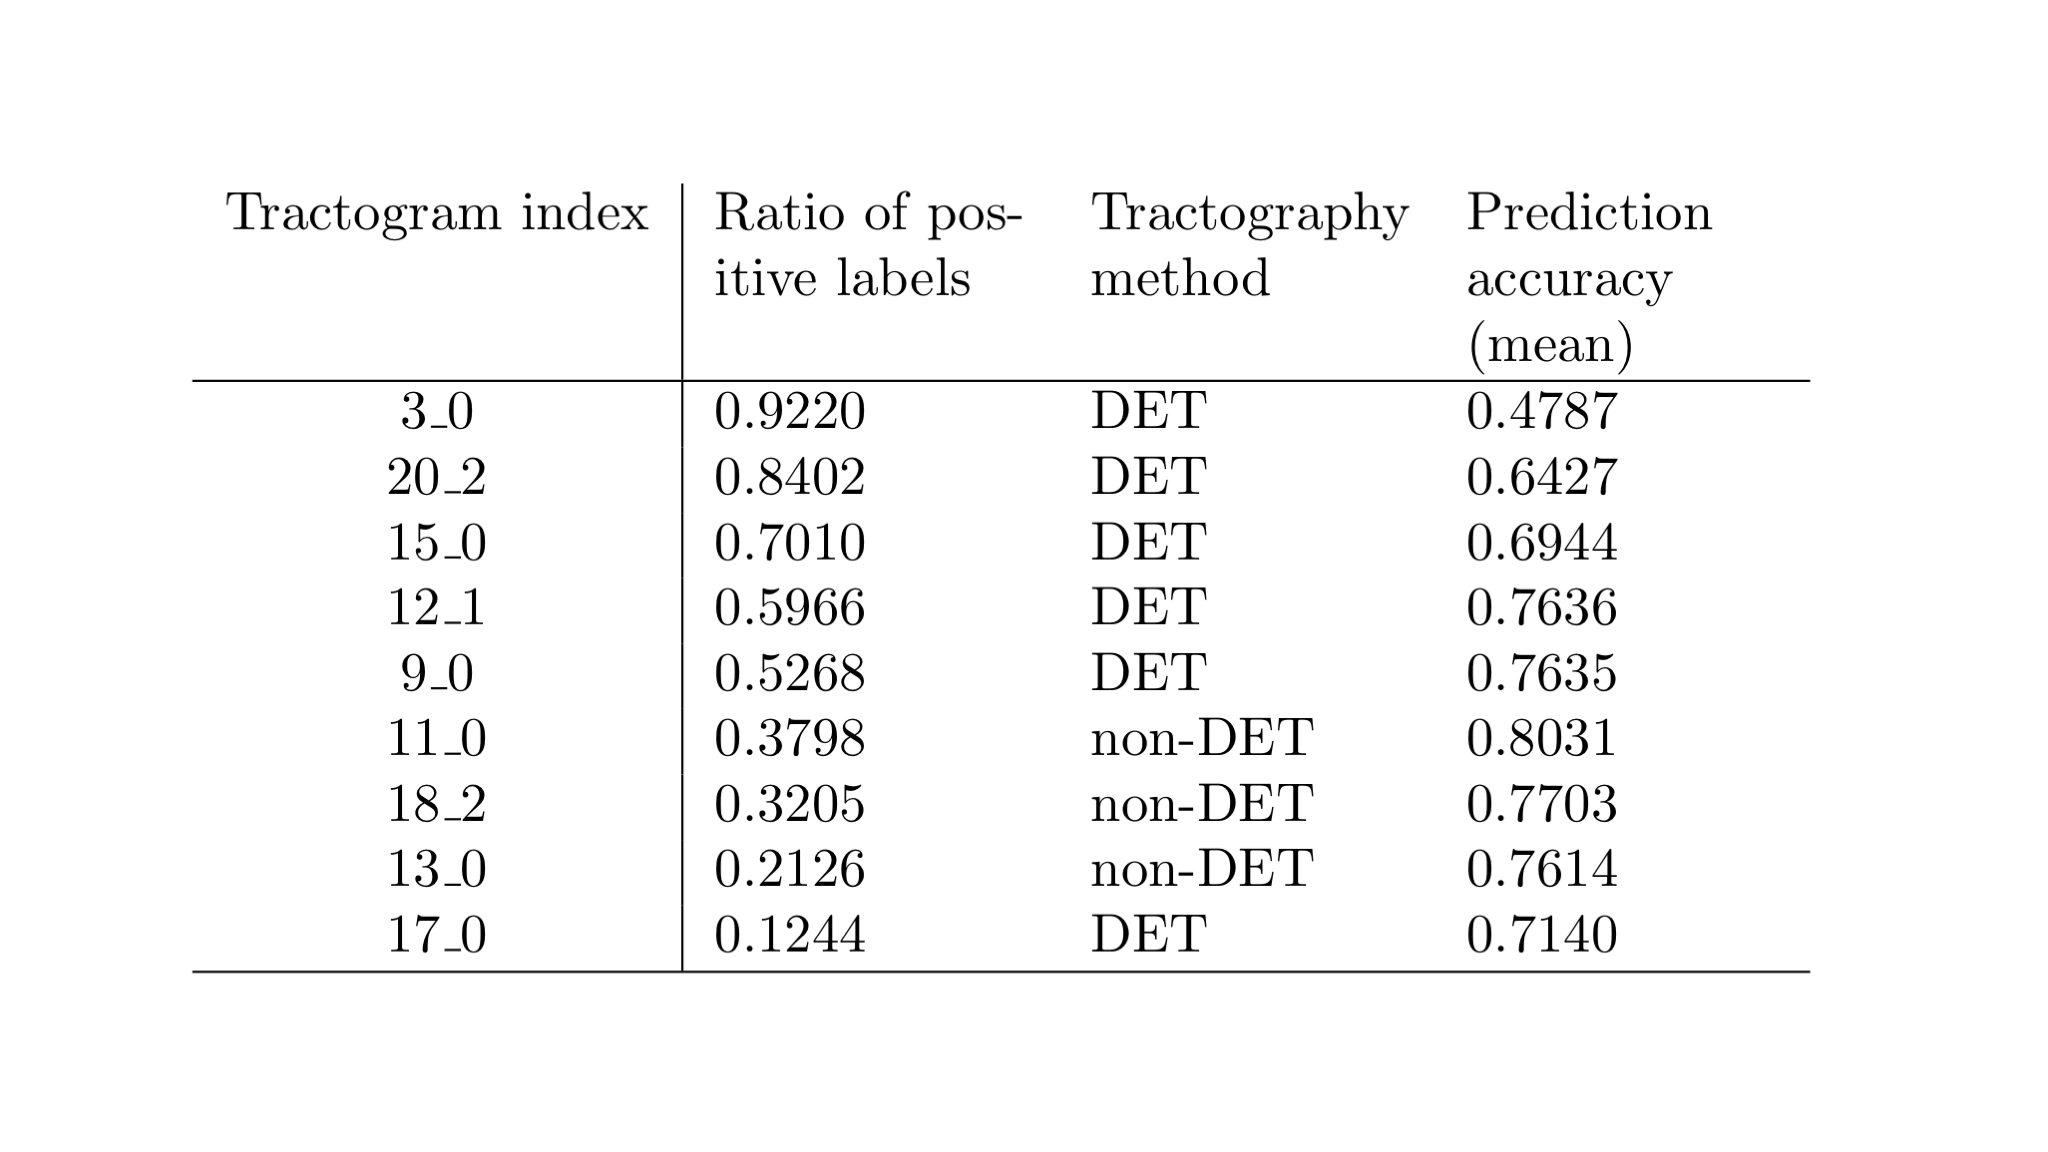
In our experiments we utilize the setup of the ISMRM 2015 tractography challenge1 for evaluation. We picked 9 of the 96 originally submitted tractograms featuring a different balance of true and false positive streamlines (cf. Table 1) defined by the underlying ground truth. Furthermore, a tractogram is obtained for the corresponding HCP subject (100307) utilizing global tractography.8,9 Method
Method
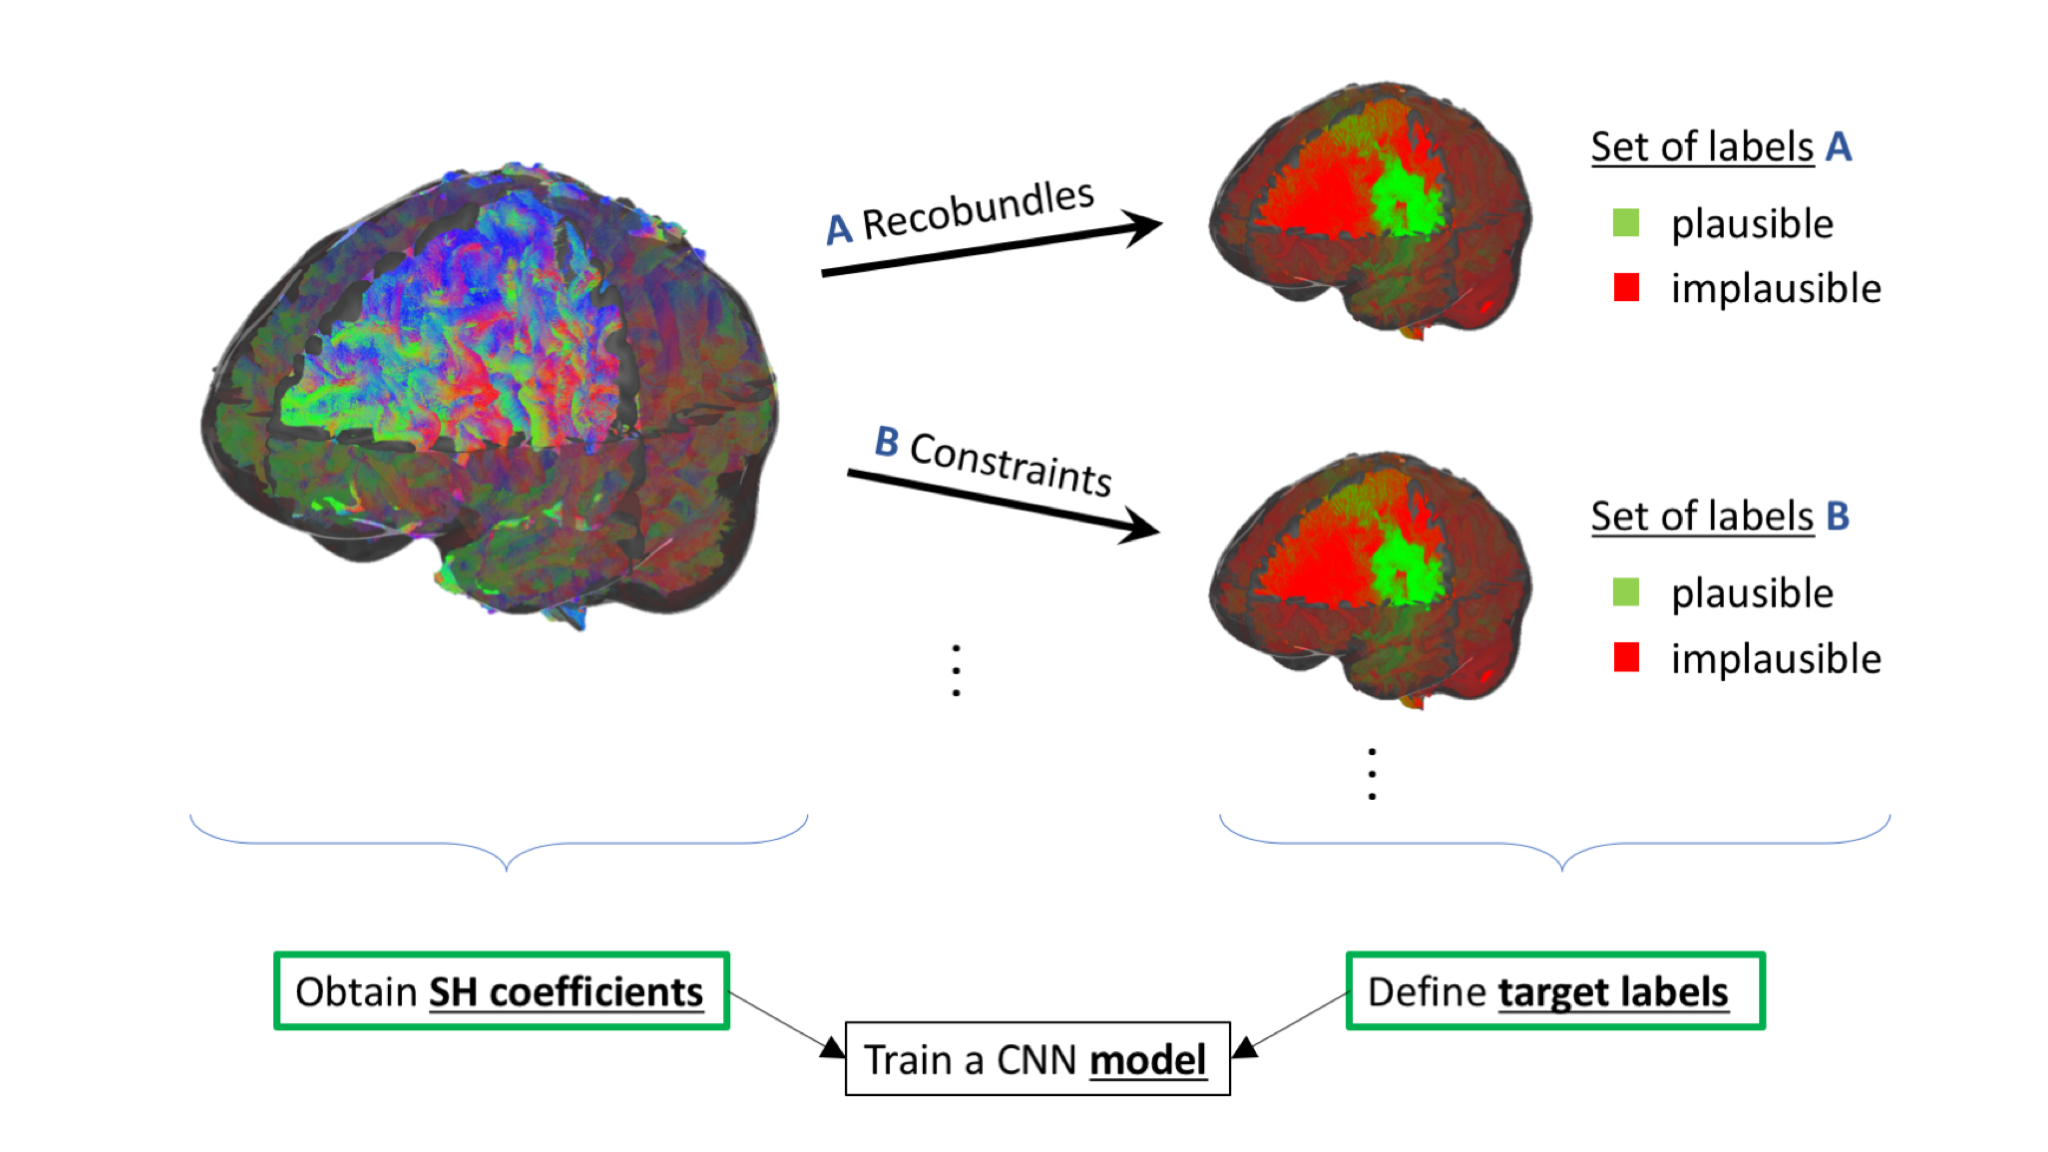
We implemented a CNN model which we trained to determine for each streamline a binary label indicating if the streamline is anatomically plausible or not (cf. Fig. 1). As input to the model, we sample the 4th order spherical harmonics representation (i.e. 15 coefficients) of the diffusion signal at 50 equidistant spatial positions along the given streamline, treating each coefficient as a separate input channel. Our model consists of 3 convolutional layers each consisting of convolution (channels: 416, 208, 104), batch norm and ReLU activation; the second layer incorporates additional max pooling of factor 2. The channels of the last layer are concatenated and the classification label is obtained from a fully connected layer with softmax activation over 2 outputs. During training, a cross-entropy loss between the softmax output and ground truth label is optimized using Adam.10
A classifier is trained for each of the 9 challenge tractograms using the challenge evaluation as target labels. Additionally, we trained three models on the tractogram of the HCP subject employing different sets of anatomically plausible and implausible training labels (cf. Fig. 1) obtained from:
- Recobundles2 (plausible: recognized streamlines from 22 bundles, implausible: not recognized streamlines);
- Constraints: A set of explicitly defined geometrical and anatomical constraints for valid streamline paths (plausible: streamlines not violating constraints, implausible: streamlines violating at least one constraint);
- Merged: A set obtained from merging 1 and 2.
Evaluation
The performance of our CNN on a specific challenge submission is evaluated with different metrics assessing the quality of the subsets of streamlines with positive (plausible) and negative (implausible) labels. We report accuracy, false positive rate, and false negative rate as well as several Tractometer metrics.11Results and Discussion
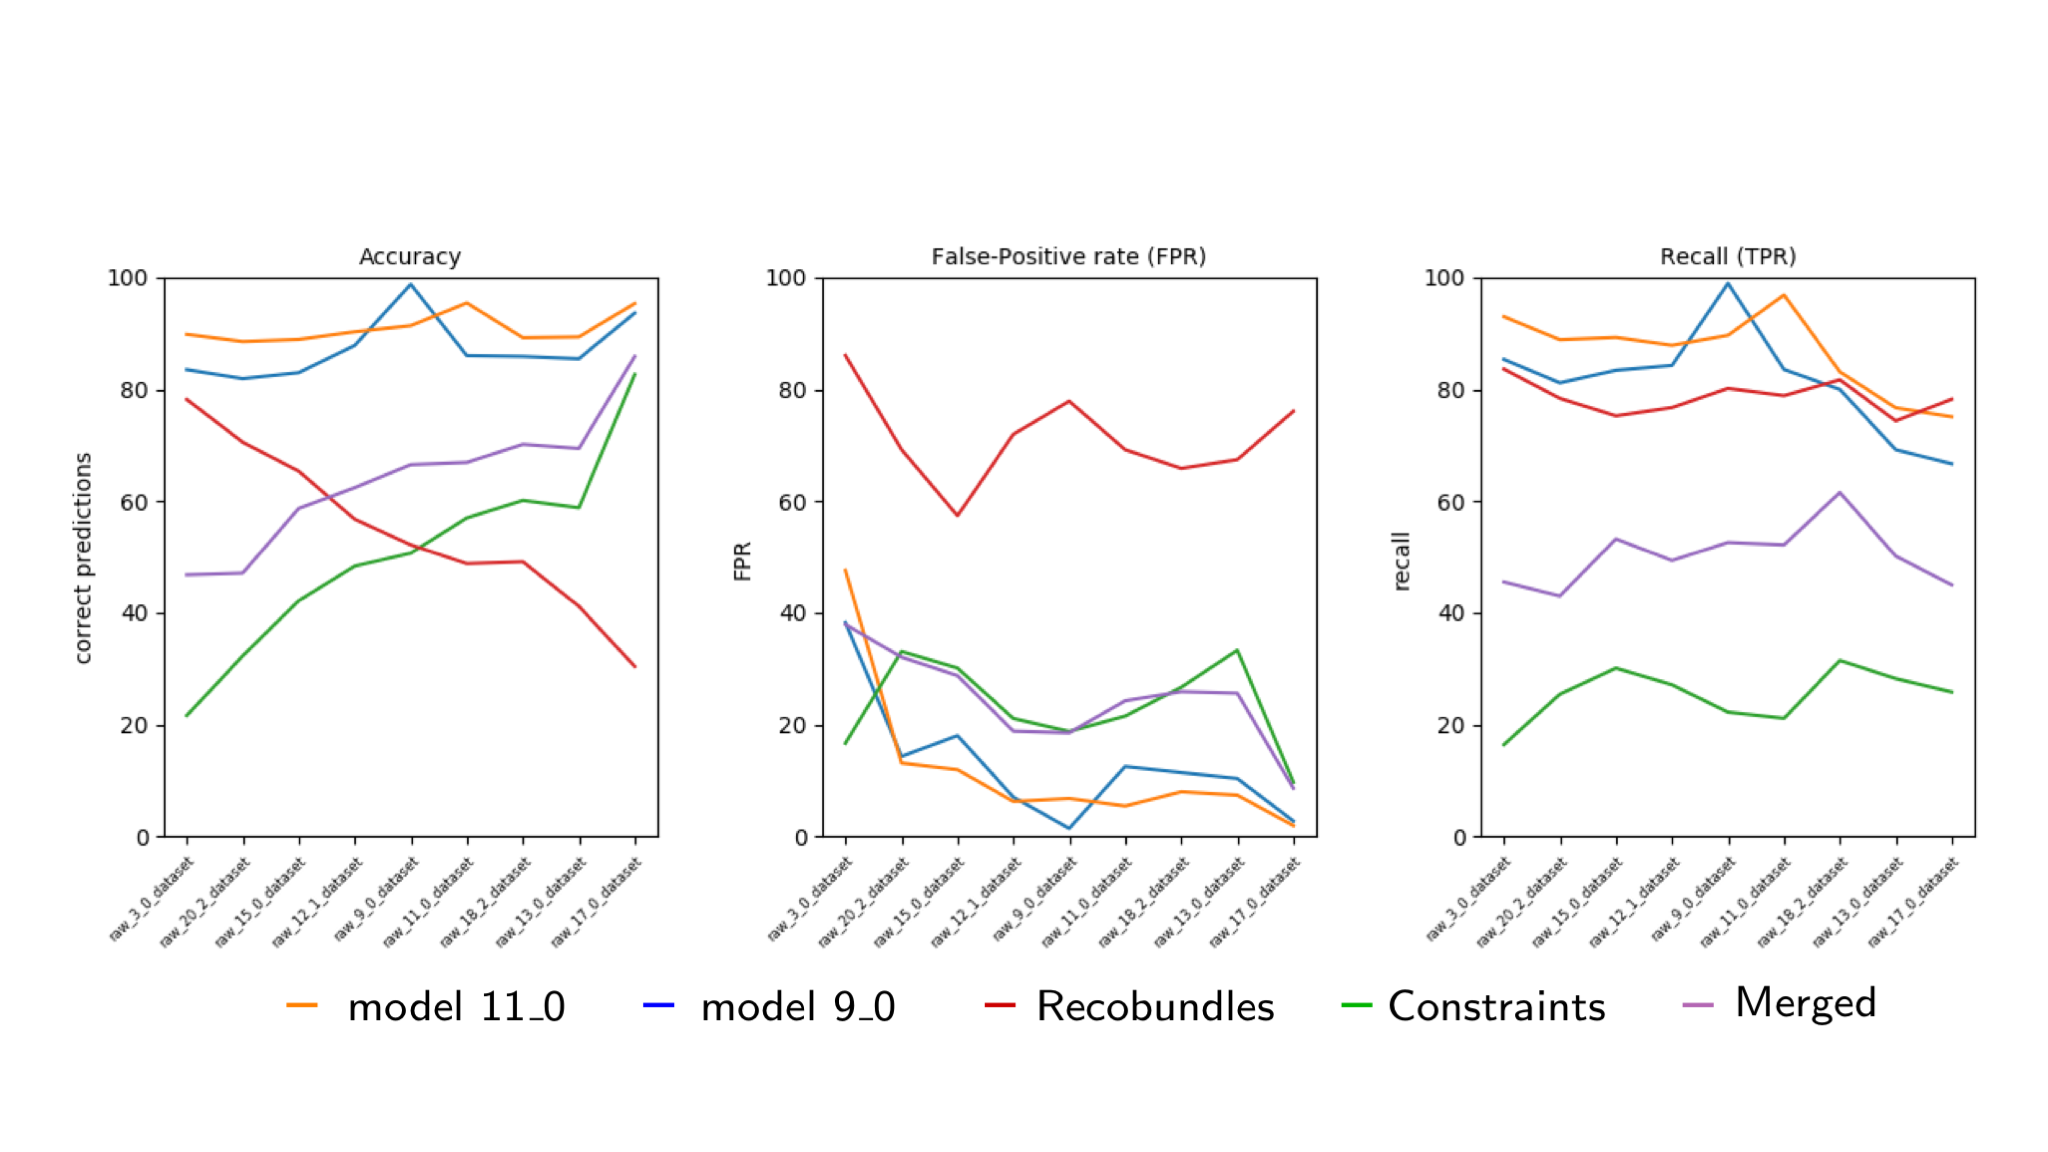
For each of the 9 models, which are trained on the challenge dataset, we compared the achieved prediction accuracy averaged over the selected original challenge submissions (Table 1). As one would expect, training on a non-deterministic tractogram (11_0) leads to better generalization behaviour across different tractograms compared to a deterministic one, i.e. 9_0 (c.f. Fig. 2 where the model 11_0 yellow curve is almost always better than the model 9_0 blue curve). We attribute this effect to the property of non-deterministic tractography to create streamlines which are not smooth.
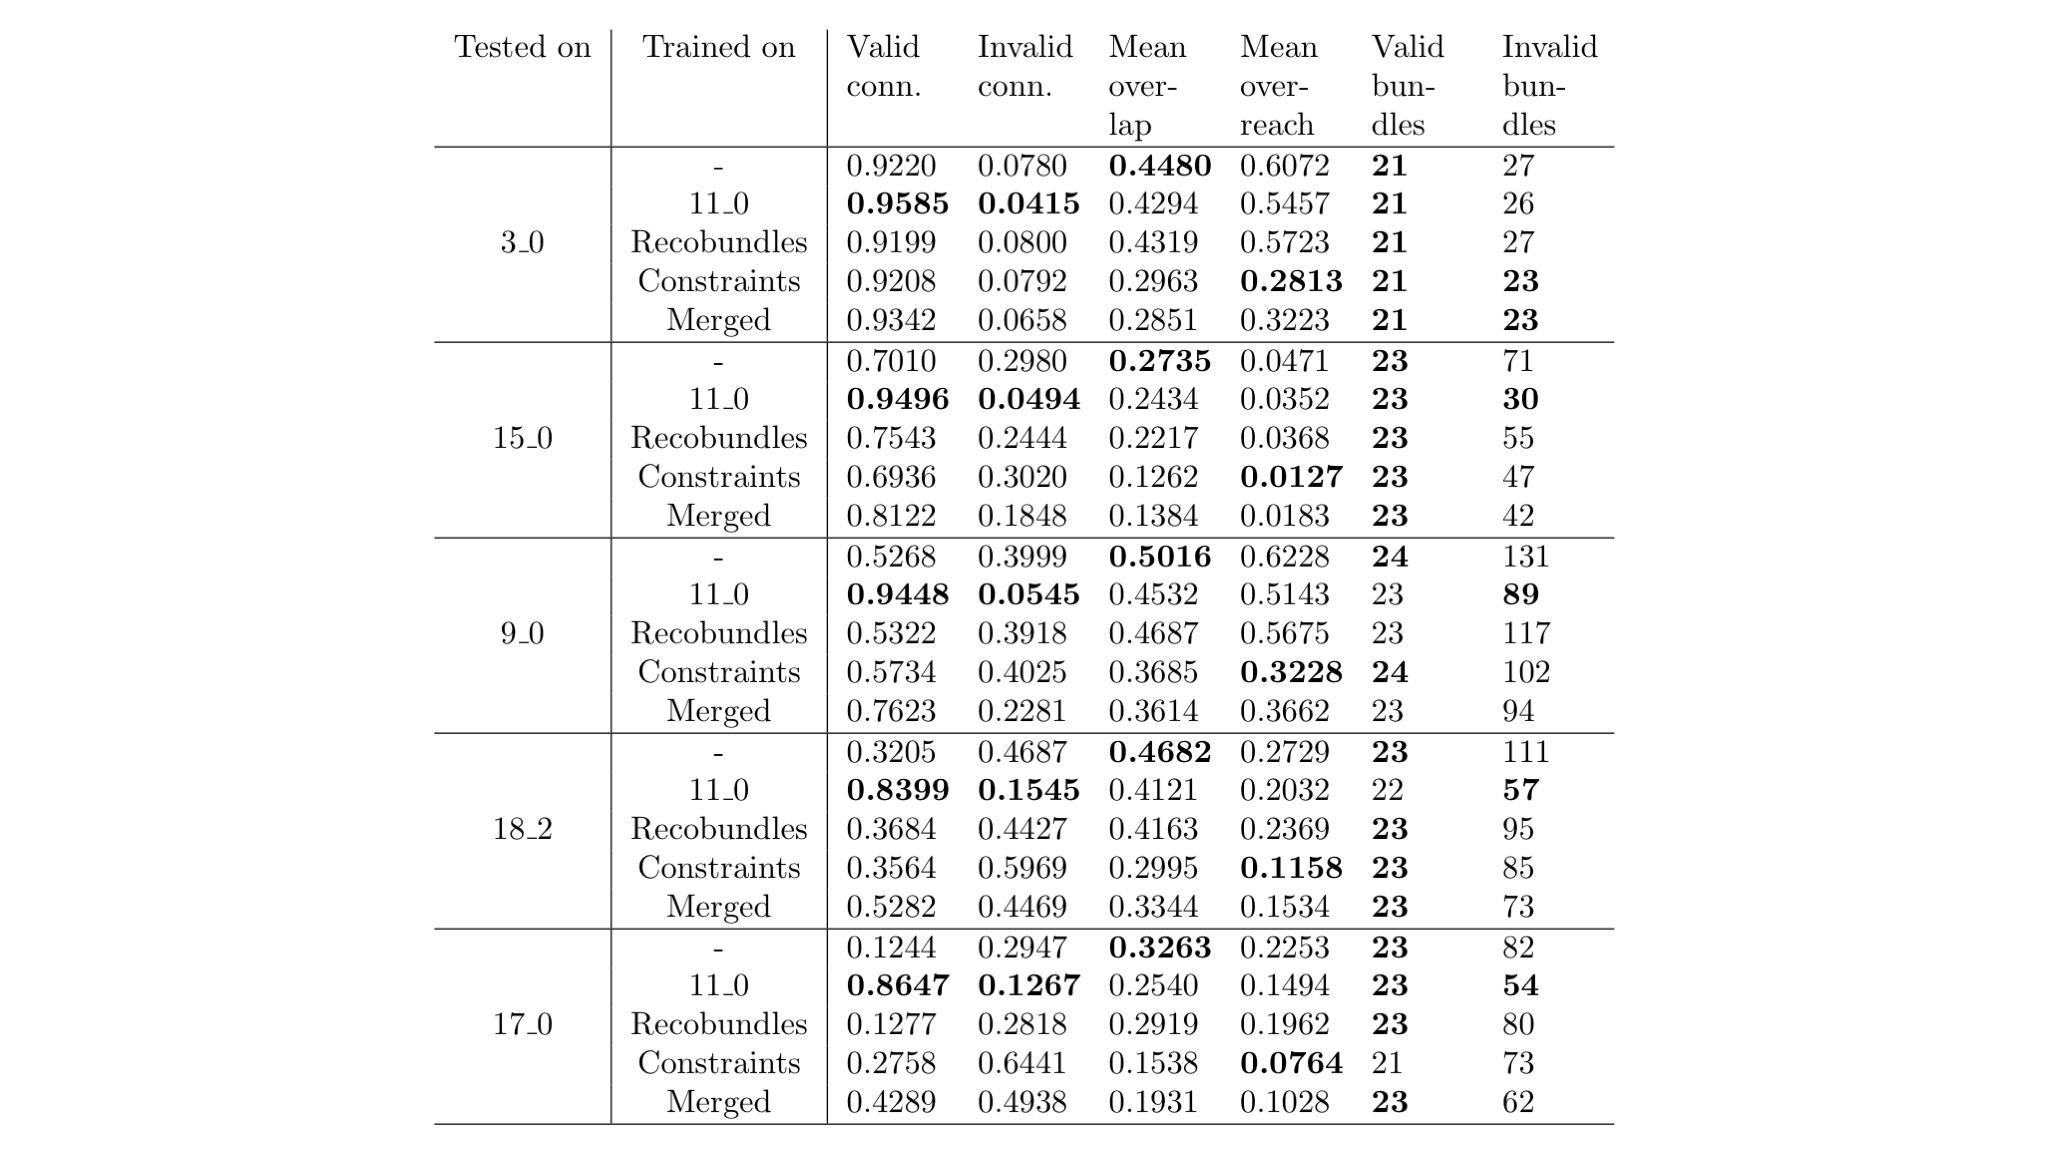
Table 2 shows that the best performing model (trained on 11_0) improves most Tractometer metrics for the chosen submissions when used as a subsequent filtering step.
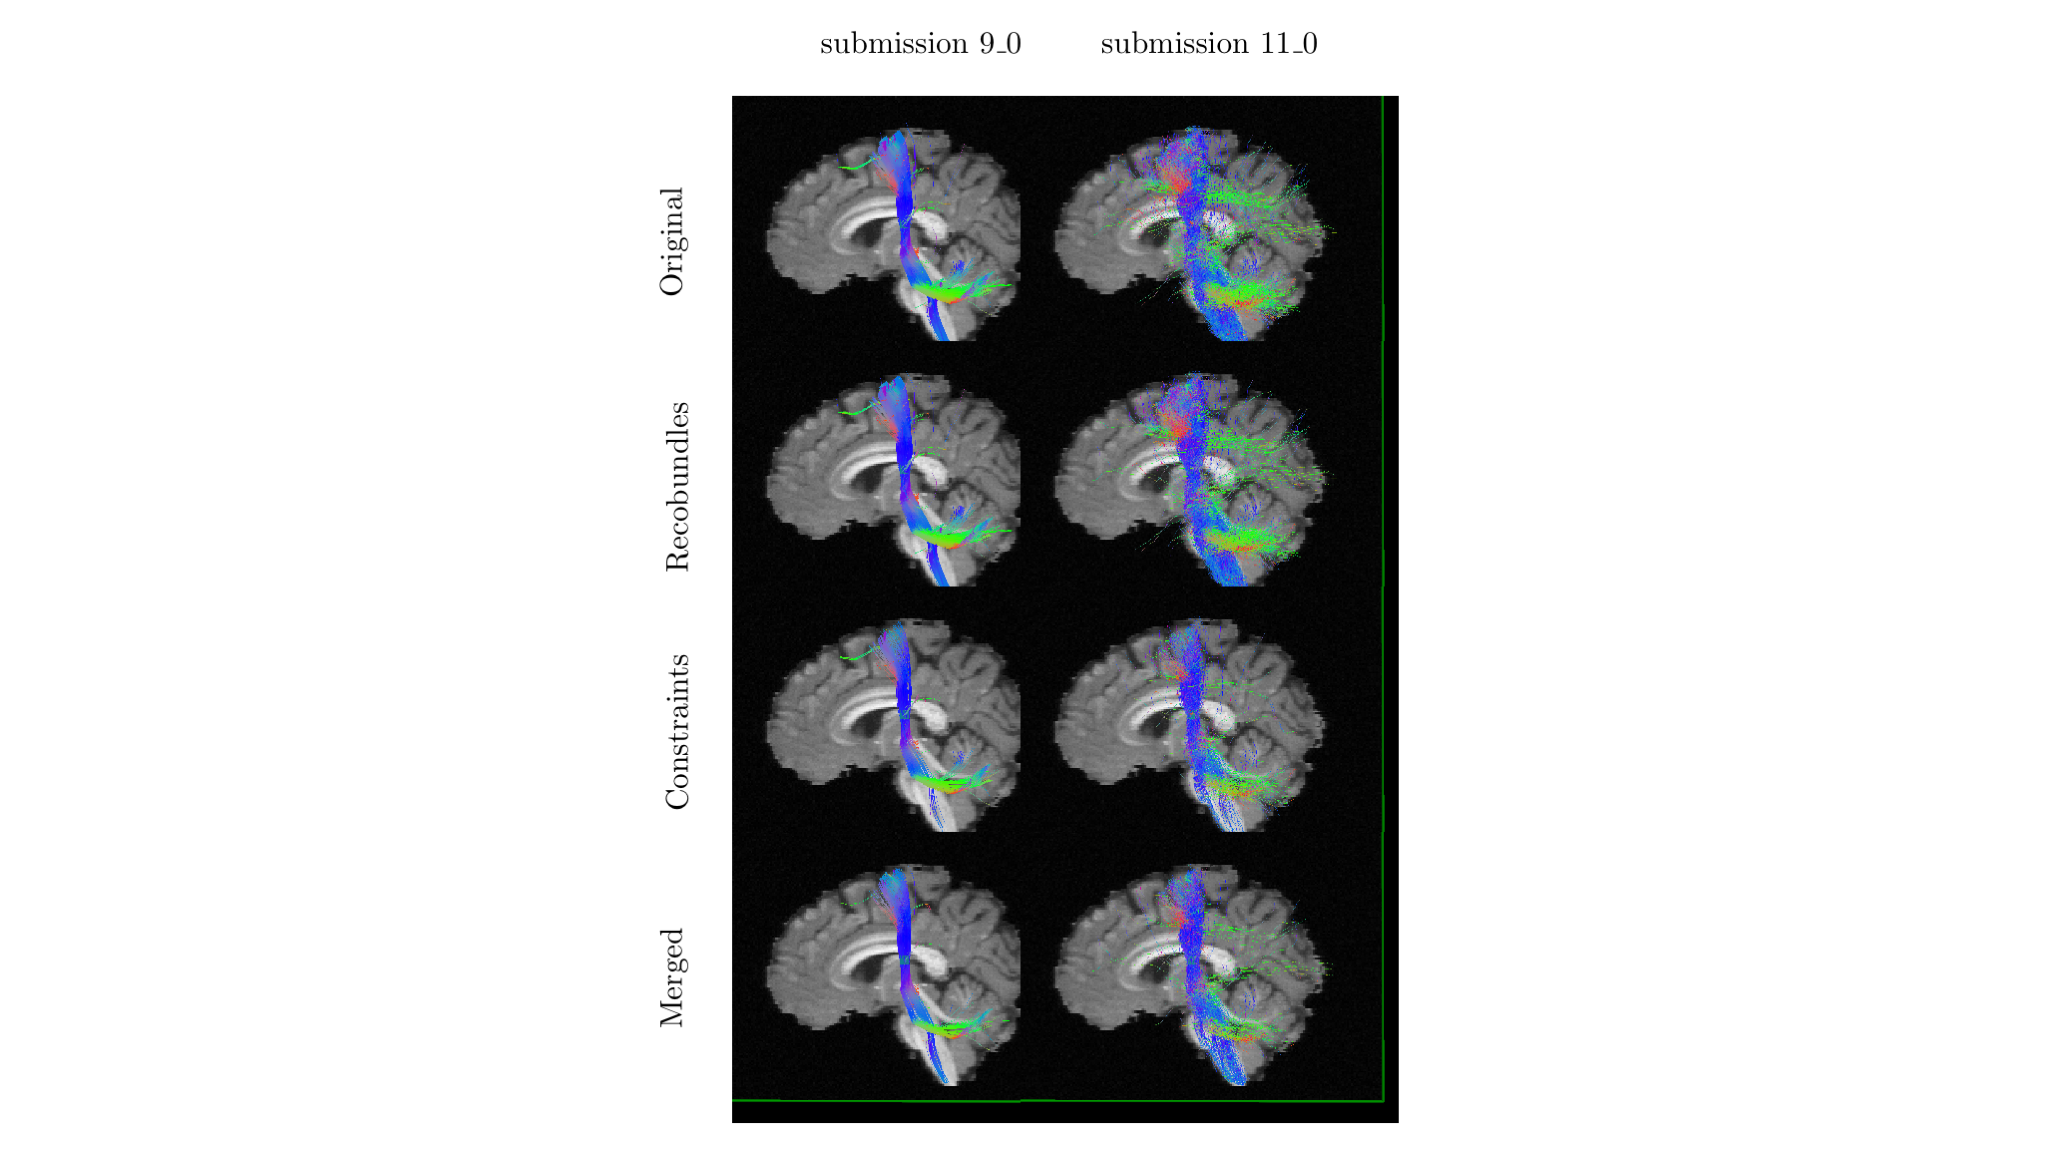
Since the models trained on the HCP data are evaluated on a different data domain, a drop in prediction accuracy was expected (c.f. the Recobundles, Constraints and Merged curves in Fig. 2). However, it is interesting to observe that training on different ground truth definitions improves the prediction performance. Considering the different strengths of our two ground truth definitions (Recobundles: clean positive class; Constraints: clean negative class), this can be an interesting approach to obtain a classifier which combines the characteristics of two individual methods. Visual comparison (Fig. 3) and tractometer metrics (Table 2) show the same trend.
Conclusion
We propose a deep learning-based approach for tractogram filtering which relies solely on the diffusion signal as input. We show in a synthetic setting that our CNN model is able to generalize its prediction among different tractography approaches. The idea of combining different ground truth methods seems promising, while the generalization among different sets of diffusion measurements remains to be investigated in future experiments.Acknowledgements
No acknowledgement found.References
[1] K. H. Maier-Hein et al., “The challenge of mapping the human connectome based on diffusion tractography,” Nature Communications, 2017.
[2] E. Garyfallidis, M. A. Côté, F. Rheault, J. Sidhu, J. Hau, L. Petit, D. Fortin, S. Cunanne, and M. Descoteaux, “Recognition of white matter bundles using local and global streamline-based registration and clustering,” NeuroImage, 2018.
[3] F. Zhang, Y. Wu, I. Norton, L. Rigolo, Y. Rathi, N. Makris, and L. J. O’Donnell, “An anatomically curated fiber clustering white matter atlas for consistent white matter tract parcellation across the lifespan,” NeuroImage, 2018.
[4] A. Daducci, A. Dal Palù, A. Lemkaddem, and J. P. Thiran, “COMMIT: Convex optimization modeling for microstructure informed tractography,” IEEE Transactions on Medical Imaging, 2015.
[5] F. Pestilli, J. D. Yeatman, A. Rokem, K. N. Kay, and B. A. Wandell, “Evaluation and statistical inference for human connectomes,” Nature Methods, 2014.
[6] V. Gupta, S. I. Thomopoulos, C. K. Corbin, F. Rashid, and P. M. Thompson, “FIBERNET 2.0: An automatic neural network based tool for clustering white matter fibers in the brain,” in 2018 IEEE 15th International Symposium on Biomedical Imaging (ISBI 2018), pp. 708–711, IEEE, 2018.
[7] P. D. Ngattai Lam, G. Belhomme, J. Ferrall, B. Patterson, M. Styner, and J. C. Prieto, “TRAFIC: Fiber Tract Classification Using Deep Learning.,” Proceedings of SPIE–the International Society for Optical Engineering, vol. 10574, 2018.
[8] B. W. Kreher, I. Mader, and V. Kiselev, “Gibbs tracking: A novel approach for the reconstruction of neuronal pathways,” Magnetic Resonance in Medicine, 2008.
[9] M. Reisert, I. Mader, C. Anastasopoulos, M. Weigel, S. Schnell, and V. Kiselev, “Global fiber reconstruction becomes practical,” NeuroImage, 2011.
[10] D. P. Kingma and J. L. Ba, “Adam: A Method for Stochastic Optimization,” in ICLR, 2015.
[11] M.-A. Côté, G. Girard, A. Boré, E. Garyfallidis, J.-C. Houde, and M. Descoteaux, “Tractometer: Towards validation of tractography pipelines,” Medical Image Analysis, vol. 17, no. 7, pp. 844–857, 2013.
Figures