3373
Structural anatomy of the executive control network – a high angular resolution diffusion MRI study1Australian eHealth Research Centre, CSIRO, Brisbane, Australia, 2Department of Biomedical Sciences, Macquarie University, Sydney, Australia, 3Sydney Translational Imaging Laboratory, Heart Research Institute, University of Sydney, Sydney, Australia, 4Department of Radiology, Royal Prince Alfred Hospital, Sydney, Australia
Synopsis
In this abstract, our aim is to investigate the relationship between executive function and the underlying structures of the executive control network (ECN) in the normal population. To this end, we acquired multi-shell diffusion MRI data with 391 gradient directions to estimate the structural connectivity within this functionally-defined network, and evaluated the executive function of the subjects. We used network-based statistic (NBS) to assess the relationships between executive function and the ECN connectivity, and found that the structural connectivity between hemispheres displayed positive correlation with higher executive function performance, while the connectivity within a sub-network in the right hemisphere showed a negative correlation with executive function.
Introduction
Executive function is crucial to successful daily living but circuitry underlying this complex capability has not been clearly defined. Studies of functional activation have identified commonly-described components including prefrontal cortex, frontopolar cortex and posterior parietal cortex [1]. These components now understood to form the executive control network (ECN). It is often assumed that the functional connectivity within the ECN reflects underlying structural connectivity. High angular resolution diffusion MRI is capable of revealing the structure of white matter tracts with great detail and accuracy. This study aims to evaluate the structural connectivity of the ECN and its relationship to executive function using high-angular resolution diffusion MRI and a standardised cognitive battery.Methods
Data were gathered from normal subjects drawn from the Chronic Diseases Connectome Project (CDCP; n=88, age 39.4±16.2, 53% female). Executive function was measured using a variant of the Austin Maze as part of the WebNeuro computerised battery [2]. Diffusion MRI data were acquired on a 3T GE 750w: 2mm3, TE=91.8 ms, TR=4323 ms, FA=90°, 391 directions; 3 shells at b=700 (25), 1000 (40), 2800 (75) mm/s2, including 8 b=0 volumes, multiband factor=3, in-plane acceleration factor=2, ~25 minutes. T1-weighted images were acquired using MPRAGE PROMO: 1 mm3, matrix=256x256, TE=2.4 ms, TR=5752 ms, TI=900 ms, FA=8°.
Diffusion data were de-noised using the MRtrix3 package [3], then susceptibility and eddy current induced distortions were corrected for using the FSL’s topup & eddy [4, 5]. Fibre orientation distributions were obtained by first estimating tissue response functions using the Dhollander algorithm then applying a multi-shell multi-tissue constrained spherical deconvolution on the corrected dataset using the MRtrix3 package [6, 7]. Automated segmentation of the T1-weighted image was performed using Freesurfer [8]. Probabilistic anatomically-constrained [9] tractography and filtering was applied [10] to measure connectivity of the ECN defined by a standardised functional-MRI-based atlas [11]. Network-based statistic (NBS) was used to assess the relationships between connectivity and executive control.
Results
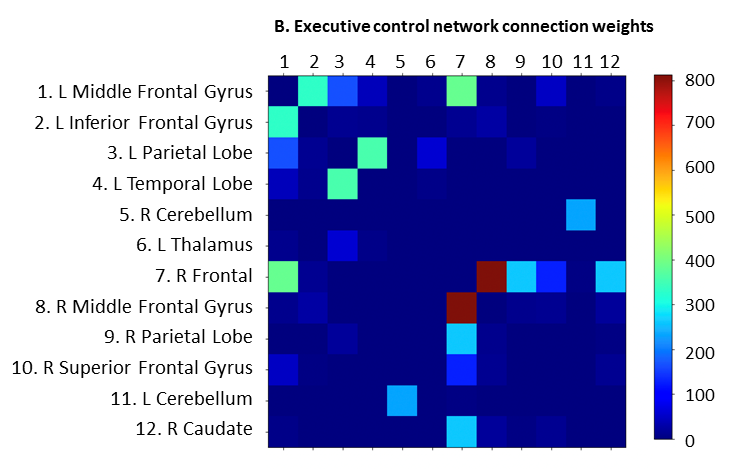
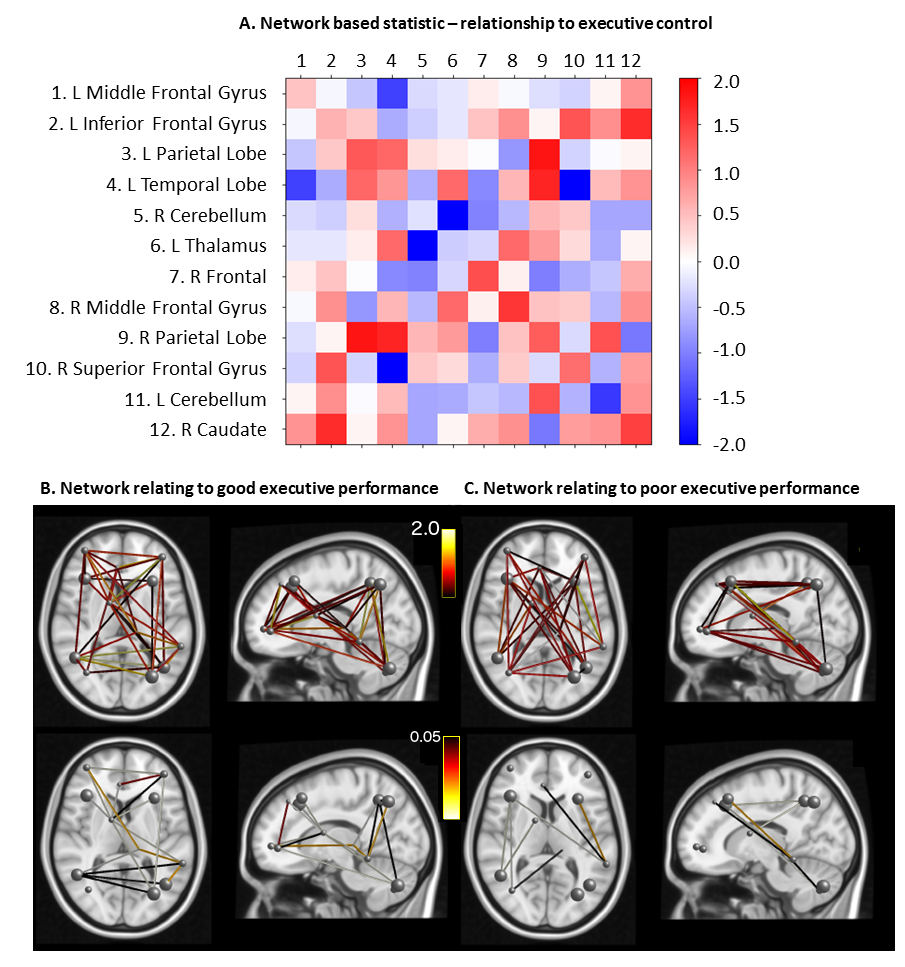
Subjects scored normally for executive function (Z=0.07±1.05, relative to a large normative cohort n>10,000 [2]). Figure 1 shows the average structural connectivity matrix across the whole brain (Figure 1a), and for the functionally-defined ECN (Figure 1b). The strongest connections of the ECN are within the frontal lobe between the left and right middle, superior and inferior frontal gyri, both within and between hemispheres. Other strong connections were present between the left temporal and parietal regions, the cerebellar hemispheres and between the caudate and frontal regions. These structural results closely correspond to data from functional connectivity studies [1]. The NBS analysis revealed significant networks relating to both better and poorer executive function (Figure 2). The network relating to higher executive performance included mostly commissural connections between the right caudate, which acts as a hub, and the right and left parietal and temporal lobes. The network relating to poor executive performance was predominantly comprised of anterior-posterior connections between parietal and superior frontal regions, as well as from the cerebellum to caudate nucleus.Discussion
Our results uniquely suggest that commissural connections in the ECN are positively correlated with executive performance, while negative correlation with executive performance is shown in the association ECN connections within the right hemisphere.Conclusion
In summary, we assessed the relationship between the executive function and the network property within the functionally-defined ECN nodes, using multi-shell diffusion MRI data with high angular resolution (391 gradient directions). We found patterns of structural connectivity that are positively correlated with executive function across the hemisphere, while within the right hemisphere a negative correlation is shown.Acknowledgements
No acknowledgement found.References
[1] Damoiseaux, J.S., et al., Consistent resting-state networks across healthy subjects. Proc Natl Acad Sci U S A, 2006. 103(37): p. 13848-53.
[2] Silverstein, S.M., et al., Development and validation of a World-Wide-Web-based neurocognitive assessment battery: WebNeuro. Behav Res Methods, 2007. 39(4): p. 940-9.
[3] Veraart, J., et al., Denoising of diffusion MRI using random matrix theory. Neuroimage, 2016. 142: p. 394-406.
[4]Andersson, J.L., S. Skare, and J. Ashburner, How to correct susceptibility distortions in spin-echo echo-planar images: application to diffusion tensor imaging. Neuroimage, 2003. 20(2): p. 870-88.
[5] Andersson, J.L.R. and S.N. Sotiropoulos, An integrated approach to correction for off-resonance effects and subject movement in diffusion MR imaging. Neuroimage, 2016. 125: p. 1063-1078.
[6] Dhollander, T., D. Raffelt, and A. Connelly, Accuracy of response function estimation algorithms for 3-tissue spherical deconvolution of diverse quality diffusion MRI data. 2018.
[7] Jeurissen, B., et al., Multi-tissue constrained spherical deconvolution for improved analysis of multi-shell diffusion MRI data. Neuroimage, 2014. 103: p. 411-426.
[8] Fischl, B., FreeSurfer. Neuroimage, 2012. 62(2): p. 774-81.
[9] Smith, R.E., et al., Anatomically-constrained tractography: improved diffusion MRI streamlines tractography through effective use of anatomical information. Neuroimage, 2012. 62(3): p. 1924-38.
[10] Smith, R.E., et al., SIFT2: Enabling dense quantitative assessment of brain white matter connectivity using streamlines tractography. Neuroimage, 2015. 119: p. 338-51.
[11] Shirer, W.R., et al., Decoding subject-driven cognitive states with whole-brain connectivity patterns. Cereb Cortex, 2012. 22(1): p. 158-65.
Figures