3368
Bundle Analytics: a computational and statistical analyses framework for tractometric studies1Intelligent Systems Engineering, Indiana University Bloomington, Bloomington, IN, United States, 2School of Public Health, Indiana University Bloomington, Bloomington, IN, United States, 3Pervasive Technology Institute, Indiana University Bloomington, Bloomington, IN, United States
Synopsis
Bundle Analytics promises fast, robust, and flexible computational and statistical analyses for tractometric studies on clinical data. It uses information from both tractometry, and anatomy to analyze the extracted fiber bundles from challenging clinical datasets. It uses streamline-based efficient algorithms to register and extract fiber bundles from a tractogram, and applies linear mixed models in the extracted bundles to find significant differences at specific locations of the bundles across groups. Finally, the method does not require training, an important advantage over deep learning methods.
Introduction
There is an exciting explosion of methods that analyze tractograms and combine them with anatomical information. However, building such pipelines needs careful consideration especially for clinical applications. In this paper we present Bundle Analytics, a framework that can precisely extract bundles and perform statistical analysis across populations. The input of the framework are tractograms and anatomy files. This framework is robust, fast, flexible, and applicable on every kind of data including hard to process clinical data.
Methods
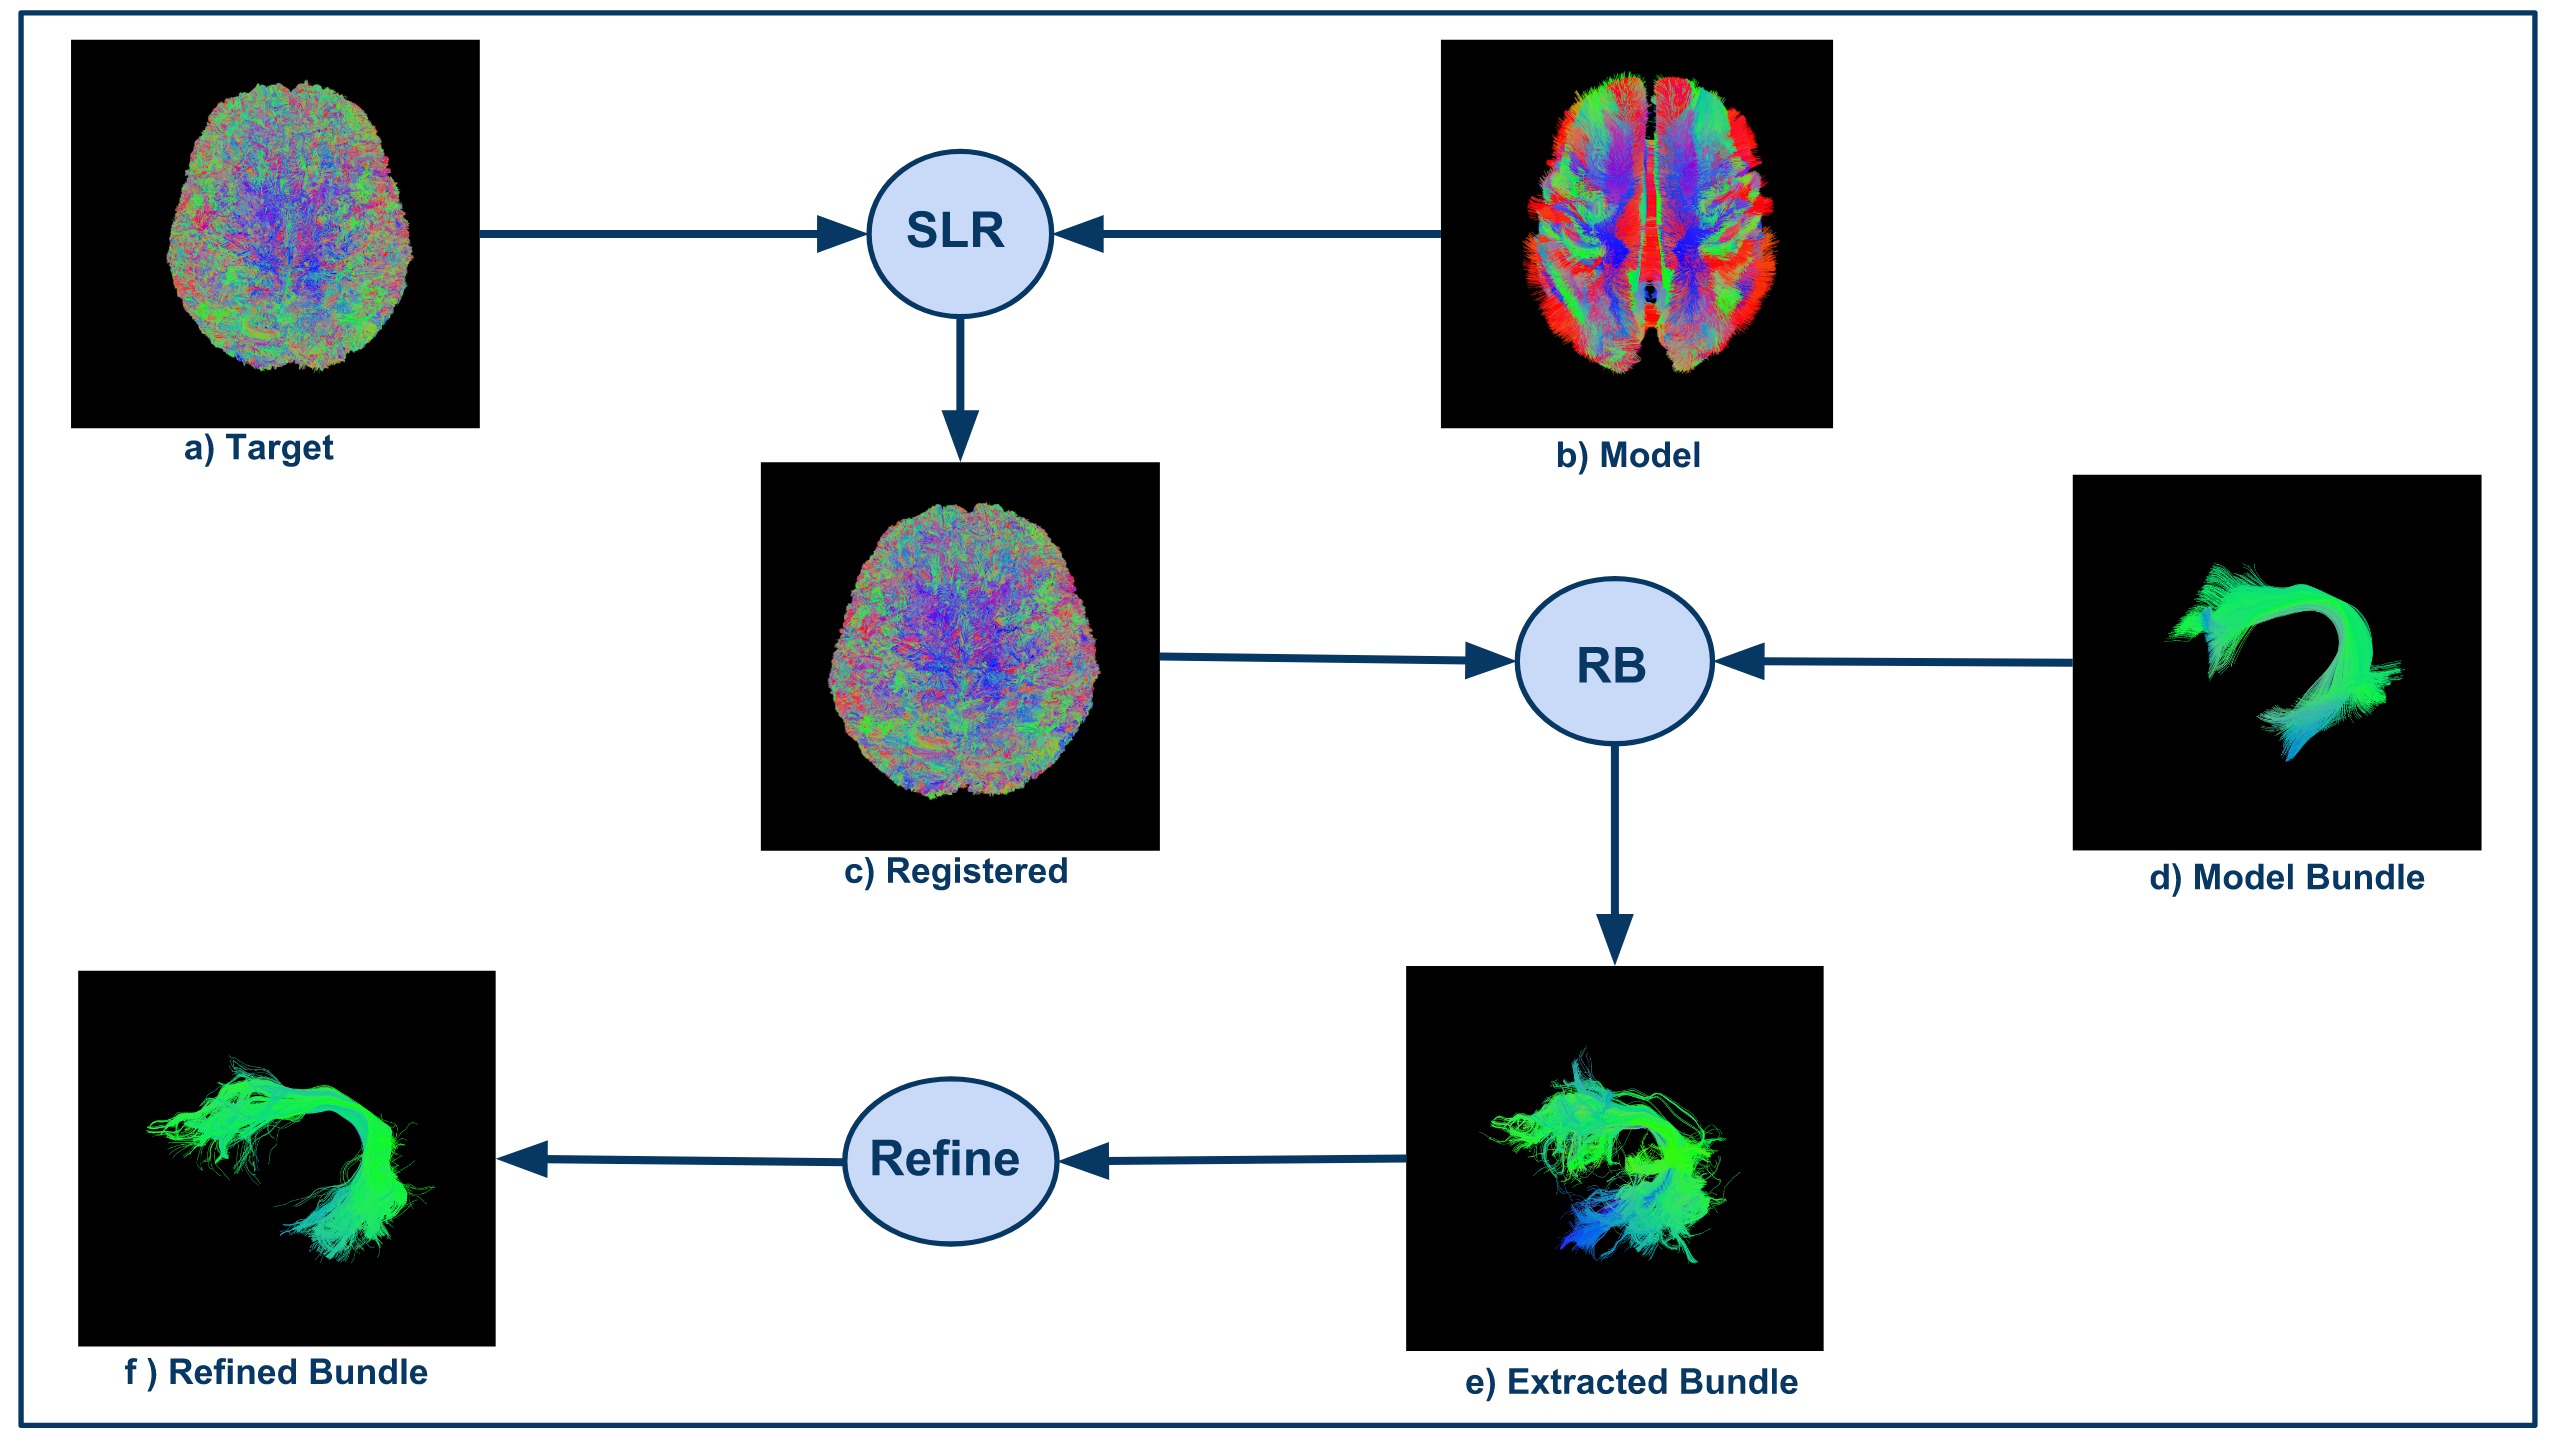
Bundles analytics uses the advantages of streamline-based analysis to solve hard clinical analysis problems. It takes a target tractogram and registers it to a model tractogram using Streamline-based Linear Registration algorithm1 . Model bundle is used to extract bundle from registered tractogram using a new version of RecoBundles 2 . This refined version of RecoBundles uses output from standard RecoBundles as new model bundle and extracts more streamlines from tractogram. It allows us to reach accurate streamlines as new model bundle is already part of tractogram. Finally, we register and autoprune this new extracted bundle with original model bundle. This method is useful when we are dealing with noisy data or when we want to extract small bundles from tractograms. See Fig.1 for a visual description of the workflow.
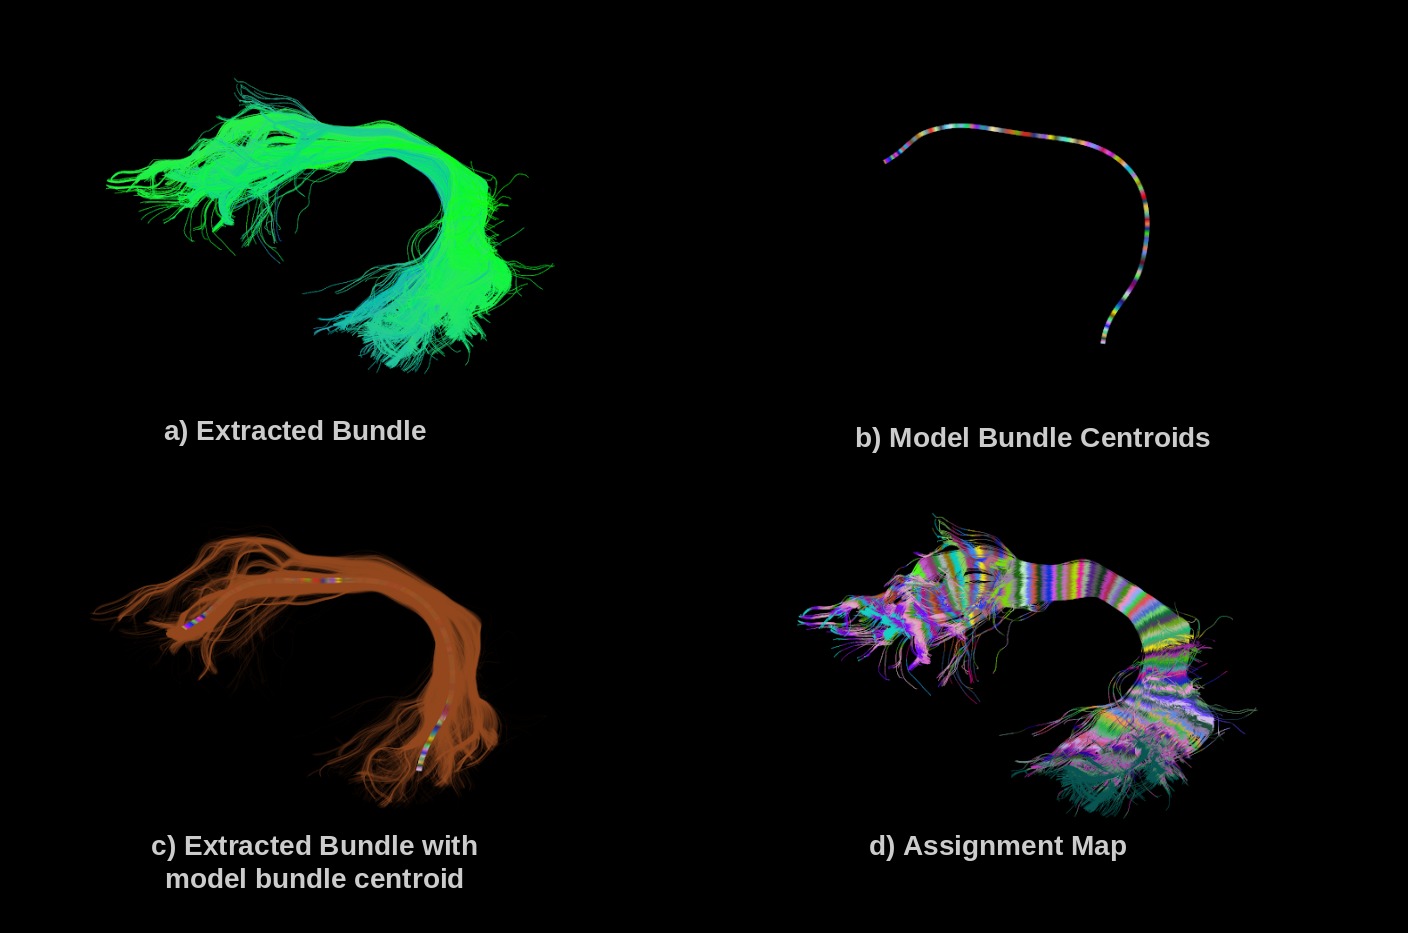
For the statistical part of our framework, we segment the bundles into segments using the model bundle centroids along their lengths in common space. We call this the assignment map. For creating this assignment map, we calculate euclidean distances between every point on streamline to all the model bundle centroids and assign it to the nearest segment centroid similar to Cousineau et al. 7. Assignments are created in common space, which ensures that segment index corresponds to the same centroid across all populations. Fig.2 Shows visual process of creating assignment maps on bundle in common space.
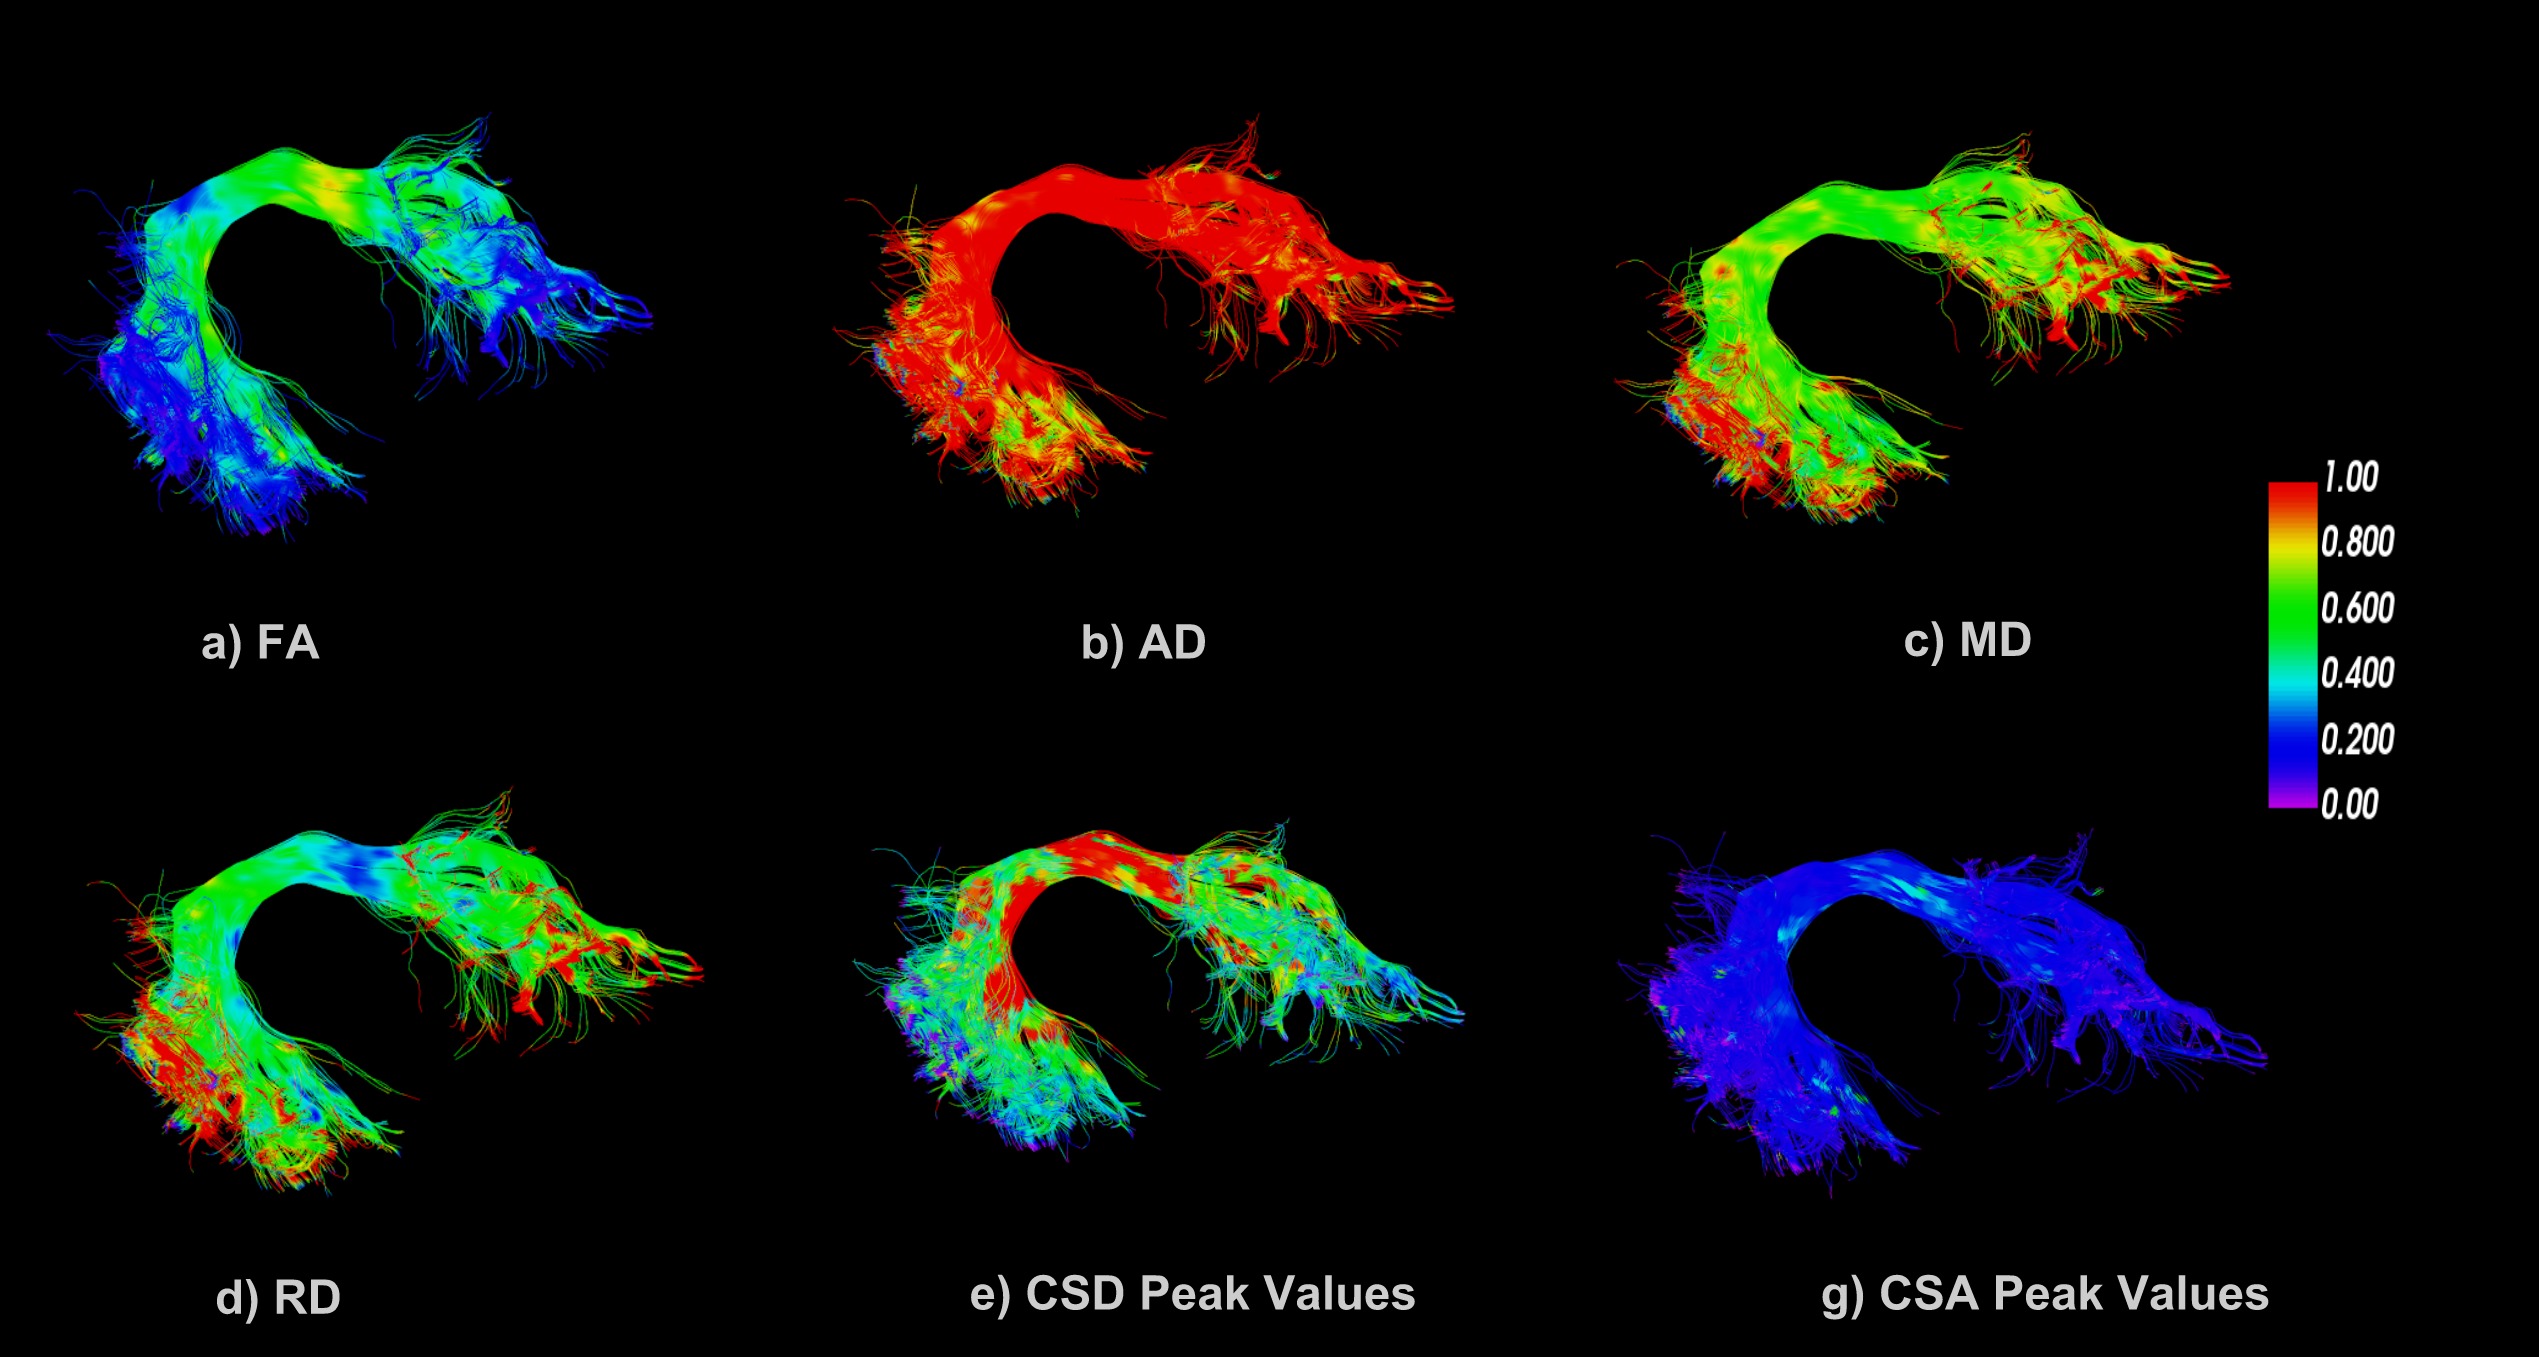
In the final step, we take bundles back into native space and use information from anatomy to perform statistical analysis on bundles in native space. In this abstract, we are using DTI measures, FA, AD, MD, and RD along with CSA and CSD peak values (generated from DIPY6). we apply linear mixed models on these metrics for statistical analysis. Fig.3 shows the different metrics visualized on fiber bundle in native space.
Results
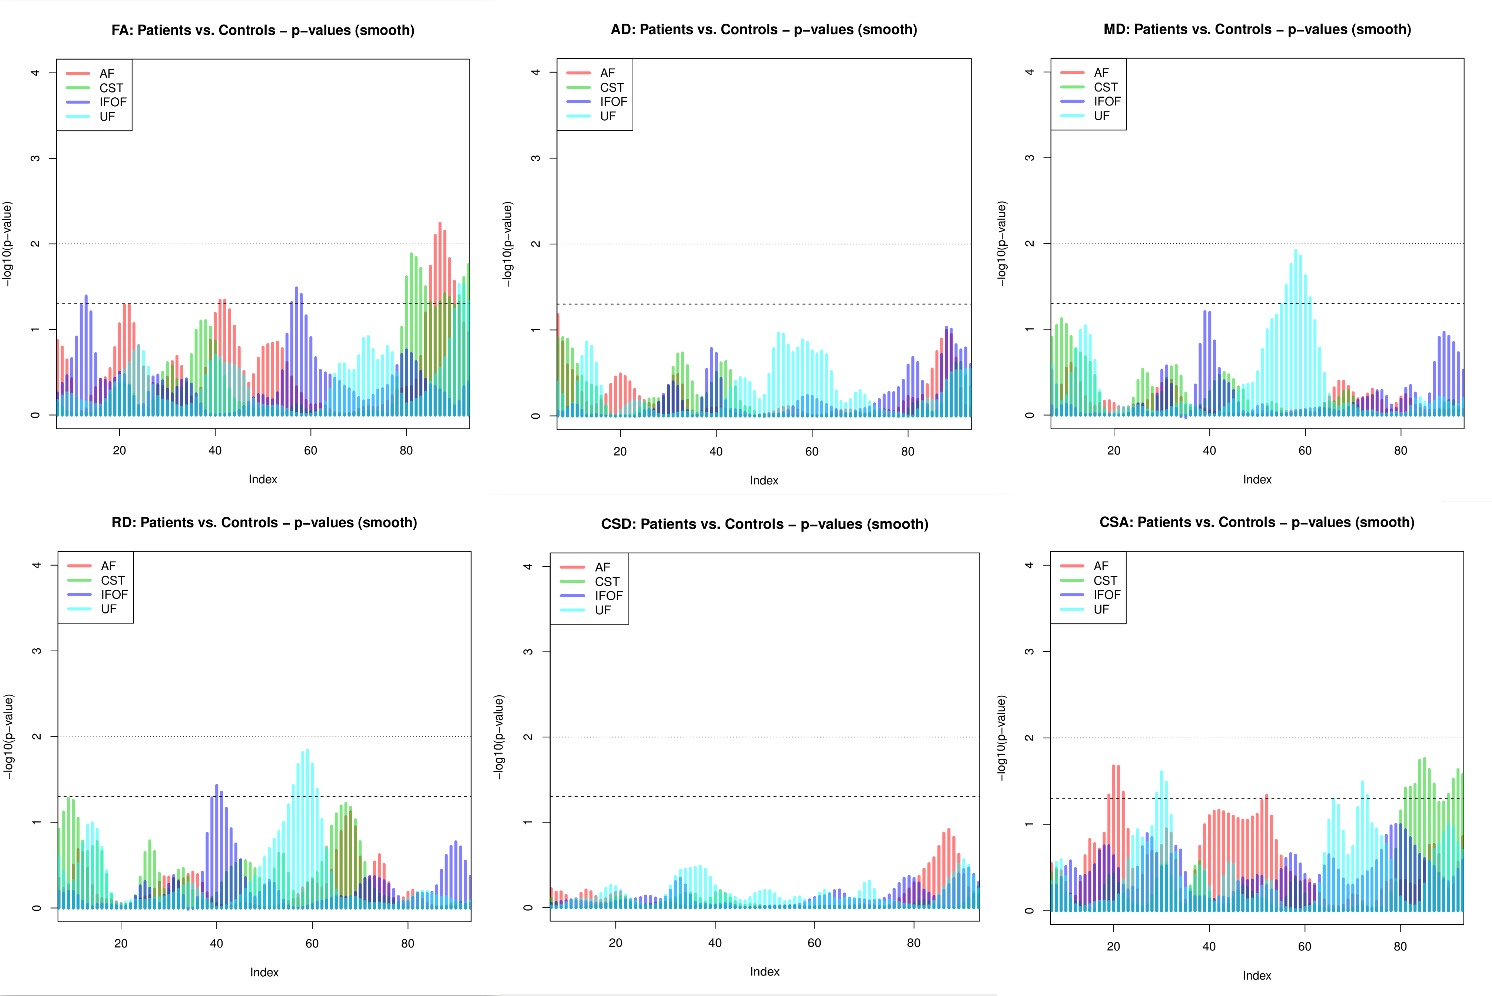
In this experiment, we have used data of 10 patients and 10 controls from publically available Parkinson’s Progression Markers Initiative data set (PPMI) 3 to extract four tracts – arcuate fasciculus (AF), corticospinal tract (CST), occipitofrontal fasciculus (IFOF) and uncinate fasciculus (UF). Model atlas and model bundles used in this experiment were curated by tuning some model bundles from publically available HCP-842 4 template using DIPY. We curated the atlas by removing unrealistic pathways and transformed the model bundles to the MNI space.Data were summarized in the common space by associating DTI measures (FA, MD, RD and AD) and CSA, and CSD peak values with the streamline points projected onto the tract-specific “centroid”. Comparisons between groups (patients vs. controls) were done using linear mixed models which adjusted for the correlations between the streamline data extracted from the same tract. Fig.4 shows the analyses summary for the segments 10 to 90 (from the total of 100 segments) for each tract. Statistically significant (alpha = 0.01) differences between the groups were found in FA along the AF tract between segments 82 and 84.Discussion and Conclusion
Bundle Analytics provides a way to use tractometry and connect it with anatomy information for analysis. Our proposed method is fast and robust with clinical data. It does not need nonlinear image registration which can be hard when dealing with patient data. Researchers do not have training data for most clinical cases and Bundle Analytics can be directly used for these cases. It does not need any training data as compared to deep learning methods 5,10 which need labeled patient data which are hard to find. Deep learning systems can only extract bundles used in training data. Our methods are extremely flexible, new bundles can be found given user atlases and model bundles. Bundle Analytics can also be used with other animal brains. There are no theoretical or other limitations that restrict usage to other species. However, this is future research.For statistical analysis, it works with linear mixed models. However, it is trivial to include advanced methods including predictive machine learning. The Bundle Analytics method will be publically available in DIPY and will be accessible from the command line, python scripts, and web apps (available in BrainLife11).Acknowledgements
We would like to thank NIH R01EB027585 for supporting the PI and first author.References
[1] Garyfallidis et al. Robust and efficient linear registration of white-matter fascicles in the space of streamlines, NeuroImage, 117, 124--140, 2015
[2] Garyfallidis et al. Recognition of white matter bundles using local and global streamline-based registration and clustering, Neuroimage, 2017.
[3] The Michael J. Fox Foundation for Parkinson's Research, New York, NY
[4] Yeh et al. NTU-90: a high angular resolution brain atlas constructed by q-space diffeomorphic reconstruction. Neuroimage. 2011 Sep 1;58(1):91-9
[5] Ngattai Lam et al. TRAFIC: Fiber Tract Classification Using Deep Learning, NCBI, 2017
[6] Garyfallidis et al. Dipy, a library for the analysis of diffusion MRI data Front. Neuroinform., 8 (2014)
[7] Cousineau et al., A test-retest study on Parkinson's PPMI dataset yields statistically significant white matter fascicles, NeuroImage: Clinical, 2017
[8] Dayan et al., Profilometry: A new statistical framework for the characterization of white matter pathways, with application to multiple sclerosis, NCBI, 2016
[9] Yeatman et al., Tract Profiles of White Matter Properties: Automating Fiber-Tract Quantification, NCBI, 2012
[10] Wasserthal et al., TractSeg - Fast and accurate white matter tract segmentation, NeuroImage, 2018
[11] https://brainlife.io
Figures